Trading Game of the day 5 August 2025Trading Plan :-
1-Bias
2-narrative
3-context
4-entry
5-risk management
Futures market

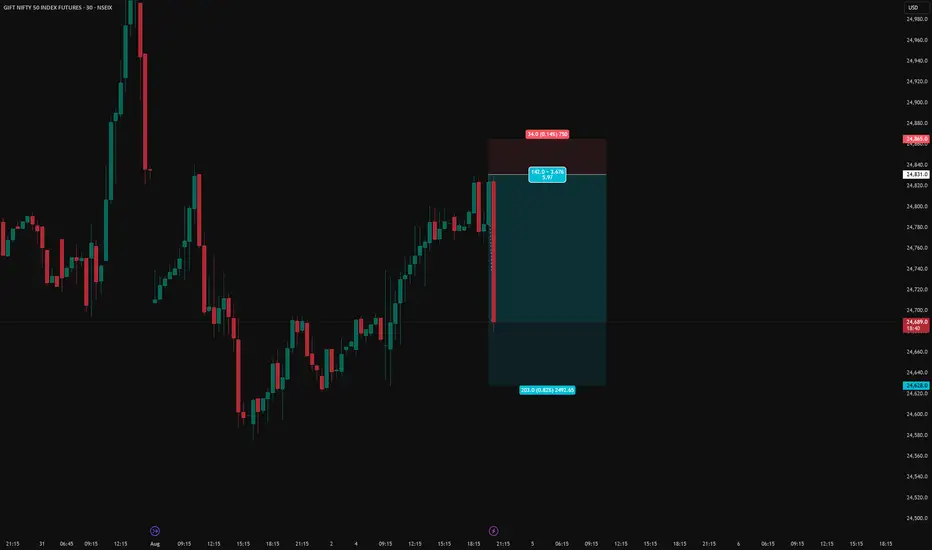
GIFT NIFTY short setupGIFT NIFTY short setup
Entry - 24831
SL - 24865
Target - 24628.0
Risk Reward - Approx 1:6
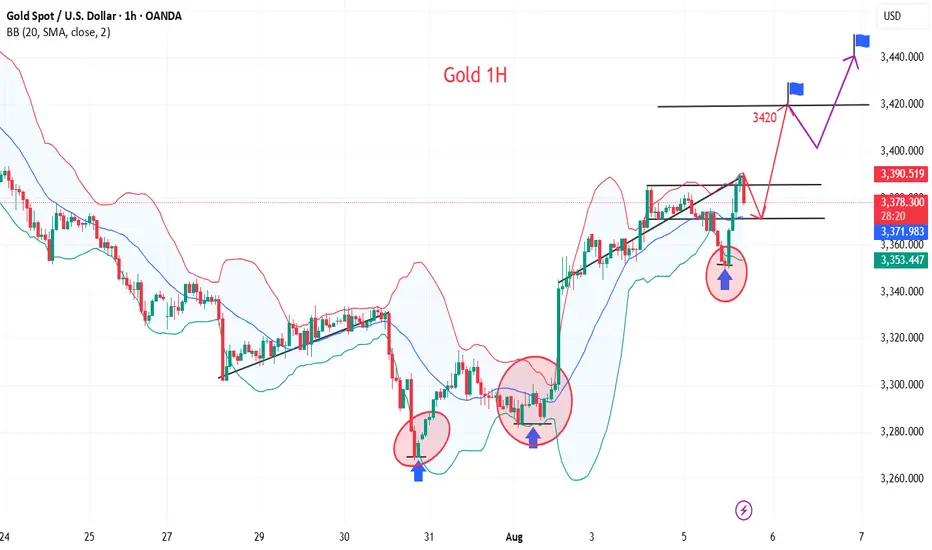
EW - Watching (b) Pullback for Next Bull WaveGame plan:
Watching for the (b) wave pullback. Key support is around 3,362–3,340.
If price corrects into this zone and shows bullish signs (wick rejection, strong bounce), I’ll look for a long setup.
Target: Initial target back to the 3,389–3,393 resistance area. If momentum is strong, will let some ride towards 3,421 +.
Stop loss: Just below the support zone (e.g. under 3,340 or the most recent swing low).
If price drops much further, I’ll be eyeing 3,298 as the next potential buy zone.
Key rule: If price breaks below 3,281 (Wave ii), I’m out. Not holding any longs if this support fails.

Gold breaks through 3400 and is about to challenge a new high
💡Message Strategy
Fundamental Analysis: The Macro Environment and Policy Expectations Are Intertwined
From a fundamental perspective, the recent trend in gold prices is driven by multiple factors. First, rising expectations for a September Federal Reserve rate cut have become a key factor supporting gold prices. Last Friday's US non-farm payroll data, which fell short of expectations and saw a significant downward revision from the previous reading, fueled market concerns about an economic slowdown and pushed US Treasury yields lower.
The increased expectations for a rate cut have reduced the upside potential for the US dollar and US Treasury yields, indirectly providing support for gold.
In terms of market sentiment, a rebound in global stock markets has weakened gold's safe-haven demand. The MSCI World Index snapped a six-day losing streak, with the Asia-Pacific Index rising 0.6%. Japan's Nikkei 225 rose 280 points on Tuesday. Europe's STOXX 50 and STOXX 600 indices both rose approximately 0.4%. The UK's FTSE 100 approached its all-time high of 9,150 points. The three major US stock indices performed particularly strongly on Monday, with the S&P 500 rising 1.5%, the Dow Jones Industrial Average soaring 585 points, and the Nasdaq Composite Index rising 1.9%.
The recovery of risk appetite has made investors more inclined to chase high-yield assets, and the attractiveness of gold has temporarily declined.
📊Technical aspects
Technically, gold is likely to continue trading in a narrow range between its 50-day and 100-day moving averages. Key support levels at $3,350 and resistance at $3,385 will be the focus of near-term bull-bear trading. A breakout from fundamental data or news could signal a clearer trend for gold prices.
In the long term, slowing global economic growth, central bank gold purchasing, and persistent geopolitical risks will continue to provide structural support for gold.
If the bulls can regain their footing on the bottom of the ascending triangle pattern and break through the resistance level of $3,380, gold prices are expected to further challenge $3,440 and even retest the historical high.
💰Strategy Package
Long Position:3370-3375,SL:3350,Target: 3400-3420
BULLISH XAUUSD SETUPClean breakout setup with multiple confluences:
✅ Trendline Breakout (blue)
✅ 50 SMA Reclaim (yellow)
✅ Successful Retest (green circle)
✅ Momentum Push Through TP1, TP2
🔜 Approaching TP3, heading towards FINAL TP @ 3433.06
📌 This move was anticipated after structure shifted bullish with strong volume. As long as price holds above 3373.69, I'm maintaining a bullish bias.
🔔 Key Levels:
TP1: 3332.34 ✅
TP2: 3373.69 ✅
TP3: 3401.96
Final TP: 3433.06
Let’s see if the bulls have the strength to push all the way!

What does it matter if every step is just right?Today's gold fluctuation rhythm is basically consistent with our prediction. The rhythm from entry to profit-taking is clear, and the strategy is executed decisively. First, we decisively arranged long orders at the 3365-3370 line, and successfully took profit at the target line 3375, earning 150pips of profit. Then we decisively reversed and arranged short orders at 3375. The market fell back to around 3360 as expected, and realized 150pips of profit again. In the third round of operations, long orders were entered again near 3352, and the price rose smoothly to 3370 to take profit again. The overall rhythm was tight and profits were steadily pocketed. At present, gold has rebounded to around 3380-3385. We have deployed a new round of short orders in advance and will wait for the price to drop before arranging long orders. Overall, gold is in a volatile rhythm. Even if there is still room for upward movement in the future, it is likely to undergo a round of technical retracement adjustments first.
(Updated) Silver Rebounds from Golden ZoneSilver dumped hard into the Golden Zone and reversed exactly where we marked it. Bulls stepping in? Now we watch for follow-through.
📌 Price respected the Golden Zone and reversed clean
📌 Bullish break and EMA shift underway
📌 Watching for continuation toward $38
⏱️ Timeframe: 1H
#silver #xagusd #fibonacci #reversalsetup #technicalanalysis #tradingview #quanttradingpro

NASDAQ 100 BOUNCE OFF SUPPORT FROM BUY ZONE!Hey Traders so today looking again at the Nasdaq 100 looks like we got a bounce right off the level of support that I thought it could hold 22,806.
Why that level?
I trade off the daily charts so every candle is one day and I believe that price action is everything in these markets it's all about support and resistance. The market tried 9 days to test that level from 07/03-07/15. But it kept getting rejected then it rallied off it so I just felt that maybe thats a level that the market might halt some of the selling. Ok so maybe I got it right yay!
Guess what? Sometimes we will get it completely wrong! So getting market direction right is only half the battle. The key is risk management.
I have learned it's not how we enter a trade that counts but how we exit. Can we get out with a profit? Ok enough of the classroom for today. 🤓
So where are we market bounced off support at 22,800 yes you are in profit if you took buy zone but we also have risk still in the trade so I say lower the risk by moving the stop about half way up from 22,533 to 22,700. That way if there is a market reversal we don't get stopped out at full loss. Then try to stay 3 days behind the market so it has room to breathe if it can test the all time high again at 22,830 that would be a great place to take some profits!
This is the way I stay 3 days behind the market. But if you have another profit strategy that works better then continue to do what works for you.
However if bearish way until market breaks a strong support level before consider selling into rally.
COT REPORT
LARGE SPECS = NET LONG 34,954
So lets see what happens this week.
Good Luck & Always use Risk Management!
(Just in we are wrong in our analysis most experts recommend never to risk more than 2% of your account equity on any given trade.)
Hope This Helps Your Trading 😃
Clifford

GOLD ROUTE MAP UPDATEHey Everyone,
Another PIPTASTIC day on the charts!!!
After completing our Bullish target 3370 yesterday, we stated that we are now waiting for ema5 lock to confirm gap to 3392.
We got the ema5 lock above 3370 opening 3392. A nice drop into the lower zone just above our bearish gap allowed us to buy dips inline with our plans. We got the push up all the way into 3390 just short of 3392 gap, so this remains open.
We will keep the above in mind when taking buys from dips. Our updated levels and weighted levels will allow us to track the movement down and then catch bounces up.
We will continue to buy dips using our support levels taking 20 to 40 pips. As stated before each of our level structures give 20 to 40 pip bounces, which is enough for a nice entry and exit. If you back test the levels we shared every week for the past 24 months, you can see how effectively they were used to trade with or against short/mid term swings and trends.
The swing range give bigger bounces then our weighted levels that's the difference between weighted levels and swing ranges.
BULLISH TARGET
3370 - DONE
EMA5 CROSS AND LOCK ABOVE 3370 WILL OPEN THE FOLLOWING BULLISH TARGETS
3392
EMA5 CROSS AND LOCK ABOVE 3392 WILL OPEN THE FOLLOWING BULLISH TARGET
3416
EMA5 CROSS AND LOCK ABOVE 3416 WILL OPEN THE FOLLOWING BULLISH TARGET
3429
EMA5 CROSS AND LOCK ABOVE 3429 WILL OPEN THE FOLLOWING BULLISH TARGET
3439
BEARISH TARGETS
3348
EMA5 CROSS AND LOCK BELOW 3348 WILL OPEN THE FOLLOWING BEARISH TARGET
3328
EMA5 CROSS AND LOCK BELOW 3328 WILL OPEN THE FOLLOWING BEARISH TARGET
3313
EMA5 CROSS AND LOCK BELOW 3313 WILL OPEN THE SWING RANGE
3296
3281
As always, we will keep you all updated with regular updates throughout the week and how we manage the active ideas and setups. Thank you all for your likes, comments and follows, we really appreciate it!
Mr Gold
GoldViewFX

6E : Long levelThe level has been activated, so you can buy it. I have slightly edited it since last time. It is best to scalp or pip it; I cannot promise any significant movement. Be careful when trading on news or at market close/open.

(Updated) Gold Bullish Scenario Playing Out — Next Stop $3,420?Gold broke the bearish trend, retested clean, and now the bullish scenario is unfolding exactly as outlined. EMAs are turning bullish again and price looks ready to test the $3,420 zone.
📌 Bullish structure confirmed after retest
📌 Price holding above EMAs and showing strength
📌 Watching for reaction at $3,420 resistance
⏱️ Timeframe: 1H
#gold #xauusd #tradingstrategy #chartupdate #technicalanalysis #tradingview #quanttradingpro

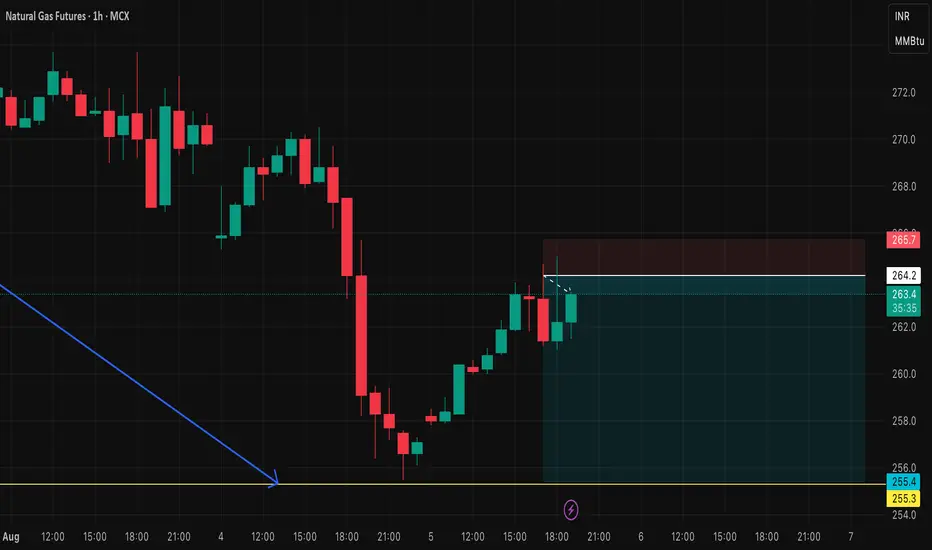
NF FUT short setupNG FUT short setup
Entry price - 264.2
Stop loss - 265.7
Target - 255.5
Risk Reward - 1:5.6
GOLD TRADES IN 2025 TILL AUGUSTThat is the result of discipline and consistency.
follow for more swing analysis on indices, commodities,and currencies.

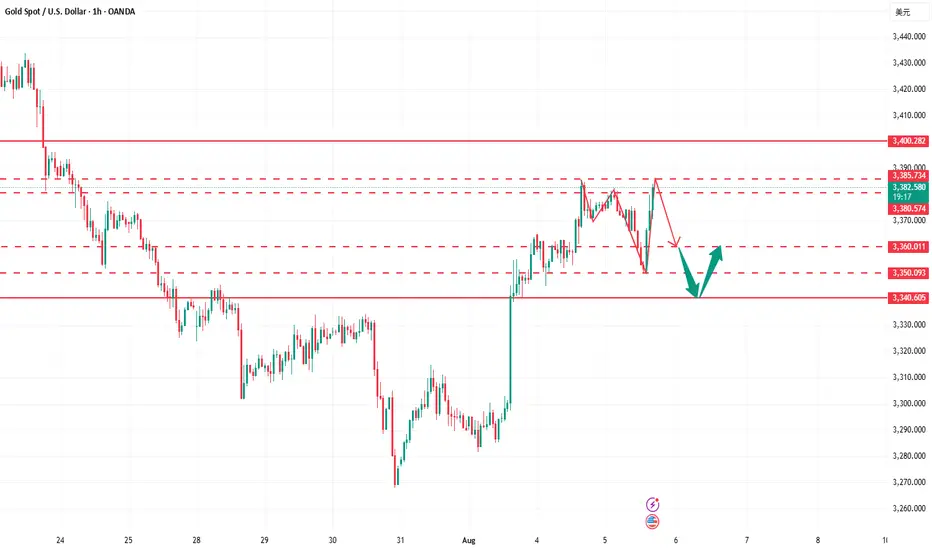
Gold has bottomed out and rebounded. Where will the high point bGold has currently hit a low near 3350, rebounding from the bottom and now rising to around 3390.
Looking at the 1-hour chart:
The most critical upward level is currently around 3390. If the price breaks through this level and stabilizes above it, the late July high of 3430 could be revisited. Conversely, if it remains below 3390, the overall range will remain between 3350 and 3390.
Secondly, looking at the 4-hour chart, we can see that the trend line resistance level is also currently around 3390. If the price stabilizes above 3390, the upper 4-hour chart could directly reach the 3400-3410 range. If the price holds above 3410 again, the next target would be around 3450.

Gold Price Analysis August 5#XAUUSD – Gold continues to increase in wave 3, BUY strategy continues to be prioritized
The D1 candle continued to close with strong increase, confirming that the uptrend is dominant and there are no clear signs of correction. Gold is currently moving in wave 3 - a period with strong amplitude and few recovery beats, so the main trading strategy is still to wait to buy at important support zones.
In the Asian session this morning, the price is reacting at the 3385 zone - an area that can act as a confirmation point for the next recovery. If the buyers maintain their position in this zone, the price will likely continue to move towards higher resistance zones.
🔹 Support zone to watch: 3363 – 3346 – 3332
🔹 Potential resistance zone: 3385 – 3407
👉 Strategy: Prioritize waiting for confirmation signals at support zones to open BUY orders in the direction of the trend. Need to carefully observe the price reaction at the 3385 zone to assess the strength of the buying force during the day.

GOLD 15M BEAR ARE TAKING OVER (IM FULLY SELL THIS WEEK)Gold look like BEARS are back in control, i have take this 15m trade for 2 TARGET SHOWN ON THE CHART (WITH DXY LOOKING VERY BULLISH IN THIS COMING WEEKS, GOLD WILL CORRECT TO DOWNSIDE HARD)
All the best enjoy the sunny LONDON if anyone from there :)

Gold Ascending Triangle Breakout: Targeting $3,463XAU/USD is currently trading at $3,385.91 and has been consolidating in a tight ascending triangle pattern on the weekly chart for the past four months. This structure has formed after a strong impulse move earlier in the year and is now coiling beneath a significant resistance zone at $3,386 to $3,400. Each weekly rejection from this level has added strength to the ceiling, while the consistent formation of higher lows suggests institutional accumulation. Volume has been declining steadily during this period, a classic sign of compression and imminent breakout potential. Fibonacci extensions from the April impulse leg point toward upside targets of $3,463 (1.618), $3,586 (2.0), and $3,708 (2.618). A weekly close above $3,400 with strong volume would confirm the breakout and likely trigger a momentum-driven move toward these levels. Invalidation would occur with a weekly close below $3,330 or a clear break of trendline support. In the current macroeconomic climate—defined by central bank uncertainty, inflationary pressures, and geopolitical tension—gold remains a key hedge. This 4-month consolidation reflects not weakness, but pressure building beneath the surface. As with all sustained triangles, the longer the base, the stronger the breakout. A move from this structure could define the next major phase for gold heading into Q4 2025.

TRADE UPDATE XAUUSD Hey everyone at the start of the week we was waiting to see if price would pullback to 3,250 zone to take buys after price missed our entry just a little bit of pips if you check out my last few posts but my projections for Gold is that price might be heading to 3434 zone and can’t see a pullback to our area of interest and if price get to the 3434 zone I will be waiting to see if sellers would jump in or I wait for a breakout so I will update you guys before the week ends or if am about to execute a trade….

GOLD (XAUUSD) Wave analysis -Update 5/8/2025 GOLD (XAUUSD) Wave analysis -Update 5/8/2025
See the chart

GOLD short term Analysis. - 15 mins. Gold (XAU/USD) – Harmonic Pattern Analysis (15m Chart)
As of: August 5, 2025
🔶 Pattern Observed: Bearish Harmonic (likely Gartley or Butterfly)
Pattern Completion: Near 3385–3390 zone
The price has tested the PRZ (Potential Reversal Zone) and started showing early signs of weakness.
A clear "Short only below here" marker is drawn just below 3370, signaling key support.
🔻 Short Trade Thesis:
If price breaks and sustains below 3370, bearish confirmation is triggered.
This confirms the harmonic pattern's validity and opens the path for impulsive downside targets.
🎯 Downside Targets (if 3370 breaks):
First target: 3310–3320
Second target: 3265–3270
Final target (extended move): 3180–3200
⚠️ Invalidation:
If price breaks above 3395–3400, the harmonic setup is invalidated.
In such case, avoid any short setups and re-analyze price action for new trend direction.
Conclusion:
This harmonic pattern suggests a high-probability short setup below 3370, with clean targets mapped out. However, it's critically important to wait for confirmation (break and retest or strong momentum candle) before entry. If the price starts moving up from current levels without breaching 3370, this setup becomes invalid.
⚠️ Disclaimer:
This analysis is for educational and informational purposes only and should not be considered as financial advice. Trading commodities and financial instruments involves significant risk and may not be suitable for all investors. Please perform your own due diligence or consult with a licensed financial advisor before making any trading decisions. The author is not liable for any losses incurred based on this analysis.

XAUUSD 8/4/25 followupPrice closed strongly above Sunday's open so I am just looking for retracements to the upside from here.

GOLD RAID ON – Bullish Limit Orders Are LIVE! XAU/USD💰GOLD HEIST IN PROGRESS! XAU/USD BULLISH RAID BEGINS! 🏴☠️📈
Asset: XAU/USD – Gold vs U.S Dollar
📊 Plan: BULLISH ROBBERY
🎯 Target: 3460.00
🛑 Stop Loss: 3330.00
📥 Entry: ANY level – vault is wide open!
👑 THIEF MODE ACTIVATED – Time to raid GOLD like a pro. We’re stacking multiple limit orders (layering entries) just like setting traps for those greedy bears 🐻💥
🚪💼 Entry strategy:
“The vault is unlocked – grab your bag and go!”
Place buy limits at recent swing lows (15m/30m) or jump in live with your bullish crew. Use alerts to catch price at key pullback zones.
🛑 SL placed at: 3330 – Just below thief territory. Adjust based on your lot size + number of entries 🔐
🎯 Target: 3460 – Hit and run, or trail that SL and let the gold rain! ☔💸
🧠 Thief Tactics for GOLD:
Only trade Long-side – scalpers, swing traders, all aboard 🚂
Use trailing SL to protect your loot
Avoid trading during high-impact news (CPI, NFP, Fed, etc) ⚠️
Stay alert for manipulations + fake-outs at key levels – it's a trap game out here 🎭
📰 Before the Heist:
🧾 Read Fundamentals • COT Report • Sentiment • Macro Outlook
📌 Always stay updated, news can flip the market faster than a backstab 🗡️
🗣️ Boost this idea if you’re robbing with us!
💥 Smash that LIKE if you believe in the heist
🚨 Follow for more high-voltage thief trades
💎 Daily playbooks. Clean getaways. All signals, no noise.
Join the crew. Trade like a THIEF. Get rich or get smarter.
🕵️♂️💰🚀🔥🐱👤📈

XAUUSD - TAKE A LOOKHere are some guidelines of what could happen. This is purely technical analysis, which may be affected by any news, but it is currently aligning with the ongoing movement.
