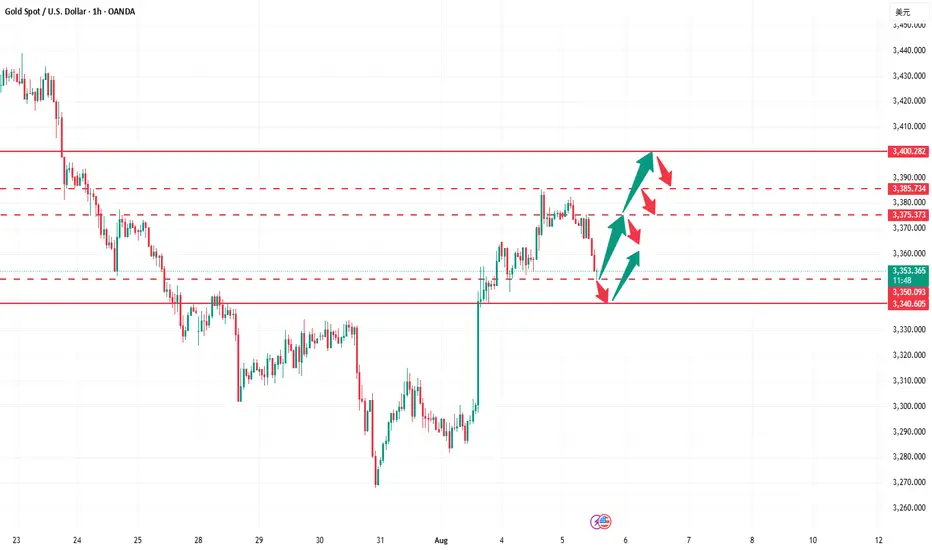
GOLD short term Analysis. - 15 mins. Gold (XAU/USD) – Harmonic Pattern Analysis (15m Chart)
As of: August 5, 2025
🔶 Pattern Observed: Bearish Harmonic (likely Gartley or Butterfly)
Pattern Completion: Near 3385–3390 zone
The price has tested the PRZ (Potential Reversal Zone) and started showing early signs of weakness.
A clear "Short only below here" marker is drawn just below 3370, signaling key support.
🔻 Short Trade Thesis:
If price breaks and sustains below 3370, bearish confirmation is triggered.
This confirms the harmonic pattern's validity and opens the path for impulsive downside targets.
🎯 Downside Targets (if 3370 breaks):
First target: 3310–3320
Second target: 3265–3270
Final target (extended move): 3180–3200
⚠️ Invalidation:
If price breaks above 3395–3400, the harmonic setup is invalidated.
In such case, avoid any short setups and re-analyze price action for new trend direction.
Conclusion:
This harmonic pattern suggests a high-probability short setup below 3370, with clean targets mapped out. However, it's critically important to wait for confirmation (break and retest or strong momentum candle) before entry. If the price starts moving up from current levels without breaching 3370, this setup becomes invalid.
⚠️ Disclaimer:
This analysis is for educational and informational purposes only and should not be considered as financial advice. Trading commodities and financial instruments involves significant risk and may not be suitable for all investors. Please perform your own due diligence or consult with a licensed financial advisor before making any trading decisions. The author is not liable for any losses incurred based on this analysis.
Futures market

XAUUSD 8/4/25 followupPrice closed strongly above Sunday's open so I am just looking for retracements to the upside from here.

GOLD RAID ON – Bullish Limit Orders Are LIVE! XAU/USD💰GOLD HEIST IN PROGRESS! XAU/USD BULLISH RAID BEGINS! 🏴☠️📈
Asset: XAU/USD – Gold vs U.S Dollar
📊 Plan: BULLISH ROBBERY
🎯 Target: 3460.00
🛑 Stop Loss: 3330.00
📥 Entry: ANY level – vault is wide open!
👑 THIEF MODE ACTIVATED – Time to raid GOLD like a pro. We’re stacking multiple limit orders (layering entries) just like setting traps for those greedy bears 🐻💥
🚪💼 Entry strategy:
“The vault is unlocked – grab your bag and go!”
Place buy limits at recent swing lows (15m/30m) or jump in live with your bullish crew. Use alerts to catch price at key pullback zones.
🛑 SL placed at: 3330 – Just below thief territory. Adjust based on your lot size + number of entries 🔐
🎯 Target: 3460 – Hit and run, or trail that SL and let the gold rain! ☔💸
🧠 Thief Tactics for GOLD:
Only trade Long-side – scalpers, swing traders, all aboard 🚂
Use trailing SL to protect your loot
Avoid trading during high-impact news (CPI, NFP, Fed, etc) ⚠️
Stay alert for manipulations + fake-outs at key levels – it's a trap game out here 🎭
📰 Before the Heist:
🧾 Read Fundamentals • COT Report • Sentiment • Macro Outlook
📌 Always stay updated, news can flip the market faster than a backstab 🗡️
🗣️ Boost this idea if you’re robbing with us!
💥 Smash that LIKE if you believe in the heist
🚨 Follow for more high-voltage thief trades
💎 Daily playbooks. Clean getaways. All signals, no noise.
Join the crew. Trade like a THIEF. Get rich or get smarter.
🕵️♂️💰🚀🔥🐱👤📈

XAUUSD - TAKE A LOOKHere are some guidelines of what could happen. This is purely technical analysis, which may be affected by any news, but it is currently aligning with the ongoing movement.

S&P gold oil coffee8 5 25 in this video we're looking for some scalping trades the video gives my perception of where the buyers and sellers are and where the opportunity is for both buyers and sellers

Gold crash (SHORT) - head and shouldersGold is at an interesting crossroad.
It broke through its diagonal support on Friday the 25th of July.
Price is retesting previous support. Does it turn into resistance?
Further confluence is a head and shoulders of the H8 and H12, with the right shoulder coinciding with the retest of the diagonal.
Since I am long gold with my investments, I am hesitant to short gold through my trading business. However, if my pattern is available, I take the trade. This will be a very short term trade - a few days at most if the trade goes in my favour.
Risk/reward = 12.6
Entry price = 3382.5
Stop loss price = 3396.2
Take profit level 1 (50%) = 3230
Take profit level 2 (50%) = 3181
The risk reward is exceptionally high. However, I have taken a more conservative approach with my entry because of my apprehension to short gold. For this trade I will enter at the extreme end of the range in which I will look for entries. This is the reason for such a high RR. It might result in me missing an entry.
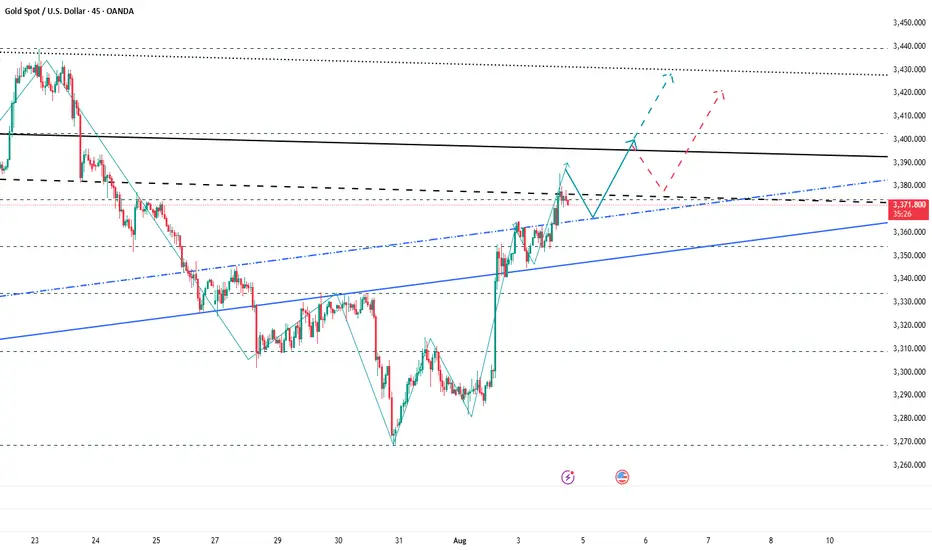
Bullish Continuation (Wave 5 Play)Aggressive Entry(1): Enter on current breakout attempt above 3385–3390 (key resistance zone).
Conservative Entry(2): Wait for a confirmed breakout and 1H candle close above 3390, then buy on retest of broken resistance as support.
Potential run up to 3420–3430 (Wave 5 complete zone).

Next Stop 3420? Gold Bulls Push the LimitBecause the U.S. non-farm payroll report performed worse than expected, gold rebounded strongly last Friday and recovered half of its losses in one fell swoop. The bulls returned strongly. Today, after consolidating at a high level, gold continued to choose to break upward, reaching a high of around 3385.
There is no doubt that bullish forces still hold the upper hand. From a fundamental perspective, the Federal Reserve is currently facing greater pressure to cut interest rates; and it can also be clearly seen from the candlestick chart that a significant "W"-shaped double bottom structure has been constructed near 3268 and 3280, which has limited the gold's retracement space while also playing a key structural support role in the rise of gold. With the combined effects of news and technical factors, gold still has the potential to continue its upward trend. And I think there is still a great possibility that gold will test the 3400 mark again. Once gold stabilizes at 3400, it will definitely hit the 3420-3430 area.
As the center of gravity of gold gradually shifts upward, the lower support area also moves up. The current short-term support is obviously in the 3365-3355 area, while the relatively strong support is in the 3345-3335 area. According to the current pattern structure, the bulls may not allow gold to retreat to the 3345-3335 area. So in terms of short-term trading, we first consider the opportunity to enter long positions in the 3365-3355 area!
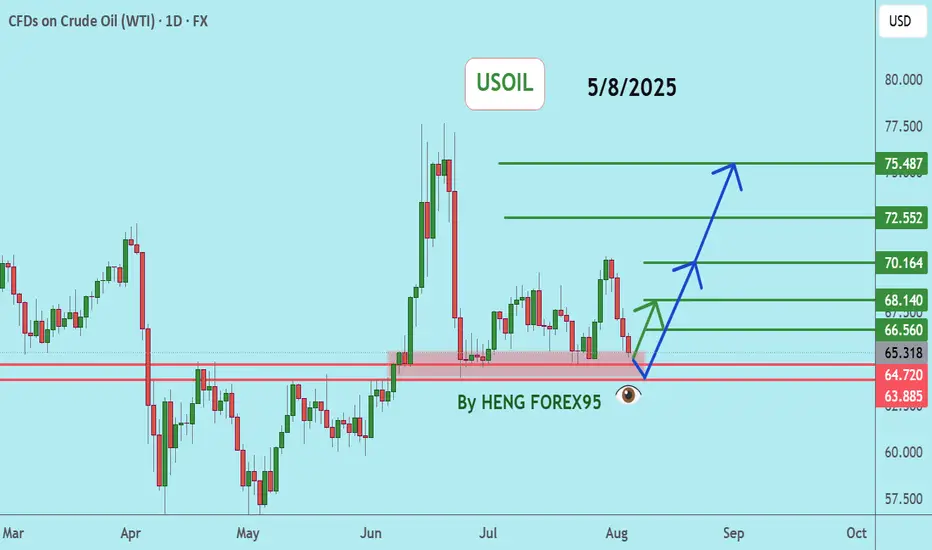
USOILUSOIL price is now testing the support zone of 64.72-63.88. If the price cannot break through the 63.88 level, it is expected that the price will rebound. Consider buying in the red zone.
🔥Trading futures, forex, CFDs and stocks carries a risk of loss.
Please consider carefully whether such trading is suitable for you.
>>GooD Luck 😊
❤️ Like and subscribe to never miss a new idea!
We remain bullish on gold prices today—3400+.We remain bullish on gold prices today—3400+.
As shown in Figure 4h, gold prices are actively breaking through.
Currently, the upper resistance level for gold is 3385-3390.
Going long at low prices is a good strategy.
We exited yesterday at 3380 and entered today around 3350-3360, achieving very stable profits.
Current support level for gold: 3350-3360.
Gold prices have now resumed their upward trend, indicating that bullish sentiment has returned to the primary upward trend.
Bullish sentiment will continue to strengthen.
Our target price for gold remains above 3400.
Day Trading Strategy:
1: Swing Strategy: 3350-3385 (Buy Low, Sell High)
2: Low-Price Long Strategy
Buy: 3350-3360-3370
Stop Loss: 3345
Target: 3380-3400
3: High-Price Short Strategy: (Caution is advised when trading short positions; avoid short positions)

Crude Oil Resumes Its WeaknessCrude oil rised and then fell sharply from above 78 dollars back in June, after tensions in the Middle East. The drop unfolded as an impulse into wave A, so even if this is just a counter-trend move down from 78, it still appears incomplete. After we recently spotted a corrective rally in wave B that nicely stopped at projected $70 resistance near 61,8% Fibo. retracement, we can now see it resuming lower within projected wave C towards 60-59 area at least, if not even lower.

Wait for a pullback and then test the previous high#XAUUSD
The gold market closed positively on the daily chart, with strong support near 3345-3340 below. The market trend is still dominated by bulls,🐂 but the daily moving average support is too far from the high point. It is not ruled out that it may retreat to the moving average support near 3345-3340,📊 and then rise again.🚀
From the monthly chart, 🌙although the monthly chart closed positive, the market is generally converging at a high level. Upper resistance remains, and a breakout is unlikely without breaking through this resistance level (no further discussion will be given).📉
Judging from the weekly chart, the Bollinger Bands have shrunk, and the MACD indicator has formed a death cross with large volume, indicating weak fluctuations at the weekly level.😩
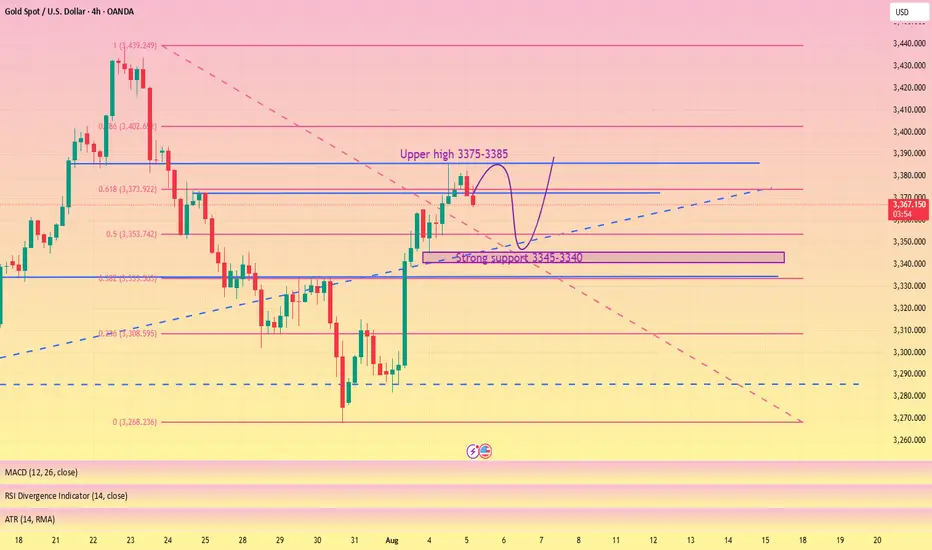
Judging from the daily chart, 📊the current technical indicators are tending to the zero axis, and the rapid upward correction of the smart indicator indicates that the price fluctuation tends to rebound. The current focus is on yesterday's high around 3385. It is expected to break through 3430. The lower support Bollinger band middle track and moving average tend to stick together around 3346-3340.🌈
Judging from the hourly chart and 4H chart, 📊the overall rhythm tends to fluctuate and fall. The short-term pressure from above is around 3375-3385, and a break above will definitely lead to an increase.📈
On the whole, pay attention to yesterday's NY starting point near 3365-3360, and the strong support below is 3346-3340. The hourly and 4H charts tend to fluctuate and fall, so for short-term trading we need to short on rallies. 📉
Intraday trading suggestions are as follows:
1. Consider going long currently around 3365-3360📈, targeting 3374-3380🎯. If it breaks through, look for 3400.
2. Go long if it retraces below 3355-3340, targeting 3375-3385. Wait for further adjustments.🐂
3. If the price first reaches the resistance level of 3375-3385 and holds, consider going short with a small position and anticipate a pullback towards 3365-3355.🐻
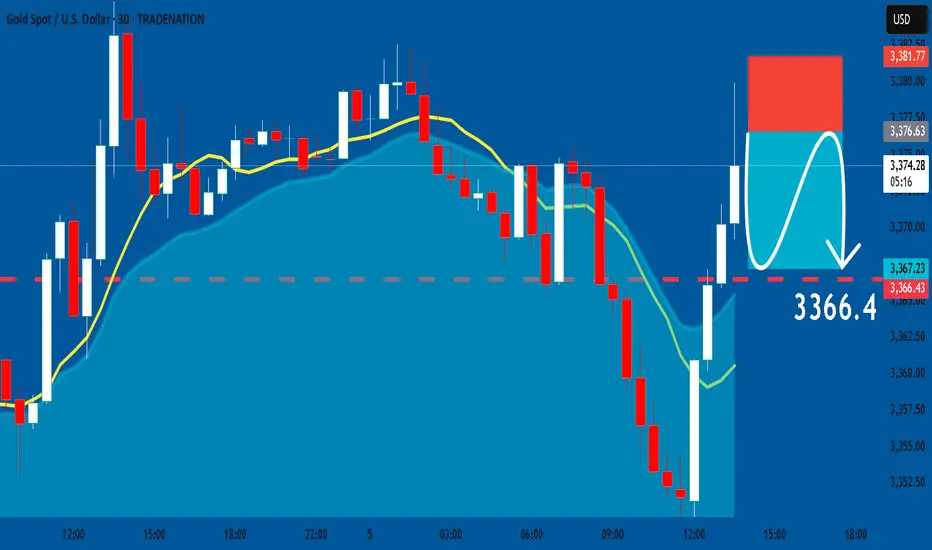
GOLD: Short Signal with Entry/SL/TP
GOLD
- Classic bearish setup
- Our team expects bearish continuation
SUGGESTED TRADE:
Swing Trade
Short GOLD
Entry Point - 3376.5
Stop Loss - 3381.7
Take Profit - 3366.4
Our Risk - 1%
Start protection of your profits from lower levels
Disclosure: I am part of Trade Nation's Influencer program and receive a monthly fee for using their TradingView charts in my analysis.
❤️ Please, support our work with like & comment! ❤️
XAU/USD – Bearish Momentum Building: Circle 2 Top In?OANDA:XAUUSD
We have now completed a 1-2-3-4-5 structure to the downside (in white).
Following that, we got a counter-correction in the form of an A-B-C, which potentially marks the completion of our yellow (Circle) Wave 2 🟡.
However, it’s not confirmed just yet — we still have two additional Fibonacci levels at 3400 and 3418, which could act as resistance zones and final topping areas for Circle 2.
We are now anticipating a 1-2-3-4-5 impulse into Circle 3, as already illustrated in yellow 🟡.
So at the moment, bias remains bearish 🔻.
Should we break above the Fibonacci levels mentioned, I do have an alternative scenario in mind — an ABCDE triangle formation that may have developed over the past months.
If that becomes relevant, I’ll make a separate upload for it 📌.
For now, I'm actively looking for sell positions, and I’ve already entered shorts ✅.

In gold trading, timing is key!Gold has currently reached a high of around 3385. The technical retracement and correction is also an affirmation of the bulls, and the current support below will continue to move up. From the perspective of the large range of the daily line, there is no large unilateral trend, and the overall box consolidation pattern has been formed. It once rose to 3385 yesterday, but failed to stand firm, indicating that the pressure from above is still quite large. If it can break through 3400, the next target may be 3430; otherwise, it may start a round of deep adjustment. There is a need for technical adjustment, so it is not advisable to chase the rise too much. If your current operation is not ideal, I hope I can help you avoid detours in your investment. Welcome to communicate with us!
Judging from the structure of the 4-hour gold chart, the key support area below is around 3350-3340. If it falls back to this area and stabilizes during the day, you can continue to rely on this area to arrange long orders. The overall bullish thinking remains unchanged. The short-term resistance above is around 3375-3385. If it breaks through, it will further test the key suppression zone of 3390-3400. I will prompt the specific operation strategy at the bottom. I suggest you keep paying attention and follow up in time.
Gold operation strategy: Go long when gold falls back to around 3350-3340, with the target at 3370-3380.
Gold in short term selling momentum 2.5 RR !After breaking HL with FVG, all we need to do is touch the OB, and we will see the drawdown immediately.
Entry 3370
SL 3390
Take profit1 3340
Take profit2 3330
Take profit3 3320
#Make your research.
#on your responsibility


XAUUSD Gold move 5 Aug 2025Price is currently reacting off a key 15-minute demand zone between 3352 and 3355, which has previously acted as a strong support level. Bullish rejection wicks within this area suggest buying interest and a possible short-term reversal.
The bias is bullish for a retracement move. A potential long opportunity exists from the 3352–3355 support zone, targeting the 3370 area, which aligns with a previous 15-minute supply zone and breakdown origin.
This setup is based on the expectation of a retracement toward 3370 before any further downside continuation. A clean break and close below 3352 would invalidate the idea and suggest continuation lower.
Confirmation through bullish price action within the zone is advised before execution.

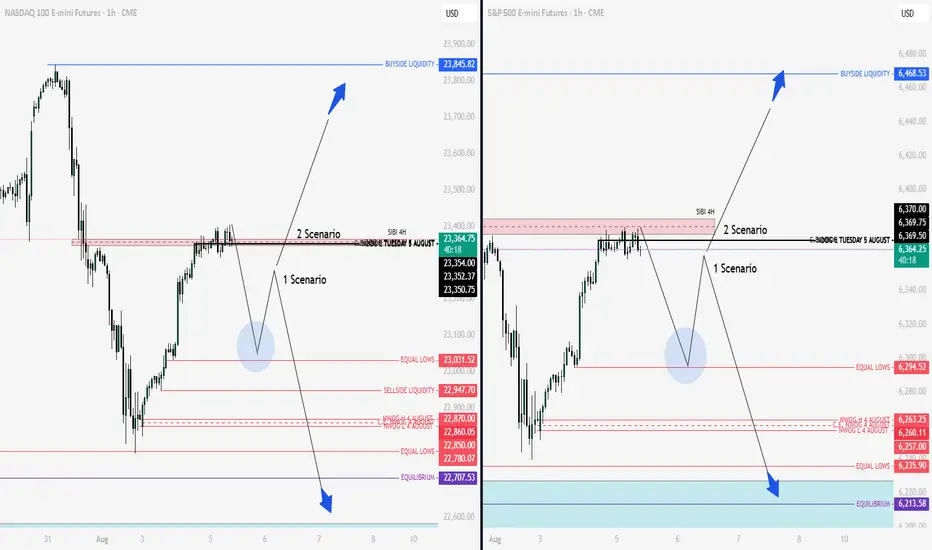
Nq & Es Key Levels and Scenarios 05-08-2025 We are currently positioned in a premium zone. This suggests that the price is likely to seek lower levels within discount areas. Therefore, upon the market opening, it will be crucial to observe price action in light of the increased volatility expected to enter the market.
The prevailing bias is that prices are likely to decline toward the predefined zones indicated on the chart. Depending on how price reacts at these key levels, we will be able to assess whether the downward movement will continue or if significant support will emerge, potentially leading to a full reversal to the upside.
In summary, there may be initial shorting opportunities, followed by potential long setups depending on the market’s reaction. Two scenarios have been outlined.
Wishing you all successful and well-considered trades.
XAU / USD 30 Minute Chart Quick Scalp SellHello traders. As per my previous post, gold moved through my area of interest and I took a small micro lot position. Sold from the red line, closed 75% of the trade's profit at the next red line. My remaining 25% of the trade is the runner, and I will let that run for a bit. My Stop loss is at my entry point, so zero loss, profit secured and I am thankful to BIg G. Let's see what the NY open does in a few hours. Be well and trade the trend. More analysis to come.

XAUUSD Critical movement !!!The 3351 4h frame was so critical as I said and showed the movement will make the decision.
Flying now with
tp : 3385
tp:3400
tp : 3413
Better wait for another confirmation on the breaker block 3370 closing above it with green candle . push the price higher as showed

/MES S&P Futures (ChopDay)Good morning guys here we have a 4hr ES Futures chart that I created clearly showing you a Yellow dotted bounding box which shows what I call a No Trade Zone / Institutional Liquidity Grab. In simple terms " Dont Trade / sit on your hands "
It seems that we are consolidating and awaiting for market direction either Up or Down, my educated guess is that we may have a little pump but higher probability to the downside based on my studies. You will see wicks above and below the bodies of the 4hr candles, that to me tells a story, what is the story? A day where the market will chop around most likely and take your money it is Bulls too scared to move higher and Bears scared to pull the trigger to the downside thinking they will get trapped but in my eyes the market is overbought and exhausted, it needs a break. Does it mean that it will drop, absolutely NOT, the market can in fact continue to push higher if it wants but in my opinion, it seems that down should be the way at least for the next few weeks or months.

My Trading Journal on XAUUSD 05.08.2025Today, I’m trading GOLD and looking for a potential buy setup. Key factors include the ISM Services PMI news event and Trump’s speech, scheduled between 15:00 and 17:00.
We’ll see how price reacts during the New York session.
