Weekly review of Overall Market
Commodities:
Gold has been running a good uptrend for a while, now looking it is going to break out again after this consolidation.
US Stocks:
SNDK and XMTR looking really nice as it consolidates, top and bottom of orange bar are the entry and stop loss respsectively.
Have a nice Christmas!
Futures market

XAUUSD H4 – Medium-Term Outlook for the Coming Week
Gold remains within a broad rising channel, but recent price action shows clear rejection at the upper trendline. For the week ahead, the focus is on a potential technical pullback, while keeping an alternative bullish scenario if the market fully accepts higher prices.
PRIORITY SCENARIO – MAIN SCENARIO
Wait for structural confirmation to sell the medium-term corrective move
Key confirmation level: a break of the trendline around 4317
Trade idea: look for confirmation below 4317 to sell the corrective leg within the rising channel
Technical context: price is trading near the upper boundary of the channel and showing rejection, a common setup before a rotation back toward lower value areas
Position management:
Sell positions should be treated strictly as corrective trades within a broader uptrend.
If price fails to stay below 4317 and regains bullish structure, risk should be reduced and short positions avoided.
ALTERNATIVE SCENARIO – SECONDARY SCENARIO
Trend continuation if price breaks to new highs and finds acceptance
Trigger condition: a clean breakout to new highs with sustained bullish momentum
Trade idea: prioritise buy setups once the market clearly accepts higher prices
Technical context: successful breakouts often lead to range expansion, making short positions unfavourable
KEY MEDIUM-TERM BUY ZONE
Liquidity-based opportunity in the event of a deeper pullback
Reference buy zone: around 4220
Rationale: this area represents a major liquidity cluster and a logical zone to monitor for bullish reactions during a deeper year-end pullback
KEY TECHNICAL REASONS
The dominant H4 trend remains bullish, but rejection at the upper channel increases the probability of a technical correction
The 4317 level acts as a key decision point to distinguish between a genuine pullback and temporary consolidation
The 4220 area serves as a value zone aligned with liquidity for potential trend-following buys
MACRO AND NEWS CONTEXT
Recent comments have reinforced expectations of future rate cuts to address labour market risks, which remains supportive for gold in the broader context.
Geopolitical developments, including discussions around the next steps in the Gaza peace process, continue to underpin safe-haven demand.
However, year-end holiday conditions often result in thinner liquidity, wider spreads, and less reliable price moves, making discipline and risk control essential.
RISK MANAGEMENT AND WEEKLY PLAN
Avoid chasing long positions near the upper trendline of the rising channel.
Only consider short positions after clear confirmation below 4317, avoiding emotional top-picking in a bullish market.
If price breaks and holds above recent highs, shift focus back to trend-following buy setups.
Reduce position size during the holiday week and prioritise trades around well-defined key levels rather than extended moves.

XAUUSD SELLSAnother day , another Setup .Price reacted from market Structure and high and I expected sells from 4348 zone. Price is at a POINT OF INTEREST ZONE. Confirmation on m3 time frame during londos session . Will be holding this trade through the weekend . #volumebasedtrade

Oil 4H chart The Executive Summary
Oil has suffered a catastrophic failure of market structure. The price has lost the massive institutional value shelf at $60.07, turning that former support into a "concrete ceiling." We are now in price discovery mode to the downside, hunting for a bid at the statistical extreme (-2σ).
The Institutional Data
• Current Price: $56.55
• The "Ceiling" (POC): $60.07
• Note: The yellow volume profile shows huge institutional acceptance here. Now that we are below it, this is major supply.
• Trend Filter (AVWAP): $59.67
• Status: Bearish. Price is trading -5.27% below the institutional average.
• Volatility Bands (Statistical Extremes):
• Immediate Resistance (-1σ): $57.81
• Downside Magnet (-2σ): $55.94
• Capitulation Target (-3σ): $54.08
The Narrative: "The Liquidity Vacuum"
Look at the Volume Profile (left side). The massive yellow block represents where all the trading happened over the last month. Everyone who bought oil between $58.00 and $62.00 is now trapped underwater.
When price drops below a "High Volume Node" into a "Low Volume Node" (where we are now), moves tend to be fast and volatile because there is no structural support to stop the fall. The market is effectively flushing until it hits a statistical limit.
The Trade Plan
• 🐻 Bearish Continuation (Primary):
• The trend is firmly down. Any rally toward $57.81 (-1σ) is likely a selling opportunity for algorithms defending the trend.
• Target: We are magnetizing toward the $55.94 (-2σ Band). Watch for a reaction there.
• 🐂 Bullish Reversal (Invalidation):
• Buying here is "catching a falling knife."
• Bulls must reclaim the -1σ Band ($57.81) to stabilize the bleeding. Until then, the $60.00 POC acts as a gravitational force preventing any sustained rally.
Verdict: The floor has broken. Expect a test of $55.90 before any meaningful bounce.

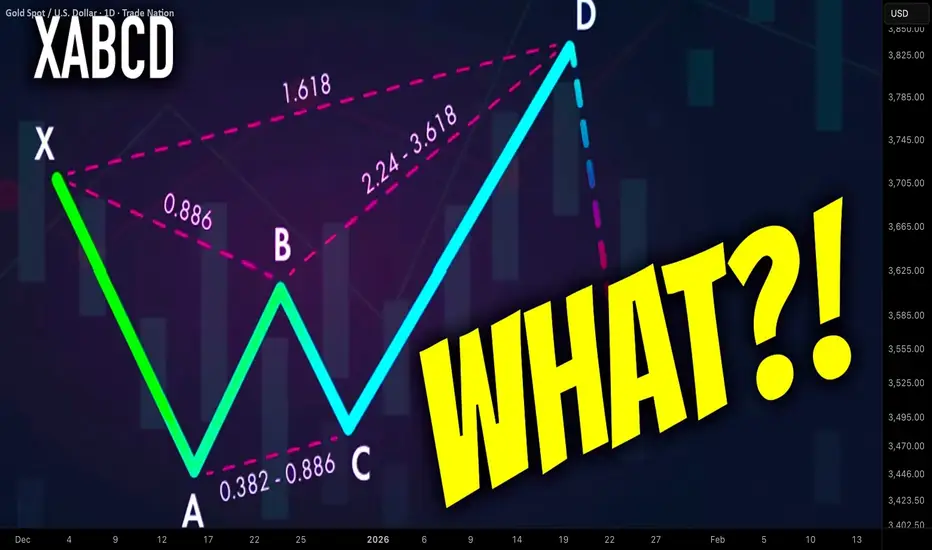
What is Harmonic XABCD Pattern and How to Identify It Easily
In the today's article, we will discuss the absolute basics of harmonic trading: I will explain to you what is harmonic ABCD pattern and how to recognize it, using fibonacci ratios.
The foundation of harmonic trading is impulse leg.
Impulse leg is a strong, directional bullish or bearish movement.
Harmonic traders perceive a price chart like a combination of impulse legs.
Here are the impulse legs on AUDUSD on a daily time frame. All these impulses are significant bullish or bearish movements.
In harmonic pattern trading, the impulse leg will also be called the XA leg.
XABCD pattern is based on 4 consequent price movements.
XA leg will be a fundamental component of each harmonic XABCD pattern and the first price movement within the pattern.
The direction of the XA leg will determine the bias of the pattern:
Bullish XA will be a foundation of a bullish harmonic pattern,
while, a bearish XA leg will be a foundation for a bearish harmonic pattern.
Above, the examples of a bullish and bearish impulse legs.
After identification of XA leg, a harmonic trader should analyse a consequent price action.
AB leg will be the next movement after a completion of XA leg.
BC leg will be the movement after a completion of AB leg.
CD leg will be the movement after a completion of BC leg.
CD leg will be a completion point of a harmonic pattern.
In a bullish harmonic pattern, a bullish movement will be anticipated from D point.
Above is a structure of a bearish harmonic XABCD pattern.
There are a lot of different types of harmonic XABCD patterns: bullish/bearish Gartley, Bat, Cypher, etc...
The type of the pattern will depend on the fibonacci ratios of B, C, D points of the pattern.
B, C, D points should have very specific ratios to make a pattern harmonic.
First, a harmonic trader should measure the fibonacci retracement level of B point in XA leg.
In the example below, B point is lying between 618 and 786 retracements of XA leg.
Then, if a C point is lying beyond the range of the XA impulse, one should measure its fibonacci extension level.
If a C is lying within XA, its retracement level should be measured.
Below, we can see that C point of the pattern is lying between 618 and 786 retracements of AB.
Depending on the type of the pattern, a D point will either be based on a certain fibonacci retracement of XA leg or extension of AB leg.
In our example, the criteria for a bullish harmonic Gartley pattern are met.
The completion point of the pattern - D point will be based on 786 retracement of XA leg.
From that retracement level, a bullish movement will be anticipated.
Your task as a harmonic trader is to learn the specific rations of each harmonic pattern. With experience, you will learn to identify impulse legs and trade them profitable.
❤️Please, support my work with like, thank you!❤️
I am part of Trade Nation's Influencer program and receive a monthly fee for using their TradingView charts in my analysis.
XAUUSD Update GOLD Supercycle's timelineI present data on gold price movements within a supercycle using monthly time frames.
An interesting aspect is the time cycles at which the major trend is moving.
God bless !

Gold (4H) — Supply is holding… for nowContext
On the left of the chart, Gold reached the higher-timeframe C target .
That was a valid place for sellers to take control — and they didn’t.
Price absorbed selling pressure and kept moving.
Now we’re at a different level.
The red zone is the all-time-high supply.
Sellers are active here. Price is being held.
That part matters and shouldn’t be ignored.
What formed under supply
Instead of a dump, price built structure:
A clear base
Liquidity sweep
MSS
A fresh ABC sequence
B held.
B broke A.
That tells me buyers are still participating, even with supply overhead.
Expectation
I’m not expecting an immediate breakout.
What makes sense here is a pullback first.
A revisit into the continuation breaker , clearing inducement and resetting positioning.
If that zone holds and price flips back up, then a break of supply opens the path toward C .
If the structure fails, I step aside.
No forcing it.
Watching how price behaves — not guessing the outcome.
SmellyTaz — decoding chaos.
Not financial advice. Shared for educational purposes only.

XAUUSD (D1) – Weekly OutlookXAUUSD (D1) – Weekly Outlook: Lana focuses on buying discounted zones, preparing for a possible ABC correction 💛
Quick summary
Higher timeframe (Daily): The main uptrend remains intact and structurally strong
Elliott Wave: Gold likely completed Wave 5, with a potential ABC corrective phase ahead to complete the cycle
Liquidity: Christmas week and year-end positioning may cause thin liquidity and irregular price movements
Plan: No chasing. Lana waits for price to reach key buy zones at 4250 and 4205
Market context for next week
Next week’s trading activity may slow down due to the Christmas holiday and preparations for the year-end. Thinner liquidity often leads to sharp, irregular moves and liquidity sweeps.
At the same time, ongoing geopolitical tensions continue to support gold, while USD weakness adds further tailwinds.
Because of this, Lana prefers a zone-based approach rather than trying to predict exact tops or bottoms.
Technical view on D1
On the Daily chart, gold still shows a solid bullish foundation. However, from an Elliott Wave perspective, price appears to be finishing the final impulsive wave (Wave 5).
After a Wave 5 completion, a corrective ABC structure is common, allowing the market to rebalance before the next major move.
For Lana, a correction is not bearish—it’s an opportunity to look for higher-probability buys at discounted levels instead of chasing price at elevated zones.
Key levels Lana is watching
1) Primary buy zone: 4250
This level previously acted as a strong resistance and was decisively broken. Liquidity remains concentrated in this area, making it a favorable zone to look for buying opportunities if price pulls back.
2) Long-term buy zone: 4205 (POC from Volume Profile)
This is a major Point of Control where price previously accumulated heavily. If the ABC correction extends deeper, this zone becomes a key area for longer-term positioning.
Trading plan for next week (overview)
Early in the week, Lana will observe lower timeframes to confirm entries.
Priority is given to pullbacks toward 4250; deeper corrections may offer opportunities near 4205.
With thin holiday liquidity, Lana plans to:
reduce position size
keep stop losses clearly defined
scale out profits once price reacts from the zones
Lana’s note 🌿
Holiday weeks often bring fewer clean setups but more unexpected liquidity grabs. Lana will stay patient, trade selectively, and focus only on price levels that truly make sense.
This is Lana’s personal market view, not financial advice

XAU Near All-Time Highs Bullish Continuation or Fake Breakout?Hello and respect to all TradingView followers 🙌
Hope you’re having profitable trades and disciplined risk management 📊💚
🟡 Gold Market Overview (XAUUSD)
Gold has always been considered a safe-haven asset, especially during periods of economic uncertainty, inflationary pressure, and geopolitical tensions.
Recently, gold has maintained a strong bullish structure across all timeframes, attracting both long-term investors and short-term traders 📈
At the moment, price is very close to its All-Time High (ATH). However, a new historical high has not been confirmed yet, making this zone extremely critical and decision-making for the market ⚠️
📊 Technical Analysis
🔼 Bullish Scenario
Overall market structure remains bullish on all timeframes
Price is holding above dynamic support (ascending trendline)
If price breaks and firmly closes above the ATH resistance, we can expect:
Continuation of the bullish trend
Formation of new All-Time Highs
Entry into price discovery mode 🚀
📌 Key confirmation: strong candle close above resistance + sustained momentum
🔽 Bearish (Corrective) Scenario
Despite the bullish trend, momentum weakness is visible near the ATH zone
If price fails to break the resistance and we see:
Rejection from resistance
Or a fake breakout
then a healthy correction becomes likely
Potential downside targets:
Nearest static support zones
And in a deeper pullback, the dynamic support (ascending trendline)
🔹 Such a move would be considered a normal correction within a larger bullish trend, not a trend reversal 🔄
🧠 Summary
Overall trend: Bullish
Current price location: Near All-Time High
Market condition: Sensitive zone + momentum weakness
Trading approach: Wait for confirmation — breakout or rejection
⚠️ Disclaimer
This analysis is for educational purposes only and not financial advice.
Always manage your risk properly and follow your own trading plan 💼📉
📣 Poll Question
❓ Do you think gold will successfully print new All-Time Highs?
🔘 Yes, after a confirmed breakout
🔘 No, a deeper correction comes first
Share your thoughts in the comments 👇👇
🏷️ Tags
#Gold #XAUUSD #TechnicalAnalysis #PriceAction
#SupportResistance #ATH #TradingView
#Forex #Commodities #SmartMoney
#BullishTrend #MarketStructure #TradingPsychology 💹
XAUUSD Near All-Time Highs Bullish Continuation or Fake Breakout?

267 handle move bullish - NQ
Lower 1D Shadow quadrant exactly respected, which is a strong bullish sign according to ICT
1D Breaker MT (midpoint or mean-threshold) exactly respected with the candle bodies, which is also a strong bullish sign according to ICT
The event horizon - which is the midpoint of 2 new-day- or new-week-opening-gaps align exactly with the 1D volume imbalance CE (consequent encroachment or midpoint)
Strong bullish market-structure and the movement aligns with seasonal tendencies as well

GOLD Is Going Down! Sell!
Here is our detailed technical review for GOLD.
Time Frame: 1D
Current Trend: Bearish
Sentiment: Overbought (based on 7-period RSI)
Forecast: Bearish
The market is trading around a solid horizontal structure 4,340.66.
The above observations make me that the market will inevitably achieve 4,164.19 level.
P.S
We determine oversold/overbought condition with RSI indicator.
When it drops below 30 - the market is considered to be oversold.
When it bounces above 70 - the market is considered to be overbought.
Like and subscribe and comment my ideas if you enjoy them!

XAUUSD Update Gold is looking for a new ATHAfter following last week's movement, gold continued its upward movement and currently 4300 is a support zone.
It still respected the trendline zone also.
Will gold succeed in achieving a new all-time high next week?
Big possibility ... Yesss
Beware when you jump into the market, wait for a minor pullback.
Have a blessing week ahead !

USOIL SELLERS WILL DOMINATE THE MARKET|SHORT
USOIL SIGNAL
Trade Direction: short
Entry Level: 56.54
Target Level: 55.07
Stop Loss: 57.51
RISK PROFILE
Risk level: medium
Suggested risk: 1%
Timeframe: 4h
Disclosure: I am part of Trade Nation's Influencer program and receive a monthly fee for using their TradingView charts in my analysis.
✅LIKE AND COMMENT MY IDEAS✅

SILVER XAGUSD TO THE MOON.WHAT IS SILVER XAGUSD.
Silver (Ag) is a soft, white, lustrous transition metal prized for its high electrical and thermal conductivity.
Silver functions as a precious metal investment and hedge against inflation in finance
Periodic Table Position
It occupies atomic number 47, in Group 11 (coinage metals) and Period 5 of the d-block, with electron configuration 4d¹⁰ 5s¹. Silver exhibits oxidation states of +1 (most common), +2, and +3, and has a face-centered cubic crystal structure with density of 10.5 g/cm³.
Medical Applications
Silver ions provide broad-spectrum antimicrobial action, used in wound dressings, creams for burns, and catheters to prevent infections. Colloidal silver treats skin conditions, while nanoparticles enhance antibiotic efficacy against resistant bacteria.
Industrial Uses
Silver conducts electricity better than copper, enabling its use in solar panels, electronics contacts, and batteries. It also appears in mirrors, photography (historically), jewelry, and water purification filters due to catalytic properties
Historical Uses
During World War II, the U.S. Manhattan Project borrowed over 430 million ounces of silver from Treasury reserves to build electromagnetic calutrons and cyclotrons for uranium enrichment, forming massive coils in particle accelerators essential for atomic bomb development. Silver also powered radar magnetrons, torpedoes, and guidance systems in aircraft and naval equipment.
Modern Applications
Today, silver features in missile guidance systems, satellite power components, electrical connectors, switches, and wiring for high-reliability electronics in fighter jets and defense tech. Its antimicrobial qualities appear in medical bandages and equipment for field hospitals, while coatings prevent bacterial growth on surfaces. Demand remains significant but often classified, potentially exceeding public industrial figures.
SILVER TO THE MOON.
#SILVER #XAGUSD
GOODLUCK

Gold nouvelle impulsiontendance haussiere H4 , correction effectuée apres l'impulsion , potentiel nouvelle impulsion en cours

Master Correlation StrategiesTurning Market Relationships into Consistent Trading Edges
Correlation strategies are among the most powerful yet misunderstood tools in trading and investing. While many market participants focus only on price direction, correlation-based traders focus on relationships—how assets move relative to one another. When mastered, correlation strategies help traders reduce risk, improve timing, identify hidden opportunities, and trade with greater confidence across equities, commodities, currencies, bonds, and indices.
This guide explores the concept of correlation, its types, practical applications, advanced strategies, common mistakes, and how professional traders use correlation to gain a sustainable edge.
Understanding Correlation in Financial Markets
Correlation measures the degree to which two assets move in relation to each other. It ranges from +1 to -1:
Positive correlation (+1 to +0.5): Assets move in the same direction
Negative correlation (-1 to -0.5): Assets move in opposite directions
Zero or low correlation: No consistent relationship
For example:
Crude oil and energy stocks often show positive correlation
Gold and the US dollar often show negative correlation
Equity indices within the same country tend to be highly correlated
Correlation is not static. It changes over time due to economic cycles, liquidity conditions, policy decisions, and market sentiment. Master traders continuously monitor and adapt to these shifts.
Why Correlation Strategies Matter
Most traders lose money not because they are wrong on direction, but because they unknowingly take overlapping risk. Buying multiple highly correlated assets is essentially placing the same trade multiple times.
Correlation strategies help in:
Avoiding hidden overexposure
Improving portfolio diversification
Identifying early signals before price moves
Trading relative value instead of pure direction
Managing drawdowns during volatile markets
Professional traders think in terms of risk clusters, not individual trades—and correlation is the foundation of this thinking.
Types of Correlation Strategies
1. Intermarket Correlation Strategy
This strategy studies relationships between different asset classes such as equities, commodities, bonds, and currencies.
Examples:
Rising bond yields often pressure equity valuations
Strong US dollar impacts gold, crude oil, and emerging markets
Equity market weakness can drive capital into bonds or gold
By tracking one market, traders anticipate moves in another before they occur.
2. Pair Trading and Relative Strength Strategy
Pair trading involves taking long and short positions in two correlated assets, betting on the spread between them rather than market direction.
Example:
Long Stock A, Short Stock B when historical correlation breaks temporarily
Long outperformer, short underperformer within the same sector
This strategy works well in sideways or volatile markets and reduces market risk.
3. Sector Correlation Strategy
Stocks within the same sector often move together due to shared fundamentals.
Examples:
Banking stocks correlated with interest rate expectations
IT stocks correlated with currency movements
Metal stocks correlated with global commodity prices
Traders use sector correlation to confirm breakouts or detect false moves.
4. Index-to-Stock Correlation Strategy
Large-cap stocks heavily influence indices. When an index moves without participation from key stocks, the move may lack strength.
Examples:
NIFTY rising while major banking stocks lag
Index breaking resistance but heavyweight stocks failing
This divergence often signals upcoming reversals or consolidation.
5. Lead–Lag Correlation Strategy
Some assets move before others, acting as early indicators.
Examples:
Dow Jones leading global equity sentiment
US bond yields leading equity rotations
Copper leading economic growth expectations
Identifying leaders allows traders to position early with better risk-reward.
Correlation in Risk Management
Correlation is a risk control tool, not just a trade setup.
Key applications:
Avoid taking multiple trades with the same directional exposure
Balance portfolios with negatively correlated assets
Reduce drawdowns during market crashes
Allocate capital more efficiently
A portfolio with five uncorrelated trades is safer than ten correlated trades.
Correlation vs Causation: A Critical Distinction
One of the biggest mistakes traders make is assuming correlation means causation. Just because two assets move together does not mean one causes the other to move.
Correlation strategies must be combined with:
Fundamental context
Macro environment
Liquidity conditions
Technical confirmation
Without context, correlation signals can become misleading.
Advanced Correlation Techniques Used by Professionals
Rolling Correlation
Instead of static correlation, professionals use rolling correlation to track how relationships evolve over time.
Benefits:
Detects breakdowns early
Adapts to changing market regimes
Avoids outdated assumptions
Regime-Based Correlation
Correlations behave differently in:
Risk-on markets
Risk-off markets
Inflationary cycles
Recessionary phases
For example, during market crashes, correlations often increase as everything sells off together.
Volatility-Adjusted Correlation
During high volatility, correlations spike artificially. Adjusting for volatility prevents false signals and improves decision-making.
Common Mistakes in Correlation Trading
Treating correlation as permanent
Ignoring macro and policy shifts
Over-leveraging correlated positions
Using correlation alone without price action
Not updating correlation data regularly
Correlation strategies reward discipline and continuous observation.
How to Build a Master Correlation Trading Framework
Identify core assets you trade
Track historical and rolling correlations
Understand macro drivers behind relationships
Use correlation as confirmation, not prediction
Control position sizing across correlated trades
Reassess correlations during major events
Mastery comes from repetition, review, and adaptability.
Psychological Edge of Correlation Strategies
Correlation trading reduces emotional decision-making. Instead of reacting to noise, traders rely on structure and relationships.
Benefits include:
Increased confidence during volatility
Fewer impulsive trades
Better patience and discipline
Clearer risk assessment
Professional traders don’t chase moves—they wait for correlation alignment.
Conclusion: Correlation as a Market Language
Markets speak through relationships. Price is only one word in the sentence—correlation completes the meaning. Traders who master correlation strategies stop guessing and start interpreting the market.
By understanding how assets interact, lead, lag, diverge, and converge, correlation traders operate one step ahead of the crowd. In an era of global interconnected markets, correlation mastery is no longer optional—it is essential for long-term trading success.

COPPER BULL RODEO OVER THE NEXT FIVE YEARSIf Copper remains mostly above $4.75/lb throughout the next few waves of market volatility, I see a high potential for moderate to intense growth in the copper price point. $6-20 range.
DYOR
Trade Slick

After retouching life time high, gold is retracing.After retouching life time high, gold is retracing. It may consolidate at this level.

After the Win: When Ego Takes OverAfter the Win: When Ego Takes Over
“Losses hurt the account.
Wins test the mind.”
A good trade works.
The plan was followed.
The market respected your level.
And then something subtle happens.
Confidence rises.
Rules soften.
The next trade feels easier to take.
That’s not growth.
That’s ego quietly stepping in.
Why Wins Are Dangerous
A win rewards behavior — but it also rewards emotion.
The brain links profit with personal ability.
You start trusting yourself more than your process.
Thoughts begin to shift:
• “I’m in sync with the market.”
• “I can see it clearly now.”
• “This one will work too.”
This is how discipline slowly erodes.
Confidence vs Ego
Confidence is calm.
Ego is loud.
Confidence respects rules.
Ego bends them.
Confidence accepts uncertainty.
Ego assumes control.
The moment a trader feels “special,”
the market prepares a lesson.
The Common Pattern
Many traders lose money not after losses,
but after a strong winning trade.
Why?
• Position size increases
• Entries become aggressive
• Confirmation is skipped
• Patience disappears
The account doesn’t collapse immediately.
It leaks slowly.
How to Stay Grounded After a Win
• Treat wins like losses — review them
• Take a short pause after big profits
• Reset size to default
• Ask: “Did I follow process, or did I get lucky?”
Your edge is consistency, not confidence.
The market doesn’t punish success.
It punishes arrogance.
📘 Shared by @ChartIsMirror
Do you feel more disciplined after a win…
or more confident than your rules allow?

Maybe range-bound on Friday In my view, the market is likely to be range-bound on Friday, as it is currently consolidating within a potential triangle pattern and continues to oscillate inside this formation.
For swing traders, this is not an ideal time to enter trades. Instead, it is advisable to wait for a breakout before determining the future trend direction.
Given that the recent support and resistance levels have proven to be reliable and effective in multiple tests, even if the price breaks out of the triangle zone, it may still encounter resistance and pull back, or hit support and rebound subsequently.

Gold vs Real Estate: Which Is Safer?Gold vs Real Estate: Which One Truly Keeps Your Money Safe in Uncertain Times?
When markets turn unstable, the first question that always comes up is: “ How do I keep my money safe ?”
Almost immediately, two familiar names are put on the scale: gold and real estate .
One is a globally recognized defensive asset.
The other is a tangible asset tied to land and long-term growth cycles.
But safety does not lie in the name of the asset — it lies in how you use it .
Safety does not mean “never going down”
Many people mistakenly believe that a safe asset is one that never declines in price. In reality, every asset goes through corrections .
True safety means:
When you need cash, can you actually convert it?
When markets deteriorate, can you withstand the psychological and cash-flow pressure?
When the cycle shifts, does that asset help you survive?
And this is exactly where gold and real estate begin to diverge.
Gold — safety through liquidity and defense
Gold is considered safe because it does not depend on a single economy . When inflation rises, crises emerge, or confidence in fiat currencies weakens, gold is often chosen as a safe haven.
Gold’s greatest strength is liquidity . It can be converted into cash almost instantly, nearly anywhere in the world. This makes gold an effective defensive tool during periods of strong market volatility.
However, gold does not generate cash flow . Its price can also move sideways for long periods, requiring patience and a capital-preservation mindset rather than a get-rich-quick mentality.
Real estate — safety through tangibility and long-term value
Real estate feels safe because it is tangible and familiar . The land remains. The property remains. Over the long term, real estate tends to appreciate alongside economic growth and urbanization.
In addition, real estate can generate rental income , something gold cannot offer. For investors with stable capital and no pressure to rotate funds quickly, this is a major advantage.
The trade-off, however, is low liquidity . When markets weaken or credit conditions tighten, selling property can take a long time. If leverage is involved, this so-called “safe asset” can quickly become a financial burden.
The core difference: time horizon and flexibility
Gold suits investors who value flexibility and fast response .
Real estate suits those with long-term vision, substantial capital, and the ability to endure cycles .
Gold helps you defend in the short to medium term .
Real estate helps you build wealth over the long term .
No asset replaces the other.
They differ only in their role within your financial strategy .

Gold 1H – CPI Data Uncertainty Fuels Liquidity Traps at Extremes🟡 XAUUSD – Intraday Smart Money Plan | by Ryan_TitanTrader (19/12)
📈 Market Context
Gold is trading in a tightly engineered range as markets digest the latest U.S. CPI print, which has drawn caution from economists over data reliability and seasonal distortions.
Despite headline inflation showing signs of cooling, analysts warn the data lacks clarity, keeping the Fed firmly data-dependent and USD flows unstable.
This uncertainty-driven backdrop favors liquidity manipulation over clean trends, with Smart Money likely probing both premium and discount zones to trigger stops before committing to expansion.
🔎 Technical Framework – Smart Money Structure (1H)
Current Phase: Rising structure losing momentum near premium supply
Key Idea: Expect liquidity interaction at 4363–4365 (premium) or 4300–4298 (discount) before displacement
Structural Notes:
• Higher-timeframe bullish BOS remains valid but is pausing
• Multiple rejections near highs suggest distribution, not confirmed reversal
• Equal highs above 4360 and sell-side liquidity below 4300 are exposed
• Price is rotating inside a controlled liquidity channel
Liquidity Zones & Triggers:
• 🔴 SELL GOLD 4363 – 4365 | SL 4370
• 🟢 BUY GOLD 4300 – 4298 | SL 4290
Institutional Flow Expectation:
liquidity sweep → MSS / CHoCH → BOS → displacement → FVG / OB retest → expansion
🎯 Execution Rules (matching your exact zones)
🔴 SELL GOLD 4363 – 4365 | SL 4370
Rules:
✔ Sweep above recent equal highs into premium
✔ Bearish MSS / CHoCH on M5–M15
✔ Clear downside BOS with impulsive displacement
✔ Entry via bearish FVG refill or refined supply OB
Targets:
1. 4340
2. 4320
3. 4302 – extension if USD firms post-CPI reassessment
🟢 BUY GOLD 4300 – 4298 | SL 4290
Rules:
✔ Liquidity grab below sell-side lows / channel support
✔ Bullish MSS / CHoCH confirms demand control
✔ Upside BOS with strong bullish displacement
✔ Entry via bullish FVG fill or demand OB retest
Targets:
1. 4325
2. 4350
3. 4380 – extension if CPI skepticism weakens USD
⚠️ Risk Notes
• CPI-related uncertainty increases fake breaks — wait for structure
• No entry without MSS + BOS confirmation
• Expect volatility during U.S. session
• Reduce risk near unscheduled Fed or inflation commentary
📍 Summary
Today’s gold setup is driven by CPI-driven uncertainty and Fed caution, creating prime conditions for liquidity engineering:
• A sweep above 4365 may fade toward 4300–4320
or
• A liquidity grab near 4300 could reload bullish flow toward 4350+
Let structure confirm — Smart Money reacts, retail anticipates. ⚡️
📌 Follow @Ryan_TitanTrader for daily Smart Money gold breakdowns.

Gold 4H – Is 4315 the Smart Money Reload Before 4400?🟡 XAUUSD – Weekly Smart Money Concept Plan
📈 Market Context
Gold starts the new week holding a clear 4H bullish market structure after a decisive BOS from the prior consolidation range. Price is now respecting a rising bullish trendline while consolidating beneath recent highs, suggesting controlled accumulation rather than distribution.
With USD-sensitive headlines and U.S. macro events ahead, Smart Money is likely to engineer a pullback into a discounted zone to rebalance positions before attempting another expansion leg. This environment favors patience and precision, not chasing breakouts.
🔎 Technical Analysis (4H / SMC View)
🟢 Buy Zone: 4316 – 4314
SL: 4306
TP Targets: 4350 → 4380 → 4420+
Rationale:
• Discounted pullback within a strong 4H bullish structure
• Confluence with rising bullish trendline support
• Prior consolidation high acting as demand flip
• Sell-side liquidity resting below 4310 likely to be swept
• High R:R alignment for trend-continuation longs
🔴 Sell Scenario (Conditional):
Only considered if a 4H bearish CHoCH forms below 4306 after a liquidity sweep. Otherwise, shorts are counter-trend and low probability.
⚠️ Risk Management Notes
• Execute only after M15–M30 ChoCH/BOS confirmation — no blind buys.
• Expect stop-hunts and fake breakdowns near London & New York opens.
• Scale out partials at each TP; trail runners only after structure confirms.
• Reduce risk exposure ahead of high-impact USD or Fed-related news.
Summary
Gold remains structurally bullish on the 4H timeframe. The 4316–4314 zone represents a Smart Money reload area where liquidity is likely to be swept before continuation higher.
Patience is the edge this week — let price come to value, let structure confirm, then execute with discipline.
Liquidity leads. Structure confirms. Entries follow.
🚀 Follow @Ryan_TitanTrader for more weekly SMC breakdowns
