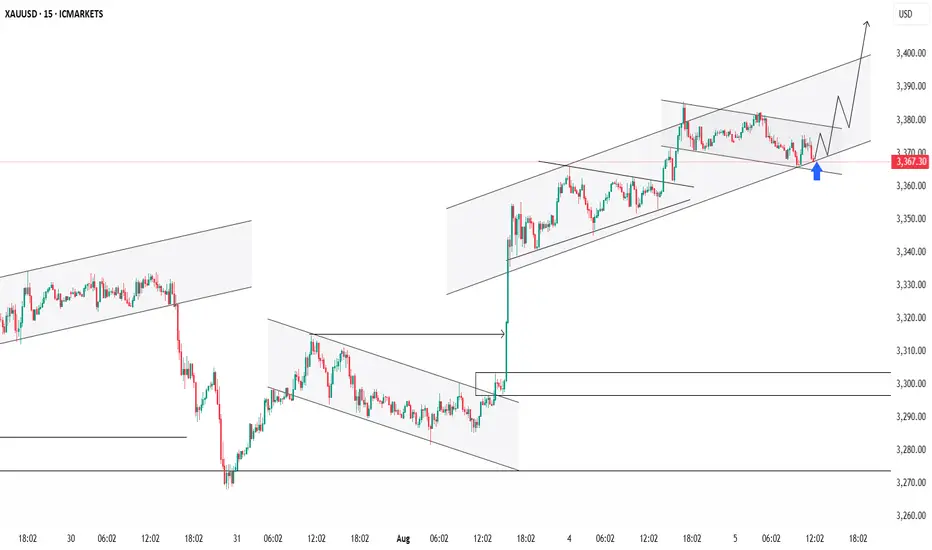
Gold structure 1H timeframe for Aug 2025The Gold 1H timeframe looks like a rectangle pattern structure for Aug 2028, looks at the key point ABCD direction plan
Futures market

XBR/USD Chart Analysis: Oil Price Declines Towards Key SupportXBR/USD Chart Analysis: Oil Price Declines Towards Key Support
As the XBR/USD chart shows, Brent crude oil has made two significant moves recently:
Last week’s price increase (A) followed President Donald Trump’s intentions to impose tariffs on India due to its purchases of Russian oil. This could have disrupted established oil supply chains.
The price decline (B) may have been driven by both the decision of OPEC+ countries to increase production and reports of a weakening US labour market.
Thus, there is reason to believe that the more than 4.5% decline in Brent crude oil prices since the beginning of August reflects market participants’ scepticism about sustained high oil prices:
→ this has a negative impact on the US economy (JP Morgan analysts raised concerns about recession risks this week);
→ increased activity from oil producers may offset supply chain disruption risks.
Technical Analysis of the XBR/USD Chart
From a technical analysis perspective, Brent crude oil has dropped to a key support level (marked in blue), which was previously active in July. A rebound from this line could happen – in such a case, the price might face resistance at the Fair Value Gap area (marked in orange), formed between:
→ $70.81 – a support level active in late July, which was broken;
→ the psychological level of $70.00.
Attention should also be paid to price behaviour around the $69.00 level (indicated by arrows) – it quickly switched roles from support to resistance, indicating aggressive bearish sentiment. Given this observation, a potential bearish breakout attempt below the blue support line cannot be ruled out.
However, whether this scenario materialises will largely depend on developments in geopolitical risks and tariff agreements.
This article represents the opinion of the Companies operating under the FXOpen brand only. It is not to be construed as an offer, solicitation, or recommendation with respect to products and services provided by the Companies operating under the FXOpen brand, nor is it to be considered financial advice.

Time is equal to price !Will gold visit again the LL at 3268 or it will pull back from 3340/3344 !
If so we may see gold making a new top at 3400 /3450/3500/3550/3600 .

Can technical factors boost gold? (Must-read for traders)After three consecutive days of strong rebounds, spot gold has entered a period of sideways trading, trading around $3,370 in the European session, with a short-term seesaw pattern. A slight rebound in the US dollar index has weighed on gold prices, but market expectations of a September Fed rate cut remain supportive. Furthermore, lingering global trade uncertainty has prevented a significant decline in safe-haven demand.
Fundamentals:
Gold's recent upward momentum has been driven by weak US economic data and rising expectations of rate cuts. Last week's non-farm payroll data showed a significant weakening in the labor market, reinforcing market bets that the Fed will begin another round of rate cuts in September. The CME FedWatch tool shows that the market's expectation of a September rate cut has exceeded 90%. Meanwhile, US factory orders plummeted 4.8% in June, further highlighting economic weakness.
On the other hand, US President Trump signed an executive order last week raising tariffs on imports from dozens of countries, with the minimum tariff rate reaching 15% for countries with trade deficits with the US. With these measures about to take effect, this uncertainty continues to weigh on global market sentiment and supports gold's safe-haven properties.
However, a slight rebound in the US dollar partially offset gold's upward momentum. Traders will be watching the upcoming US ISM Services PMI data to determine whether the economic slowdown has spread to the services sector.
Technical Analysis:
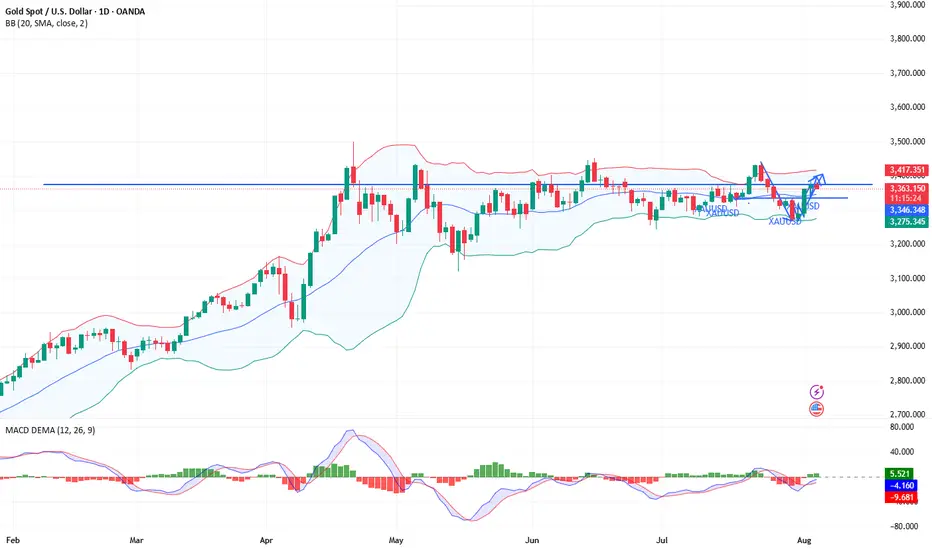
On the daily chart, gold prices have recently traded between the middle and upper Bollinger Bands (3343.59) and 3411.09, failing to break through key resistance. The overall trend remains within the medium-term range, with no clear trend emerging.
The recent candlestick chart pattern forms a typical "sideways fluctuation" pattern, indicating significant pressure near the previous high of 3438.80, while the lower Bollinger Band (3276.09) provides support, suggesting a short-term "box consolidation" pattern.
On the MACD indicator, the fast and slow lines are near the zero axis, while the DIFF and DEA lines have formed a slight golden cross, but the angle is gentle. The red bar has limited momentum, indicating insufficient upward momentum and a lack of a strong rebound.
The Relative Strength Index (RSI) remained at 54.81, within the neutral to strong range, indicating a lack of clear short-term price direction. Market sentiment remains cautious. Further attention will be paid to whether the price stabilizes above the middle Bollinger Band or retreats to test previous support levels.
Market Sentiment Observation:
Current gold market sentiment is cautiously optimistic. Traders are pricing in a high level of interest in the Federal Reserve's rate cut, driving a short-term rebound in gold prices. However, the dollar's resilience remains, limiting gold's upside potential. Indicators show a lack of significant inflows into gold ETFs, suggesting the market has not yet fully shifted to a defensive position.
The technical chart shows a typical "consolidation platform," indicating that the market is awaiting clearer policy or data guidance. Investors remain interested in safe-haven assets, but their willingness to chase higher prices is weak. In the short term, market sentiment may continue to be constrained by fluctuations in external macroeconomic data and shifting policy expectations.
Market Outlook:
Bull Perspective:
Analysts believe that if gold prices break through the upper Bollinger Band at 3411.09 and the MACD indicator expands, further upside potential is expected, with the previous high of $3450 in sight. If the Federal Reserve signals a clear interest rate cut or if the US economy continues to weaken, gold could see a mid-term trend reversal and resume its upward trend.
Bear Perspective:
Analysts believe that if gold prices remain constrained in the 3400-3411 range and fall below the middle Bollinger Band and moving average support, a short-term pullback could occur, testing the lower support band at $3276. If the ISM Services PMI exceeds expectations and the US dollar strengthens again, gold could return to bearish momentum. FOREXCOM:XAUUSD ACTIVTRADES:GOLD ICMARKETS:XAUUSD CMCMARKETS:GOLD PYTH:XAUUSD FOREXCOM:GOLD ICMARKETS:XAUUSD CMCMARKETS:GOLDZ2025 CMCMARKETS:GOLD
XAU / USD 4 Hour ChartHello traders. I just figured while I am at the computer to post the 4 hour chart now. We can see that we are coming into an area where we will either reject if support forms, or keep pushing down a bit more. We have ISM news here in the US at 10am est. I will update / post any scalp trade set ups on a lower time frame in a bit. Be well and trade the trend. Shout out to Big G. Happy Tuesday

TP REACHED ON OUR TRADE ON OILEarly this morning I posted to sell on OIL, now here I am with the results of the price reaching our TP.
Our entry was based on a reversal and a FVG as you can see on the chart, target was the previous low which the market exactly reached.
Follow for more!

XAU / USD Daily ChartHello traders. We are at an area of interest for me which is marked on the chart. We can push down to fill that wick, or reject and move back up a bit to take out any existing short positions in profit. I will post a lower time frame chart shortly. We will see Pre NY volume starting in a little under 2 hours. 7:20 am est here in the US is when we someimes see a shift to sometimes partially correct the overnight session's move. Not saying that's what will happen, just explaining what I see happen a lot of the time. Let's see how things play out. Be well and trade the trend. Shout out to Big G.

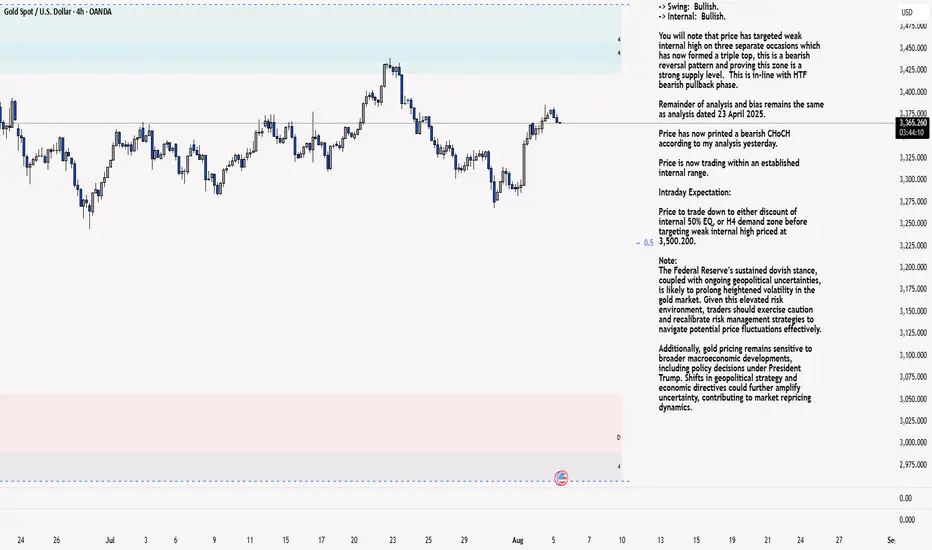
XAU/USD 05 August 2025 Intraday AnalysisH4 Analysis:
-> Swing: Bullish.
-> Internal: Bullish.
You will note that price has targeted weak internal high on three separate occasions which has now formed a triple top, this is a bearish reversal pattern and proving this zone is a strong supply level. This is in-line with HTF bearish pullback phase.
Remainder of analysis and bias remains the same as analysis dated 23 April 2025.
Price has now printed a bearish CHoCH according to my analysis yesterday.
Price is now trading within an established internal range.
Intraday Expectation:
Price to trade down to either discount of internal 50% EQ, or H4 demand zone before targeting weak internal high priced at 3,500.200.
Note:
The Federal Reserve’s sustained dovish stance, coupled with ongoing geopolitical uncertainties, is likely to prolong heightened volatility in the gold market. Given this elevated risk environment, traders should exercise caution and recalibrate risk management strategies to navigate potential price fluctuations effectively.
Additionally, gold pricing remains sensitive to broader macroeconomic developments, including policy decisions under President Trump. Shifts in geopolitical strategy and economic directives could further amplify uncertainty, contributing to market repricing dynamics.
H4 Chart:
M15 Analysis:
-> Swing: Bullish.
-> Internal: Bullish.
H4 Timeframe - Price has failed to target weak internal high, therefore, it would not be unrealistic if price printed a bearish iBOS.
The remainder of my analysis shall remain the same as analysis dated 13 June 2025, apart from target price.
As per my analysis dated 22 May 2025 whereby I mentioned price can be seen to be reacting at discount of 50% EQ on H4 timeframe, therefore, it is a viable alternative that price could potentially print a bullish iBOS on M15 timeframe despite internal structure being bearish.
Price has printed a bullish iBOS followed by a bearish CHoCH, which indicates, but does not confirm, bearish pullback phase initiation. I will however continue to monitor, with respect to depth of pullback.
Intraday Expectation:
Price to continue bearish, react at either M15 supply zone, or discount of 50% internal EQ before targeting weak internal high priced at 3,451.375.
Note:
Gold remains highly volatile amid the Federal Reserve's continued dovish stance, persistent and escalating geopolitical uncertainties. Traders should implement robust risk management strategies and remain vigilant, as price swings may become more pronounced in this elevated volatility environment.
Additionally, President Trump’s recent tariff announcements are expected to further amplify market turbulence, potentially triggering sharp price fluctuations and whipsaws.
M15 Chart:
BUY XAUUSD 5.8.2025Confluence order: BUY at M15
Type of order: Limit order
Reason:
- The current top is not touching anything, expected to rise to the H1 above.
- M15~FIBO 0,5-0,618 (same position)
Note:
- Management of money carefully at the last bottom (3,370)
Set up entry:
- Entry buy at 3,364
- SL at 3,360
- TP1: 3,370 (~1R)
- TP2: 3,383 (~4R)
- TP3: 3,391 (~6R)
Trading Method: Price action (No indicator, only trend and candles)

DeGRAM | GOLD reached the resistance level📊 Technical Analysis
● XAUUSD rebounded from the lower channel boundary near 3,294 and reclaimed resistance at 3,357.8, confirming bullish continuation inside the rising structure.
● Breakout above the triangle’s descending resistance line opens upside toward 3,435 and possibly 3,487 on strong momentum continuation.
💡 Fundamental Analysis
● Gold found renewed support as US NFP and ISM data showed softness, weakening the dollar and lowering real yields.
● Rising geopolitical risk and increased central bank gold buying in July continue to support bullish sentiment.
✨ Summary
Long above 3,357. Target 3,435 ➜ 3,487. Setup holds while price stays above 3,294 channel base.
-------------------
Share your opinion in the comments and support the idea with a like. Thanks for your support!

Crude Oil Elliott Waves With the completion of Wave 3, we are now approaching the end of Wave C.4(50% Fibonacci levels of Wave 3).Once Wave 4 is fully formed, a lower low is expected to follow as part of Wave 5.

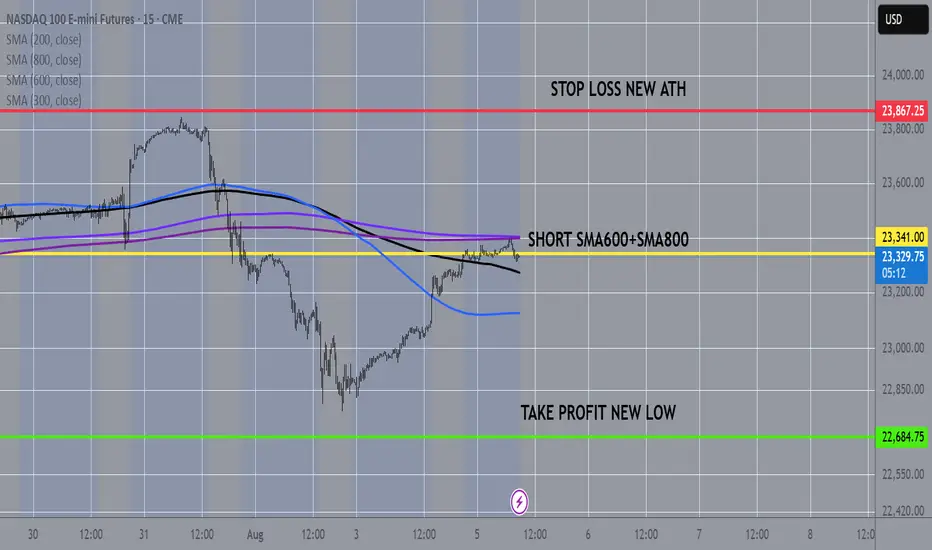
NASDAQ100 15MIN CHART FROM SMAS TO NEW LOWNasdaq100 at 10 and 15min chart touches the sma600 and the sma800 so as in many other cases before, odds are are more that it will fall from here to a new low
Soybean Long to hit 1011 CAPITALCOM:SOYBEAN Long trade, with my back testing of this strategy, Soybean need to touch 1011
This is good trade.
Don't overload your risk like Greedy gambler!!!
Be Disciplined Trader, what what you can afford.
Use proper risk management
Looks like good trade.
Lets monitor.
Use proper risk management.
Disclaimer: only idea, not advice

GOLD Breakdown: Key Levels, Smart Money Trap & Price RecapHere's a full breakdown on GOLD covering the major levels I'm watching today, what the market did yesterday, and a key trap that many traders fall for.
This video is for educational purposes only and based on my personal trading plan.

Trading balanceTrading balance The price of the asset has rebounded from the balance zone. With the prospect of growth into the resistance zone.
XPTUSD Platinum will hit 1370 - Long TradeOANDA:XPTUSD Long trade, with my back testing of this strategy, XPTUSD need to touch 1370
This is good trade
Don't overload your risk like Greedy gambler,
Be Disciplined Trader, what what you can afford.
Use proper risk management
Looks like good trade.
Lets monitor.
Use proper risk management.
Disclaimer: only idea, not advice

BUY GOLDXAUUSD has a potential bullish movement characterized by a series of supportive bullish pattern , expect the market to rise infact there might be bearish movement to recover the gapos left dude to the friday news push ...
all the best use proper risk management
the market will pay back if u employ consistancy
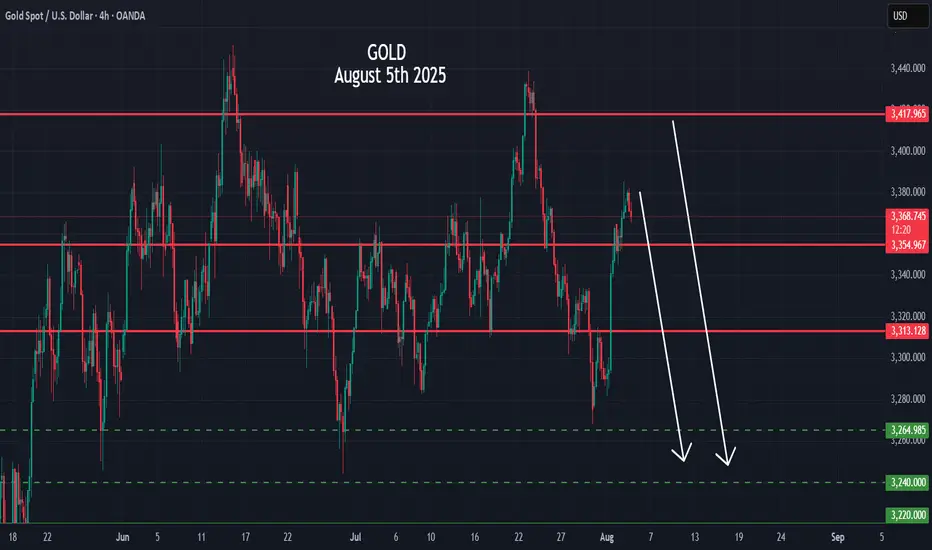
Crystal Ball Forecast for Gold (XAUUSD)🔮 Crystal Ball Forecast for Gold (XAUUSD)
Current Price: 3372
Medium-Term Direction: 🔻 DOWN
✅ My Forecast: GOLD WILL GO DOWN from 3372
🔍 Why? (Technical Reasons Supporting Bearish Outlook)
1. Gann Price Vibration (From recent high ~3385)
3372 = 45° level – key resistance level
Price rejected at 3375–3385 zone multiple times
If 3375 holds as resistance, next vibration levels:
3335 (Gann 45° down)
3284 (Gann 90° down)
3250 (Gann 120° down)
2. Elliott Wave
Looks like Wave 5 (ending diagonal) completed at 3385
Current price at 3372 = classic "after top" trap zone
Next structure likely forming ABC correction or new bearish impulse
Projection:
Wave A → 3335
Wave C → 3280–3250
3. Price Action + Candle Behavior
Strong upper wicks around 3375–3380
Lower highs forming = distribution pattern
MACD & RSI divergence visible on 4H/1D
📉 Medium-Term Bearish Targets
Target Price Reason
3335 Gann 45° down, Wave A low
3284 Gann 90° down, Wave C
3250 Gann 120°, Cycle
3183 Gann 180°, major support
📌 Summary Forecast
✳️ Gold is topping out.
✳️ Bearish move toward 3280–3250 is highly likely.
✳️ Best entry = on rejection from 3375–3380 zone
✳️ Stop = above 3390
✳️ Hold short for 2–3 weeks or until target reached
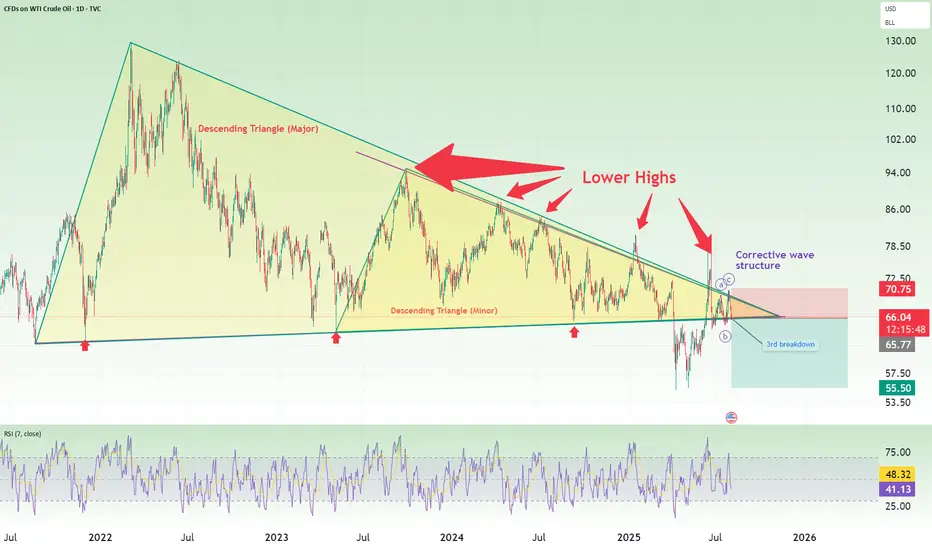
Oil short: breakdown from triangle againThis idea is backed by my general view that the stock market is going to crash in August. what this means is that we are going into a risk-off environment and there will be reduced consumption and demand for oil too.
Technically, I pointed out 4 things in this chart:
1. Descending triangles
2. Lower highs
3. 3rd breakdown (after a false break to the upside)
4. A corrective wave structure
Good luck!
XAUUSD Gold Trading Strategy August 5, 2025
Yesterday's trading session, gold prices continued to increase sharply due to previous influences. However, the possibility of a short-term correction in gold prices at the end of the week will be very high.
Basic news: According to CME FEDWatch, the probability of the Fed cutting interest rates at its September meeting has now increased to about 84%, reflecting increasing concerns about economic weakness. The market is currently pricing in at least two 25 basis point cuts between now and the end of the year, showing a clear shift in investor sentiment after disappointing employment data.
Technical analysis: Gold's bullish momentum is currently showing signs of weakening. The peak area of 3383 - 3385 may create a double peak pattern on H1, but the possibility of gold prices correcting today is very low. Currently, gold prices are filling liquidity at support areas. The correction of gold prices may take place at the end of the week when buyers take profits.
Important price zones today: 3350 - 3355 and 3330 - 3335.
Today's trading trend: BUY.
Recommended orders:
Plan 1: BUY XAUUSD zone 3350 - 3352
SL 3347
TP 3355 - 3365 - 3375 - 3400.
Plan 2: BUY XAUUSD zone 3330 - 3332
SL 3327
TP 3335 - 3345 - 3365 - 3400.
Plan 3: SELL XAUUSD zone 3420 - 3422
SL 3425
TP 3417 - 3407 - 3387 - 3357 - OPEN (small volume).
Wish you a safe, successful and profitable trading day.🌟🌟🌟🌟🌟

BUY XAUUSD ....GOLDBUY XAUUSD price gas reached a potential strong bullish orderblock and a well structured demand zone
use proper risk management

xauusd bullish signal We are about to end wave 4 as a triangle >> then we expect expansion for wave 5
It's a long-term investment.

XAUUSD SELL OFF CONTINUATION All my trade entry criterias met with the backing of the ADP Non-Farm Employment Change news release being positive for the USD, a SELL trade on GOLD
