Elite | XAUUSD | 1H – Bullish Structure, Demand HoldingOANDA:XAUUSD
After a strong impulsive push, price corrected in a controlled manner rather than dumping aggressively — a sign of healthy bullish structure. The current consolidation above demand suggests buyers are defending, but continuation is only valid if price holds above the demand box and reclaims intraday highs. Failure to hold this zone opens a deeper corrective move toward lower channel support.
Key Scenarios
✅ Bullish Continuation 🚀
Condition:
1H close holding above 4310
Break and acceptance above 4340
🎯 Target 1: 4375
🎯 Target 2: 4400
🎯 Target 3: 4430
❌ Bearish Breakdown 📉
Condition:
Strong 1H close below 4300
🎯 Downside Target 1: 4275
🎯 Downside Target 2: 4252 (major structure support)
Current Levels to Watch
Resistance 🔴: 4340 – 4375
Support 🟢: 4310 – 4300 – 4252
⚠️ Disclaimer: This analysis is for educational purposes only. It is not financial advice.
Futures market

Ma 22 Dec - Daily OutlookGold Longs
Valid trade setup on Friday, but closure due to weekend setup. You can't know what price you'll get Monday morning so poses a great risk due to lack of risk management during the weekend.
Again, longs are most plausible setup for gold. Put some alerts on 50-mark and the high to see what we are going to get. However, I don't expect that much to happen.
Clear daily setup, but we need lots of liquidity to get something good today.

Multi Top - Multi Bottom. Go Next Your Golden Shift4500 to take a bag (supply area). 4400 - to jingle that.
XAU-USDOn the 4-hour timeframe, gold has just set a new high for itself, and the previous high around $4380 has been turned into support 📊📈
So the important point is that as long as the price stays above this $4380 level, it can continue its trend 🕯🚀
The first new resistance will be the top of this ascending channel 🔼✔️

XAUUSDXAUUSD Key Levels On Watch:
Gold is currently in a short-term pullback after a strong bullish impulse. Price is correcting toward a key demand/support zone marked on the chart (green area). This zone previously acted as a base and may attract buyers again.
• Overall structure remains bullish.
• Current move looks like a healthy retracement
• Support zone around 4315–4320
• If price reacts strongly from this area, a bullish continuation toward the previous highs is possible
• A minor dip into support followed by strong rejection would confirm buyer strength
📈 Bias: Buy on confirmation from support.
⚠️ Always wait for confirmation and manage risk properly

The leprechaun storyAt the end of the rainbow is the leprechaun's gold; the leprechaun was captured and demand at which potato patch his gold was buried or he'll be in trouble; the leprechaun pointed to a patch in which his capturer started digging until so tiresome that it ended without digging deep enough; the capturer gave up and went away so the leprechaun dug in the same spot a little deeper and retrieved his gold to bury at the end of a different rainbow in a different potato patch; moral is that a little respect can give you the best offer rather than the other side of the coin.

XAGUSD VIEWSpot gold
GOLD
was up 1.4% at $4,397.16 per ounce, as of 0502 GMT, after breaking the $4,400 barrier to hit a record high of $4,400.29 earlier in the day. Spot silver
XAGUSD1!
climbed 3.3% to hit a historic high of $69.44.

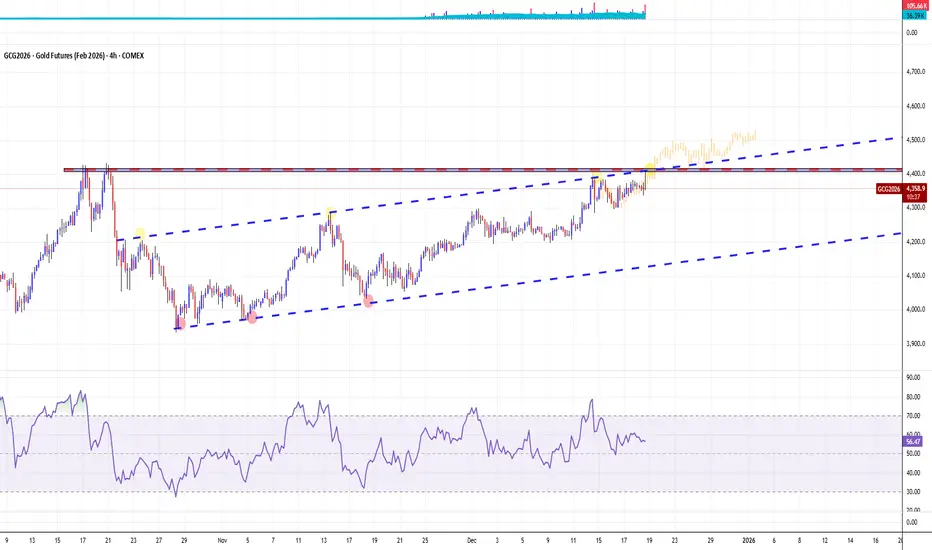
GOLD Technical Analysis - Correction Incoming?OANDA:XAUUSD Price is currently trading within a clearly defined ascending channel , with price action now testing the upper boundary. This area may act as dynamic resistance , and if price is rejected here, a corrective move back toward the 4,375 support zone is likely.
If buyers manage to defend this support level, the bullish structure remains intact, opening the door for price to resume its upward move toward higher highs . However, a decisive break below this zone could trigger a deeper pullback toward the lower boundary of the channel .
Closely monitoring candlestick patterns in this area , price reaction on the retest, and confirmation signals is essential to avoid FOMO and time entries effectively. Always apply strict risk management, enter trades only when the setup is confirmed, and stay disciplined with your trading plan.
If you have any thoughts on this setup or additional insights, feel free to share them in the comments.

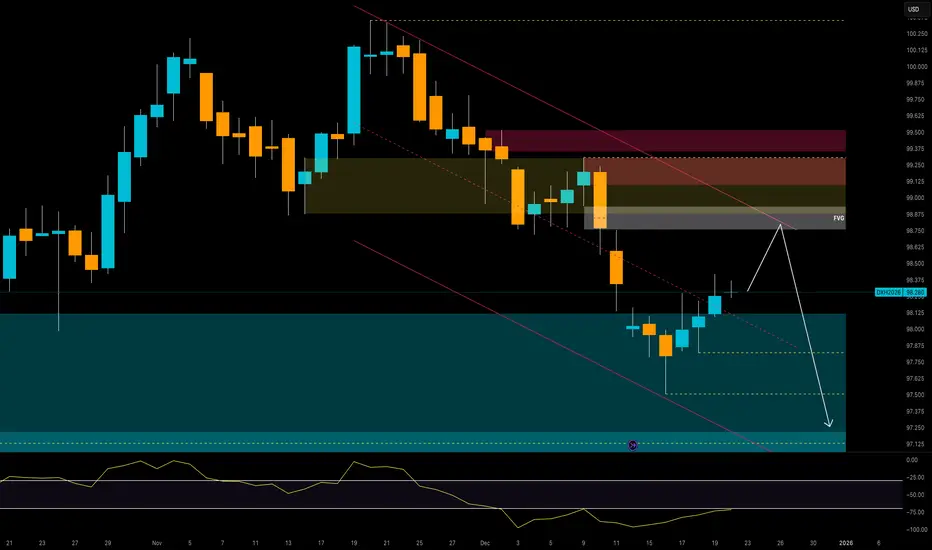
US Dollar Index – Temporary Relief Before Further Downside?The US Dollar Index continues to trade under structural pressure on the daily chart, following the strong downside impulse that broke November’s value area and pushed price into a key weekly demand zone around 97.90–97.30. After a clear momentum swing lower, the index is now showing early signs of corrective strength, but the broader context continues to favor weakness into year-end.
On the technical side, price has reacted from support and is attempting a corrective retracement toward the 98.75–99.00 supply zone. This zone aligns with:
– Daily bearish trendline resistance
– A fresh Fair Value Gap (FVG)
– Previous structure imbalance
If price completes this pullback, the zone provides a high-probability region for bearish continuation targeting new lows into 97.50–97.20. The RSI remains below the midline, indicating momentum has not fully shifted to the upside and that current strength is corrective, not impulsive.
Seasonality reinforces this bearish narrative. December historically records negative averages in the Dollar Index across virtually every timeframe. The 20-year average in particular shows strong downward pressure late in the month, with typical weakness accelerating into year-end. Current price action is consistent with this seasonal pattern.
From a positioning standpoint, the latest COT report shows Non-Commercial traders significantly net short, with shorts sitting at 28,652 vs. longs at 14,778. This imbalance continues to reflect confidence in downside continuation. At the same time, the Commercial category reduced long exposure and increased shorts, adding further weight to bearish bias. The aggregate positioning structure is clearly aligned with the existing downtrend.
Overall, the Dollar Index remains structurally bearish. A final upside correction into the 98.75–99.00 supply zone could precede the next leg lower. Only a clean break and close above 99.20 would weaken the bear case and signal a potential shift in directional bias. Until then, rallies remain sell-side opportunities.
Bullish Gold, a sharper and stronger move expected.I am expecting that Gold will go sharply bullish. Price target is expected to be around 4600$.
This would be completing an 5-3-5) structure.

Axis Bank | Gann Square of 9 – Intraday Case Study | May 20, 202This idea shares a historical intraday case study on Axis Bank Ltd using WD Gann’s Square of 9 to observe price movement through angular degrees.
On 20 May 2022, Axis Bank began the session near ₹658 , which was treated as the 0° reference level for the day. From this base, price started a steady upward movement.
Using Gann Square of 9 calculations, the 45° level for the session was derived at ₹671.
By mid-session, the stock reached this 45° degree value, completing its normal angular rotation. Although there was no sharp rejection at that moment, price respected the 45° level and continued to trade around it, eventually closing near the same angular zone.
This behavior aligns with Gann’s principle that markets often move in measured geometric steps, where completion of key degrees highlights areas of balance, pause, or potential reaction.
📌 Key Observations
0° reference at ₹658 guided the session structure
45° level at ₹671 acted as an important angular milestone
Price respected the degree level even without a strong reversal
Degree completion reflects market rhythm, not prediction
📘 Educational Insight
This example demonstrates how price–angle geometry can help traders study intraday behavior logically. Gann methods focus on structure and timing, allowing traders to analyze market movement without emotional bias.
Disclaimer:
This idea is shared strictly for educational and analytical purposes only. It is not a trading recommendation.

Axis Bank | Gann Degrees & Intraday Reversal | May 25, 2022This idea presents a historical intraday case study on Axis Bank using WD Gann degree calculations to analyze price behavior and reversal zones.
On 25 May 2022, Axis Bank opened with a downward bias. The intraday reference was established using the day’s high at ₹672, marked as the 0-degree (0°) level.
Based on Gann degree progression, the following levels were derived:
0° → ₹672
45° → ₹659
90° → ₹646
As price declined during the session, it approached the 45° level but did not complete the full degree movement before the late afternoon. Around 12:45 PM, the stock reacted sharply from ₹660.05, which was within 1 point of the calculated 45° level (₹659).
This reaction occurred inside acceptable price tolerance and aligned with Gann’s concept of degree-based support, after which the stock moved higher toward ₹667, forming a clean intraday recovery.
📌 Key Observations
Degree levels help define logical support and resistance
Minor deviations around exact levels are normal
Time + price alignment improves trade structure
Not every move needs indicators to be explained
📘 Educational Takeaway
This example shows how Gann geometry converts price movement into measurable zones, helping traders analyze intraday behavior with structure instead of emotion.
Disclaimer:
This chart study is shared for educational and analytical purposes only. It is not a trade recommendation.

Axis Bank | Gann Numbers & 45° Reversal – Intraday Case StudyAxis Bank | Gann Numbers & 45° Reversal – Intraday Case Study | Sep 14, 2022
This idea presents a historical intraday case study on Axis Bank Ltd, highlighting the use of Gann Numbers and angular price movement to study reversals.
On 14 September 2022, Axis Bank opened with bullish momentum. The 0° reference level for the session was identified at ₹794, based on the day’s price structure.
Using Gann Number calculations, the next key angular projection was derived:
0° = ₹794
45° = ₹808
As the session progressed, price advanced steadily and completed the 45° level before 14:30, which aligns with Gann’s time–price principles. After reaching this degree, Axis Bank showed clear rejection from the 45° zone, indicating a potential intraday SELL setup.
Although the full downside target was not achieved, price respected the angular level, validating the mathematical structure behind Gann’s approach.
📌 Key Takeaways
0° acts as the base reference for intraday structure
Completion of 45° before 14:30 often signals exhaustion
Rejection from degree levels reflects market balance
Focus is on geometry and timing, not prediction
📘 Educational Note
WD Gann’s methodology emphasizes that markets move in measured degrees, where price and time work together. Such case studies help traders analyze logical reversal zones without relying on indicators or emotions.
Disclaimer:
This idea is shared strictly for educational and analytical purposes only and is not investment advice.

XAU/USD (Gold) – H1 Analysis...XAU/USD (Gold) – H1 Analysis (As per my chart)
Market Structure
Price is in a strong bullish trend with higher highs & higher lows.
Trading above the Ichimoku cloud, showing buyers are in control.
Current consolidation above previous resistance indicates bullish continuation.
---
📈 Buy Scenario
Buy Zone: 4320 – 4340
🎯 Targets
Target 1: 4380
Target 2: 4420
---
❌ Invalidation
A strong H1 close below 4300 will weaken the bullish setup.
---
📌 Summary
Trend: Bullish
Bias: BUY
Expectation: Continuation toward higher resistance levels

Axis Bank | Gann Square of 9 Intraday Case Study | 15 Sept 2022This idea documents a historical intraday study of Axis Bank using the WD Gann Square of 9 to understand how price reacts at degree-based levels.
On 15 September 2022, Axis Bank showed downward momentum, with the day’s high at ₹806 taken as the 0-degree (0°) reference point.
Using Square of 9 calculations, the important projected levels were:
45° → ₹792
90° → ₹778
By before 2:30 PM, price completed its 45° movement and reached ₹792, aligning with Gann’s concept of normal intraday capacity. At this level, price stabilized and showed a supportive reaction, leading to a short-term upward move.
Although the rebound was limited and did not extend significantly beyond the intraday range, the price behavior respected the mathematical structure of the Square of 9, reinforcing how degree-based levels can act as logical support zones.
This case demonstrates that:
Not every setup produces large profits
Structure, timing, and discipline matter more than outcome
Gann levels help traders avoid emotional decision-making
📌 Key Square of 9 Levels
0° → ₹806
45° → ₹792
90° → ₹778
📘 Educational Notes
45° completion before 2:30 PM often marks a reaction zone
Minor tolerance around levels is common
Square of 9 provides price clarity, not prediction certainty
Disclaimer:
This idea is shared strictly for educational and chart-study purposes only. It is not trading advice.

XAUUSD Update-Breakout Confirmed, Waiting for the Next SetupIn last week’s gold analysis, we mentioned that the bullish trend was getting exhausted and that the market needed a consolidation phase. We outlined two scenarios for a continuation higher.
At this point, scenario one has played out: price found support at the trendline and successfully broke above resistance.
Right now, this is not an ideal entry zone, and patience is required to determine whether this breakout is genuine or a fake move.
If price pulls back to the former resistance — now acting as support — and prints a bullish confirmation, it could offer a good long entry.
However, if the breakout fails and support breaks, this scenario could be even more attractive, as it may provide cleaner entries with tighter stops.

Hellena | GOLD (4H): LONG to resistance area of 4417.This week, I expect the upward movement to continue and the medium-term “12345” impulse to complete.
I expect to see a small correction, after which I expect to see at least the 4417 area reached at the end of wave “5” or in the extension of wave “3”.
This week, after the completion of this movement, I plan to figure out our next steps.
It may be that a major correction awaits us in the near future, but we will talk about that later.
Manage your capital correctly and competently! Only enter trades based on reliable patterns!

XAUUSD BUY 4375On the weekly chart, XAUUSD broke through the inside bar, reaching a new all-time high. Currently, watch for support around 4375; a pullback and stabilization could present a buying opportunity, with an upside target of 4450-4500.


XAUUSDXAUUSD remains in a strong uptrend. Today, the price reached a new high of $4409. Due to excessive buying pressure, I believe that if the price fails to break through $4425, a short-term correction is possible. Consider selling in the red zone, with a target of 4322, 4124
🔥Trading futures, forex, CFDs and stocks carries a risk of loss.
Please consider carefully whether such trading is suitable for you.
>>GooD Luck 😊
❤️ Like and subscribe to never miss a new idea!

3-Decade Rate Milestone: How Markets Digest Policy ShocksA Central Bank Decision Decades in the Making
When a central bank moves interest rates to levels not seen in three decades, markets rarely respond in a linear or orderly fashion. Such decisions are not interpreted as isolated adjustments, but as structural signals that force participants to reassess positioning, risk, and longer-term assumptions.
The recent interest rate increase by the Bank of Japan marked exactly that kind of milestone. Beyond the numerical change itself, the decision carried symbolic weight: a clear departure from an era defined by extraordinary accommodation. Yet, rather than triggering a straightforward repricing, the immediate market response leaned heavily toward aggressive selling pressure in the Japanese Yen.
This disconnect between policy intent and market reaction highlights an important reality: markets do not simply react to decisions — they digest them. And digestion is often messy.
From Policy Shock to Positioning Shock
Major policy announcements tend to unfold in two phases. The first phase is informational, where the headline is absorbed. The second phase is positional, where traders and institutions adjust exposure based on how that information interacts with existing risk.
In this case, the rate hike represented a known risk event, but its implications were far from binary. Messaging around future policy paths, real-rate dynamics, and external yield differentials all contributed to uncertainty. That uncertainty translated into heavy participation on the sell side, not because the outcome was definitively bearish, but because positioning needed to be reset.
This is where flow-based tools become especially valuable. Price alone often obscures what is really happening beneath the surface.
Flow Exhaustion as an Analytical Framework
Flow exhaustion is not about calling tops or bottoms. It is about identifying moments when participation becomes unusually one-sided, increasing the probability that continuation becomes harder to sustain.
One easy way to observe this phenomenon is through Volume Delta, defined as the net difference between buying volume and selling volume over a given period. Volume Delta provides insight into how aggressively one side of the market is pressing its case.
Unlike traditional price-based indicators, Volume Delta focuses on effort rather than outcome. Price can move modestly while effort is extreme — and it is often in those situations where future responses become most interesting.
Bollinger Bands® on Volume Delta, Not Price
In this framework, Bollinger Bands® are applied not to price, but to Volume Delta itself. This distinction is critical.
Bollinger Bands® on price measure volatility relative to price behavior. Bollinger Bands® on Volume Delta measure participation extremes relative to historical flow behavior. When Volume Delta trades far beyond its lower band, it signals that selling pressure is not just dominant, but statistically stretched.
On the daily chart, Volume Delta recently moved well below its lower Bollinger Band®. This represents an exaggerated imbalance, suggesting that sellers were acting with urgency and intensity rarely sustained over extended periods.
Importantly, this does not imply that price must reverse. It simply indicates that the marginal impact of additional sellers may be diminishing.
What Extreme Selling Really Means
Extreme selling does not mean that buyers suddenly appear in force. It means that the market has already absorbed a significant amount of sell-side participation.
In practical terms, when Volume Delta reaches such depressed levels, one of two things tends to occur:
Selling slows, leading to consolidation or corrective movement.
Price seeks lower levels where new participants are willing to engage.
Which outcome unfolds depends heavily on structure — specifically, what lies beneath price.
The Support Landscape Below Price
A critical observation in the current structure is the absence of UFO support levels (UnFilled Orders) beneath current price levels. UFO supports represent areas where prior institutional participation was not fully satisfied, often acting as structural reference points.
Without meaningful UFOs below, the market cannot rely on obvious liquidity-backed demand. Instead, attention shifts to historical technical supports derived from prior pivot lows.
Two such levels stand out:
0.0063330
0.0062415
These levels represent areas where price previously found acceptance.
Reaction Zones, Not Assumptions
At this stage, the distinction between anticipation and reaction becomes essential. Extreme Volume Delta does not justify preemptive positioning. Instead, it highlights zones where observation becomes critical.
At each technical support, traders may evaluate:
Whether selling pressure visibly decelerates
Whether price stabilizes despite continued effort
Whether daily closes show acceptance or rejection
The first support may hold. It may also fail. The absence of structural UFO support means the market retains flexibility, and traders must adapt accordingly.
Overhead Structure: Supply Still Matters
While attention often gravitates toward potential downside exhaustion, it is equally important to recognize what exists above price.
A relevant sell-side UFO resistance is located near 0.0065640. This zone represents UnFilled Sell orders and remains structurally intact.
Should price respond positively from lower levels, this area becomes a natural reference point where supply could reassert itself. In downtrending environments, rebounds frequently encounter resistance before any broader shift occurs.
This reinforces the importance of framing any upside move as corrective unless proven otherwise by structure.
Hypothetical Trade Framework (Illustrative Case Study)
To translate these observations into a practical framework, consider a purely illustrative example.
A hypothetical long-side case study could involve:
Monitoring price behavior at either technical support level
Waiting for evidence of stabilization or responsive buying
Using the support zone as a contextual risk reference
Defining invalidation below the chosen support
Referencing the overhead UFO resistance as a potential objective (target)
The reward-to-risk profile in such a framework depends entirely on execution and confirmation. This example is presented solely to demonstrate how flow exhaustion and structure may be combined.
Contract Specifications
This analysis references both standard and micro futures contracts to illustrate scalability and risk calibration.
Japanese Yen Futures (6J):
Tick size: 0.0000005
Tick value: $6.25
Currently ~$2,800 per contract
Micro JPY/USD Futures (MJY):
Tick size: 0.000001
Tick value: $1.25
Currently ~$280 per contract
Margin requirements vary by market conditions and broker policies. Micro contracts can be particularly useful in environments where volatility expands following macro events.
Risk Management Considerations
Policy-driven markets tend to remain unstable longer than expected. Even when selling pressure appears exhausted, uncertainty persists.
Key risk management principles include:
Defining risk before engagement
Adjusting size to reflect volatility
Avoiding emotional responses to extreme indicators
Accepting that not all exhaustion leads to reversals
Structure, not conviction, should guide decision-making.
How Markets Digest Policy Shocks
Major policy milestones do not resolve narratives — they reshape them. Flow extremes reveal stress points in positioning, not certainty in direction.
In the aftermath of a 3-decade rate milestone, the market enters a digestion phase. Volume Delta extremes suggest that selling pressure has been intense, but structure determines how that pressure resolves.
Patience, observation, and disciplined reaction remain the most reliable tools when markets recalibrate after historic decisions.
Data Consideration
When charting futures, the data provided could be delayed. Traders working with the ticker symbols discussed in this idea may prefer to use CME Group real-time data plan on TradingView: www.tradingview.com - This consideration is particularly important for shorter-term traders, whereas it may be less critical for those focused on longer-term trading strategies.
General Disclaimer
The trade ideas presented herein are solely for illustrative purposes forming a part of a case study intended to demonstrate key principles in risk management within the context of the specific market scenarios discussed. These ideas are not to be interpreted as investment recommendations or financial advice. They do not endorse or promote any specific trading strategies, financial products, or services. The information provided is based on data believed to be reliable; however, its accuracy or completeness cannot be guaranteed. Trading in financial markets involves risks, including the potential loss of principal. Each individual should conduct their own research and consult with professional financial advisors before making any investment decisions. The author or publisher of this content bears no responsibility for any actions taken based on the information provided or for any resultant financial or other losses.

Gold Ready to Fly Triangle Breakout BUY Setup📊 XAUUSD (Gold) Technical Analysis – BUY Bias
Timeframe: Intraday (as shown)
Market Structure: Bullish / Consolidation before continuation
---
🔍 Market Structure Breakdown
Price previously accumulated in a range, then made a strong impulsive bullish move → confirms bullish BOS (Break of Structure).
After the impulse, price entered a higher-range consolidation (smart money re-accumulation).
Current price is forming a bullish triangle / compression pattern, showing reduced volatility before expansion.
---
📌 Key Zones
Demand / Support Zone:
Lower boundary of the triangle + previous range high (acting as support).
Resistance / Liquidity Area:
Equal highs above the range → buy-side liquidity resting above.
---
📈 Price Action Insight
Multiple higher lows → buyers defending aggressively.
Wicks rejecting the downside → selling pressure is weak.
Structure suggests continuation, not reversal.
---
🎯 Trade Idea (Based on Chart)
Bias: BUY
Entry: On triangle breakout OR pullback from demand zone
Targets:
TP1: Range high
TP2: Next liquidity zone (flagged area)
Stop Loss: Below triangle support / last higher low
> This setup aligns with Smart Money accumulation → expansion model
---
🧠 Summary
Trend: Bullish
Pattern: Triangle / Re-accumulation
Liquidity: Above highs
Probability: High for upside continuation

Systematic Risk in the Global Trading Market1. Introduction to Systematic Risk
Systematic risk, often referred to as market risk, represents the risk inherent to the entire market or a specific segment of the market. Unlike unsystematic risk, which is specific to a company or industry, systematic risk cannot be eliminated through diversification. It affects all securities and assets in a market simultaneously and is driven by broad economic, political, and social factors.
In the global trading context, systematic risk is particularly significant because financial markets are interconnected. Events in one country, such as economic slowdowns, political instability, or central bank policy shifts, can ripple across international markets, influencing stocks, bonds, currencies, and commodities worldwide.
2. Types of Systematic Risk
Systematic risk can be classified into several main categories:
2.1. Interest Rate Risk
Interest rate changes by central banks (like the Federal Reserve, European Central Bank, or Reserve Bank of India) can have a massive impact on financial markets.
Global Effect: Rising interest rates increase borrowing costs for corporations and governments, potentially slowing economic growth and affecting stock valuations worldwide.
Example: A US Federal Reserve rate hike often strengthens the US dollar and can cause capital outflows from emerging markets.
2.2. Inflation Risk
Inflation risk, or purchasing power risk, is the risk that rising prices erode the value of investments.
Global Effect: Inflation in major economies influences global trade and capital flows. For instance, higher inflation in the US can trigger interest rate hikes, impacting global equity and bond markets.
2.3. Economic/Business Cycle Risk
Economic slowdowns or recessions affect virtually all asset classes.
Global Effect: A slowdown in China can affect commodity-exporting countries; European debt crises may impact global banks and investors.
2.4. Political and Geopolitical Risk
Political instability, wars, trade sanctions, or elections in major economies can trigger global market volatility.
Global Effect: For example, trade wars between the US and China can disrupt global supply chains, affecting stock markets, commodities, and currencies worldwide.
2.5. Currency Risk (Exchange Rate Risk)
In global trading, currency fluctuations create systematic risk for multinational investors.
Example: A strong US dollar can negatively affect emerging market equities and commodities priced in dollars, while benefiting US-based exporters.
2.6. Market Sentiment Risk
Market sentiment or herd behavior can amplify systematic risk. Global investors’ fear or optimism can lead to synchronized buying or selling across markets.
Example: During the 2008 financial crisis, negative sentiment in the US mortgage market quickly spread to Europe and Asia, causing a global market collapse.
3. Measuring Systematic Risk
Systematic risk is often measured using Beta (β) in finance.
Beta Definition: Beta measures the sensitivity of a security or portfolio to overall market movements.
β = 1: The security moves in line with the market.
β > 1: The security is more volatile than the market.
β < 1: The security is less volatile than the market.
For global portfolios, beta helps investors understand how exposure to international markets affects risk. For example, a US-based investor with emerging market equities will have a higher beta due to the vulnerability of those markets to global economic shocks.
Other quantitative measures include Value at Risk (VaR), which estimates potential losses under normal market conditions, and stress testing, which evaluates the impact of extreme market scenarios.
4. Systematic Risk in Global Trading
4.1. Impact on Equity Markets
Global stock indices are highly sensitive to systematic risk. Factors such as economic data releases, central bank policies, and geopolitical events affect investor confidence globally.
Example: The US S&P 500 drop often triggers declines in Asian and European markets due to investor panic and cross-border capital flows.
4.2. Impact on Forex Markets
Foreign exchange markets react to global systematic risks, including interest rate differentials and geopolitical tensions.
Example: Political turmoil in Europe can lead investors to move funds into “safe-haven” currencies like the US dollar, Swiss franc, or Japanese yen.
4.3. Impact on Commodities
Commodity prices, such as oil, gold, and metals, are influenced by global demand-supply factors and geopolitical stability. Systematic risks like global recessions or oil-producing country conflicts can affect prices worldwide.
4.4. Impact on Bonds
Government bond markets reflect systematic risk through yields and spreads. Rising risk aversion increases demand for safe-haven bonds (like US Treasuries), lowering yields, while risky assets may face selling pressure.
5. Strategies to Manage Systematic Risk
Since systematic risk cannot be eliminated through diversification alone, investors adopt alternative risk management strategies:
5.1. Hedging
Using derivatives such as futures, options, and swaps to hedge against interest rate, currency, or commodity price fluctuations.
5.2. Asset Allocation
Global Diversification: Investing in a mix of countries, sectors, and asset classes to reduce exposure to region-specific events while acknowledging systematic risk exists.
Risk-adjusted allocation: Adjusting weights of assets based on beta or historical volatility.
5.3. Safe-Haven Assets
Allocating funds to assets like gold, US Treasuries, or the Swiss franc during periods of high market uncertainty.
5.4. Dynamic Portfolio Management
Regularly monitoring global economic indicators, central bank policies, and geopolitical developments to adjust positions proactively.
6. Real-World Examples of Systematic Risk
2008 Global Financial Crisis: Triggered by US subprime mortgage collapse, it spread worldwide, affecting equities, bonds, commodities, and currencies.
COVID-19 Pandemic (2020): Global lockdowns caused simultaneous declines across all asset classes, highlighting the interconnectedness of systematic risk.
Russia-Ukraine War (2022): Triggered spikes in oil, gas, and wheat prices globally, showing geopolitical events as major sources of systematic risk.
7. Conclusion
Systematic risk is an inevitable part of global trading, influencing all financial markets simultaneously. Unlike company-specific risks, it cannot be eliminated through diversification alone but can be managed through strategic hedging, global asset allocation, and risk-adjusted portfolio management. Understanding systematic risk helps investors anticipate market movements, protect capital, and make informed decisions in an increasingly interconnected global economy.
In summary, global traders and investors must remain vigilant to macroeconomic indicators, geopolitical developments, and market sentiment because systematic risk shapes the ups and downs of global markets, regardless of individual company performance.
