August 5, 2025 - XAUUSD GOLD Analysis and Potential OpportunitySummary:
Price action has been choppy and indecisive, with no clean signals or clear levels. In the absence of a solid short setup, the main idea for the Asian session is to buy on dips. Watch the 3385 resistance zone closely — if price breaks and holds above, look for long opportunities on a pullback. If 3385 is rejected, it may offer a good risk-reward short setup.
📍 Key Levels to Watch:
• 3405 – Resistance
• 3400 – Psychological level
• 3385 – Resistance
• 3378 – Resistance
• 3371 – Key intraday support
• 3365 – Support
• 3350 – Psychological level
• 3345 – Support
📈 Intraday Strategy
SELL if price breaks below 3371 → watch 3365, then 3358, 3350, 3345
BUY if price holds above 3378 → target 3385, then 3394, 3400, 3405
👉 If you find this helpful or traded using this plan, a like would mean a lot and keep me motivated. Thanks for the support!
Disclaimer: This is my personal view, not financial advice. Always use proper risk control.
Futures market
Gold – Eyeing the H4 FVG Before the Next Bull RunPrice has been consolidating within the current Asian range after running last week’s high and today’s daily high. The move into D-H lacked strong momentum, and with a large unfilled H4 Fair Value Gap (3,350–3,372) below, I’m anticipating a retracement to rebalance liquidity before resuming the bullish trend.
Key Notes:
D-H (~3,436) acting as short-term resistance.
Watching for a sweep of D-H to create excess on the DOM, then a potential breakdown toward the H4 FVG.
Bearish path targets: 3,397 → 3,372 → 3,350.
Bullish continuation requires a clean breakout and hold above D-H with volume.
This scenario could set up a stronger bullish leg later in the week, especially if the retracement aligns with London or NY session volatility.

Gold price today August 5: strong reversalWorld gold prices unexpectedly reversed sharply, as Europe and the US continued to release poor economic data. Specifically, the European economic area announced the investor confidence index released monthly by Sentix GmbH, August at a decrease of 3.7 points, much lower than the increase of 4.5 points in July.
In the US, factory orders released monthly by the US Census Bureau, measuring the change in the value of new orders for goods purchased at US factories, decreased by 4.8% in June compared to the previous month. Although slightly higher than the forecast of a decrease of 4.9%, it decreased sharply compared to the increase of 8.3% in May.
Thus, both the US and the European region are showing weaknesses in economic development. Because new orders in the US are considered a forward-looking indicator of upcoming demand for manufactured goods. Falling orders indicate that the production and business activities of US enterprises will face difficulties in operation.
8/5: Watch for Short Opportunities Near 3400Good morning, everyone!
On Wednesday, gold held above the key support area at 3343–3337, and subsequently broke through the 3372–3378 resistance zone, leading to a strong bullish move and solid long-side gains.
Today, attention should shift to the major resistance around 3400. If bullish momentum continues, price may approach the secondary resistance near 3420. However, from a technical perspective, signs of bearish divergence have begun to emerge. Should price continue rising while momentum weakens, the risk of a short-term correction increases accordingly.
Key levels to monitor:
Primary resistance zone: 3404–3416
Intermediate supply area: around 3398
Crucial support zone: 3372–3363 (a hold here could support further upside)
⚠️ Cautionary Note:
The US PMI data release during the New York session could introduce volatility. Be sure to maintain strict risk management and stop-loss discipline during periods of increased uncertainty.
🔁 Trading Bias for Today:
Prefer selling into strength near resistance, while cautiously considering buying on dips near support.
The 3343–3337 area continues to serve as the primary support zone, and price action around this level will be critical in determining the next directional move

XAGUSD: Correction May Be Over – Watch $37.60 BreakoutAfter reaching a local top around the $39.50 zone on July 24, Silver entered a normal corrective phase, with price dropping over 3,000 pips from top to bottom — roughly an 8% retracement.
📉 Despite the strength of the drop, the structure was clearly corrective, not impulsive. Even more, the move formed a descending broadening wedge, a pattern that often hints at a potential reversal.
📈 Yesterday, we saw a clean breakout above the wedge’s upper boundary — which may signal the end of the correction.
At the time of writing, price is trading at $37.45, right under a key horizontal resistance zone between $37.50 and $37.60.
A breakout above this level would confirm the low and likely initiate a new move toward the $38.70 resistance.
________________________________________
🎯 Summary & Plan:
• A break above $37.60 = bullish confirmation
• Target: $38.70 (first resistance)
• Invalidation: If price drops below $37, bulls lose control
As long as price holds above the $37 zone, the technical outlook remains constructive, and traders could consider setups aligned with the upside scenario. 🚀
Disclosure: I am part of TradeNation's Influencer program and receive a monthly fee for using their TradingView charts in my analyses and educational articles.

Gold - Brent OilGold and oil are poised for a 7-10% price surge amid escalating Middle East tensions. Oil prices face downward pressure from US efforts to stabilize markets, but supply risks from the conflict-prone region—a major production hub—may override this, driving prices higher. Meanwhile, investors are likely to flock to gold as a safe-haven asset to hedge against volatility, boosting demand and prices. Historically, geopolitical instability strengthens gold’s appeal, and current conditions suggest a repeat of this trend.
Sasha Charkhchian

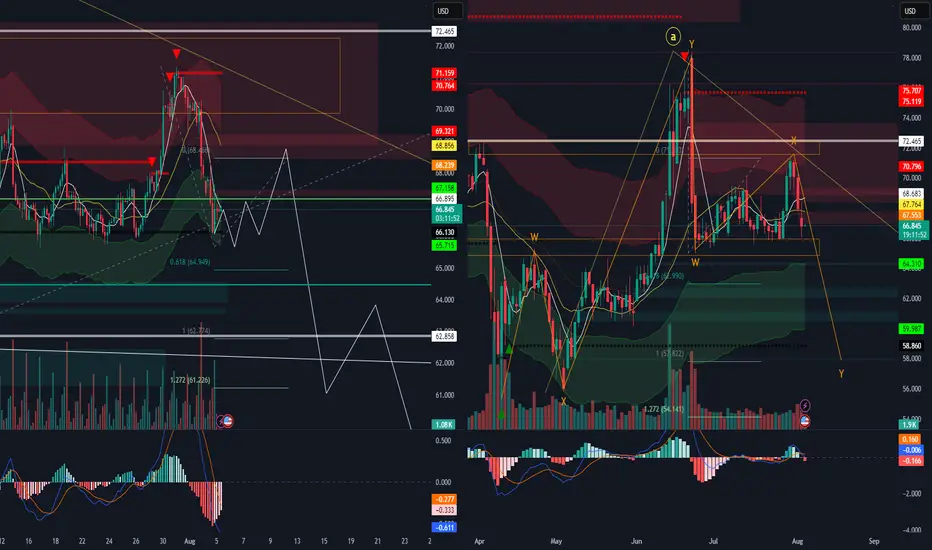
Oil Seems to soon drop downOil grand super Cycle suggests a further down move pursuing wave B towards 57.845 or 50.268. However before this great move down, we should see a slight fall to 66.104 or 65.673 the a sudden jump to 69.141 from that level we may see a drop in probably august to the 50.268 or 62.858
XAUUSD breaks out – bullish bias returnsGold has bounced from the bottom of the descending channel, initiating a clear upward move with a series of strong bullish candles. On the H2 chart, price has broken above the upper boundary of the medium-term downtrend channel and filled the nearest fair value gap, signaling a resurgence in buying pressure.
Current price action is approaching a previous resistance zone, aligned with recent swing highs. The chart suggests a potential consolidation before further upside, provided that the current bullish structure remains intact.
From a macro perspective, while the stronger-than-expected U.S. PMI data supports the USD in the short term, weak labor market figures and ongoing global geopolitical tensions continue to fuel demand for gold as a safe-haven asset. This environment is helping sustain XAUUSD’s current recovery structure.

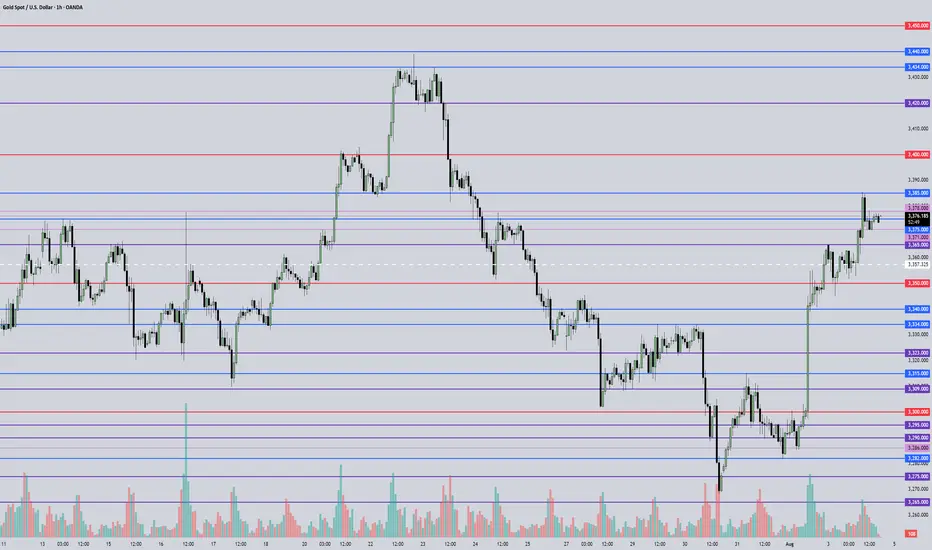
XAUUSD Intraday Signal Analysis – Gold Price Momentum & RSI SetuIn today’s 1-hour chart of XAUUSD (Gold vs USD), we observe a strong upward momentum supported by technical indicators, suggesting a well-defined bullish trend in the short term. Traders looking to capture short-term profits may find this chart setup especially favorable. Here's a breakdown of the price action and what it could mean for intraday traders.
Price Action Overview
The price of gold has surged past the $3,320 mark, showing a clear bullish breakout with a series of higher highs and higher lows. Currently, the market is trading near the $3,378 level, consolidating slightly after a strong upward movement.
The SMA 9 (Simple Moving Average) is providing dynamic support, curving upward and closely hugging the candlesticks. This is typically a sign that buyers are actively pushing the price higher and dips are being bought up quickly.
Additionally, the spread between the Buy ($3,378.78) and Sell ($3,378.51) prices is extremely narrow, suggesting tight liquidity and fast execution potential — ideal conditions for scalpers and short-term traders.
RSI Analysis
The RSI (Relative Strength Index) 14 is hovering around the 68–70 level, which traditionally indicates the asset is approaching overbought territory. However, it hasn’t crossed into the 70+ danger zone yet, which implies there could still be room for further upside.
One key observation is the RSI divergence forming on the right-hand side. While price has been climbing steadily, RSI has started to curve down slightly — this could hint at a minor pullback or consolidation phase before the next big move. Smart traders may consider watching for bullish RSI bounces or hidden divergences before re-entering long trades.
Trade Idea
Trend: Bullish
Support: $3,360 / $3,340
Resistance: $3,400 / $3,420
Signal: Wait for a minor pullback toward the SMA, and look for bullish candlestick confirmation near $3,360 before entering long.
Conclusion
This XAUUSD 1H chart presents a strong case for continued bullish momentum with cautious optimism due to RSI nearing overbought levels. A pullback could offer fresh entry opportunities before a push toward the next resistance zone. Intraday traders and swing traders alike can benefit from closely monitoring price action around the SMA 9 line.

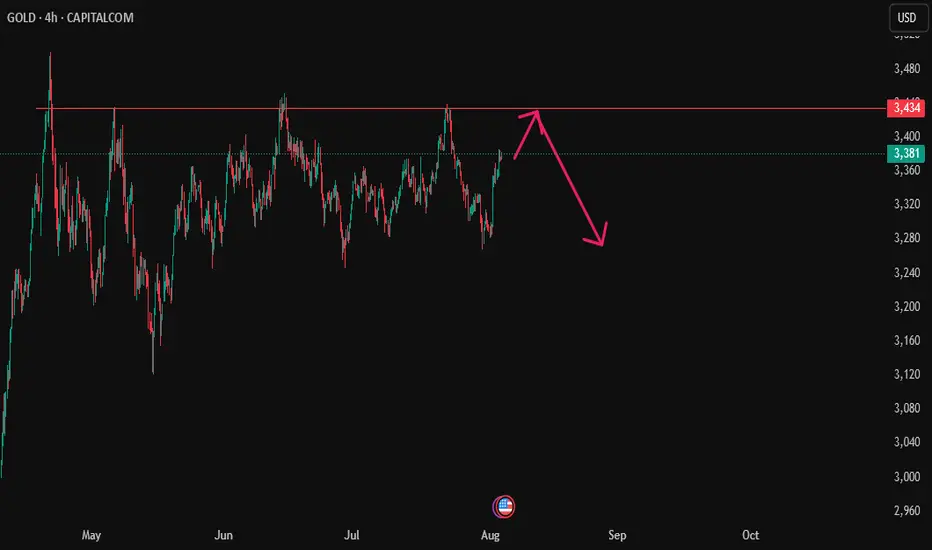
Crude Oil Under Pressure: Production Hike Sparks Bearish Outlook
Following the recent OPEC+ decision to increase oil production by 547,000 barrels per day in September, prices have started to slide-just as anticipated . This surge in supply is reversing years of output cuts and is already weighing heavily on market sentiment.
Technical Setup
• Price action is showing clear signs of weakness post-announcement.
• The red zone on the chart marks a critical support area-any daily close below it could trigger a sharp sell-off.
• Our target is set at $59, aligning with broader market expectations and potential oversupply concerns.
Fundamental Drivers
• The production hike is part of OPEC+'s strategy to reclaim market share.
• Analysts warn of a possible global surplus later this year, especially if demand softens amid economic uncertainty .
• Brent and WTI futures have already dipped, reflecting bearish sentiment across the board
* Trade Strategy
This setup combines technical precision with macro fundamentals. If price breaks below the red zone, it could be the ignition point for a swift move toward $59. Eyes on the close-this could be the moment the bears take control.

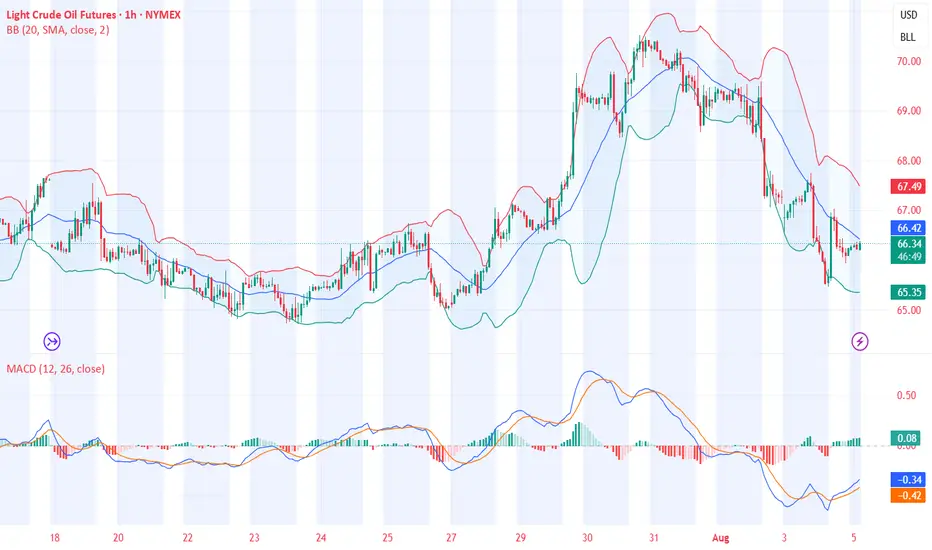
WTI(20250805)Today's AnalysisMarket News:
Goldman Sachs: We expect the Federal Reserve to cut interest rates by 25 basis points three times starting in September; if the unemployment rate rises further, a 50 basis point cut is possible.
Technical Analysis:
Today's Buy/Sell Levels:
65.85
Support/Resistance Levels:
67.97
67.18
66.67
65.04
64.53
63.74
Trading Strategy:
If the market breaks above 65.85, consider buying, with the first target at 66.67. If the market breaks below 65.04, consider selling, with the first target at 64.53.
XAU/USD(20250805) Today's AnalysisMarket News:
Goldman Sachs: We expect the Federal Reserve to cut interest rates by 25 basis points three times starting in September; if the unemployment rate rises further, a 50 basis point cut is possible.
Technical Analysis:
Today's Buy/Sell Levels:
3367
Support and Resistance Levels:
3407
3392
3383
3352
3342
3328
Trading Strategy:
If the stock breaks above 3383, consider buying, with the first target price at 3392. If the stock breaks below 3367, consider selling, with the first target price at 3352.

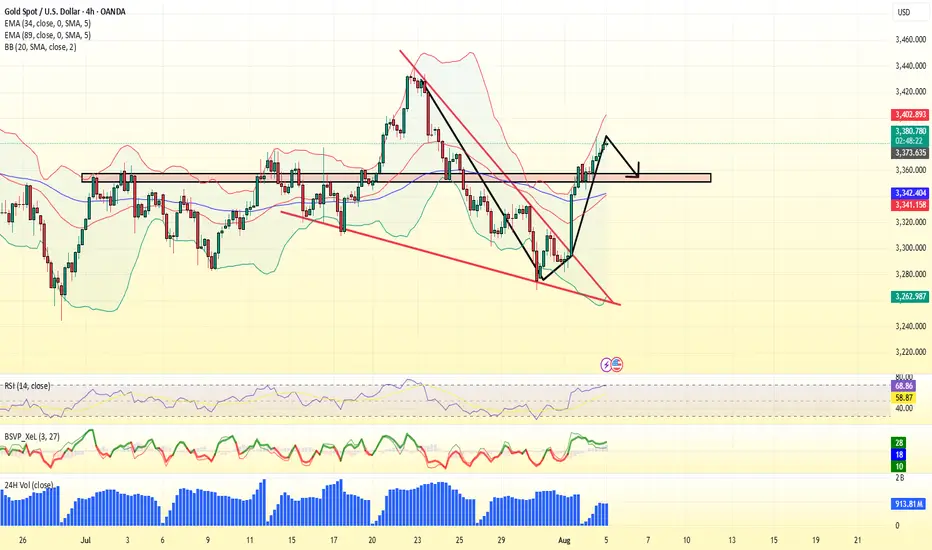
Daily Analysis- XAUUSD (Tuesday, 5th August 2025)Bias: No Bias
Notes:
- No exact bias for today as price sitting at 0.618 fib level
- Looking for liquidity sweep for sell and strong pullback for buy
- Potential BUY/SELL if there's
confirmation on lower timeframe
- Pivot point: -
Disclaimer:
This analysis is from a personal point of view, always conduct on your own research before making any trading decisions as the analysis do not guarantee complete accuracy.

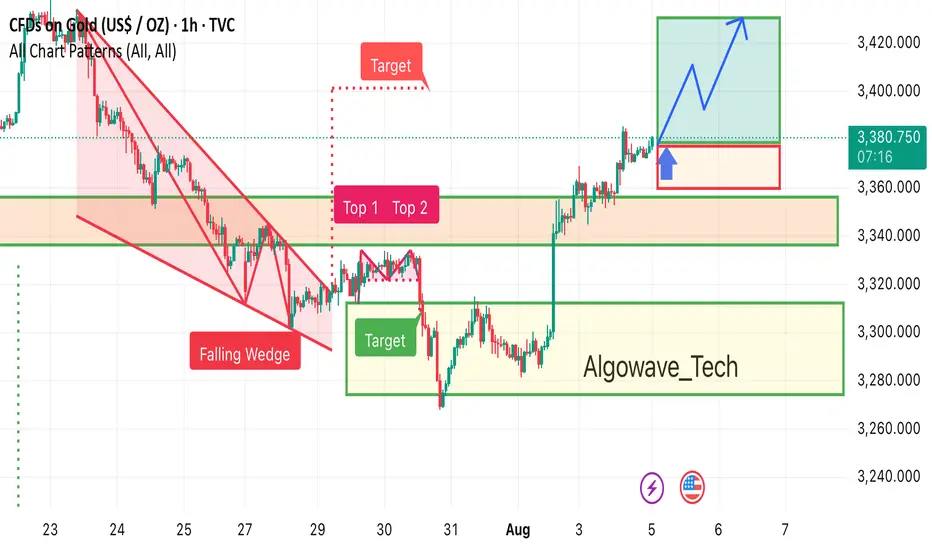
Gold 1h chart pattern Gold has broken out of the falling wedge pattern, showing strong bullish momentum. If price holds above the highlighted support zone, the next potential upside target lies in the 3,425 area. Watching for a healthy retest before continuation.
Day 1 Trading Only S&P Futures — Starting with $200 Profit
Day 1 — Trading Only S&P Futures
Daily P/L:+ 204 :moneybag:
Sleep: 8 hours
Emotions: Tired and sored from muay thai.
:thought_balloon: Today’s Trade thoughts:
I was leaning bearish in the market because we had such strong selling pressure on Friday butonce we broke over the level i posted last week at 6330, I gave up on my bias and I just followed the signals and traded the the X1dd buy signal with @gohawks14 and shorted the Max gamma resistance around 6352 and called a day when i made $200.
I think for this week as we start the trading challenge, I want to have one account where i just make $200 and call it a day so this way i can build consistency and get my trading % up.
:bell:News Highlights:
DOW REBOUNDS NEARLY 600 POINTS, VIX PLUNGES AS U.S. STOCKS END SHARPLY HIGHER ON RATE-CUT OPTIMISM
:bar_chart: VX Algo Signals (9:30am – 2pm EST):
9:00 AM Market Structure flipped bullish on VX Algo X3!
10:10 AM VXAlgo NQ X1 Sell Signal
10:40 AM VXAlgo ES X1 Sell Signal
11:40 AM VXAlgo NQ X1DD Buy Signal (Double buy signal)
11:40 AM VXAlgo ES X1 Buy signal
12:40 PM VXAlgo NQ X1 Sell Signal
1:21 PM VXAlgo ES X1 Sell Signal
2:00 PM VXAlgo ES X3 Sell Signal
:chart_with_upwards_trend: Key Levels for Tomorrow:
Above 6332 = Bullish
Below 6300 = Bearish
:link: Recap & Charts: www.tradingview.com

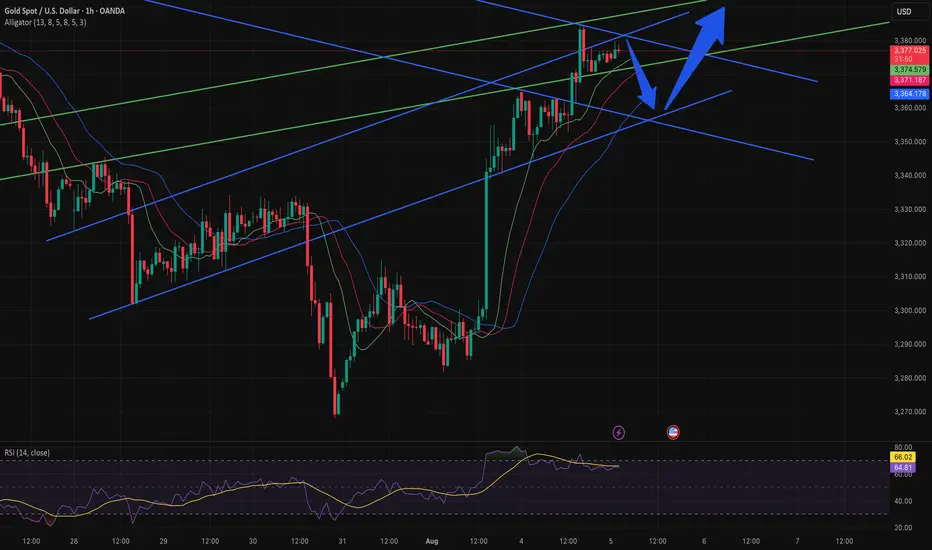
XAUUSD H1 - TRADING I’m quickly analyzing the turquoise trendlines on D1 and the others on H1, and I can determine that there will be a brief short reaction before continuing with the bullish trend.
GOLD H4 | Could the price reverse from here?XAU/USD is reacting off the sell entry at 3,382.85, which is a pullback resistance and could reverse from this level to the take profit.
Stop loss is at 3,432.37, which is a swing high resistance.
Take profit is at 3,333.65, which is a pullback support that is slightly above the 50% Fibonacci retracement.
High Risk Investment Warning
Trading Forex/CFDs on margin carries a high level of risk and may not be suitable for all investors. Leverage can work against you.
Stratos Markets Limited (tradu.com ):
CFDs are complex instruments and come with a high risk of losing money rapidly due to leverage. 65% of retail investor accounts lose money when trading CFDs with this provider. You should consider whether you understand how CFDs work and whether you can afford to take the high risk of losing your money.
Stratos Europe Ltd (tradu.com ):
CFDs are complex instruments and come with a high risk of losing money rapidly due to leverage. 66% of retail investor accounts lose money when trading CFDs with this provider. You should consider whether you understand how CFDs work and whether you can afford to take the high risk of losing your money.
Stratos Global LLC (tradu.com ):
Losses can exceed deposits.
Please be advised that the information presented on TradingView is provided to Tradu (‘Company’, ‘we’) by a third-party provider (‘TFA Global Pte Ltd’). Please be reminded that you are solely responsible for the trading decisions on your account. There is a very high degree of risk involved in trading. Any information and/or content is intended entirely for research, educational and informational purposes only and does not constitute investment or consultation advice or investment strategy. The information is not tailored to the investment needs of any specific person and therefore does not involve a consideration of any of the investment objectives, financial situation or needs of any viewer that may receive it. Kindly also note that past performance is not a reliable indicator of future results. Actual results may differ materially from those anticipated in forward-looking or past performance statements. We assume no liability as to the accuracy or completeness of any of the information and/or content provided herein and the Company cannot be held responsible for any omission, mistake nor for any loss or damage including without limitation to any loss of profit which may arise from reliance on any information supplied by TFA Global Pte Ltd.
The speaker(s) is neither an employee, agent nor representative of Tradu and is therefore acting independently. The opinions given are their own, constitute general market commentary, and do not constitute the opinion or advice of Tradu or any form of personal or investment advice. Tradu neither endorses nor guarantees offerings of third-party speakers, nor is Tradu responsible for the content, veracity or opinions of third-party speakers, presenters or participants.

Gold is in very nice bearish opportunity ahead.Gold is in very nice bearish opportunity ahead. The level of 3000$ should be good for testing as a strong support for a next bull run. My tp now after confirmation is in betwwen a zone 3000-3050$.

Gold is in very nice bearish opportunity ahead.Gold is in very nice bearish opportunity ahead.. After breaking of long period bullish trend line. Gold is now testing The trendline. Just wait on confirmation on higher timeframe and The way down should be opened.

GOLD is Flying High, I won't miss the rocketConfirmation:
If 4H price action closes above Previous Day's High (PDH), I will be looking for longs.
Within my Area of Opportunity (AoO), I have outlined targets with their success rate.

Xauusd shortHigh probability short opportunity has risen on xauusd the reason being that price was consolidating in the rising wedge pattern and it manipulated the upper liquidity of the trend line ,so you may enter at the market price or put order above the current price

Short Idea On LUMBER (LBR1!)Based on :
- Cot Data
- Supply Zone
- Inverted Hammer Candle Confirmation
