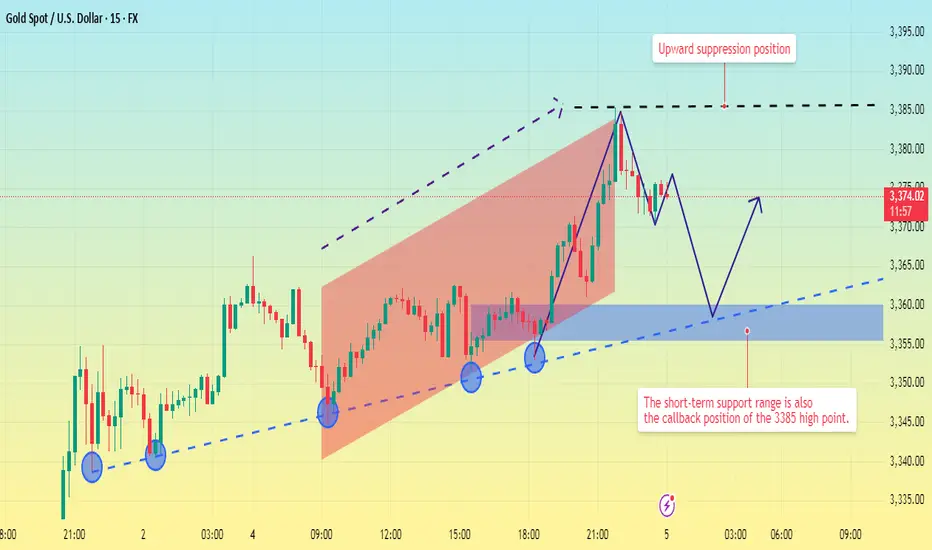
Upward movement suppressed. Price pullback?Gold prices have now perfectly reached the short-selling target range predicted by Quaid.
The current 4-hour chart clearly shows that gold's current resistance level remains around 3385.
Looking at the shorter 15-minute chart, gold has been slowly rising within an upward channel today. The resistance level of 3385 has not been effectively broken, and there is a high probability of a further pullback to test the 15-minute trendline.
Currently, 15-minute trendline support remains around 3355-3360. Focus on this support range in the short term, as it also represents a profit-taking opportunity after shorting at the 3385 high. This level can also be considered a watershed between bulls and bears. If the price pulls back to this level and does not continue to decline, there is a high probability of another upward move at this level.
However, if it falls below the 3350 trendline, the market will enter a downward trend.
Good luck to everyone in the new week.
Futures market
XAUUSD (Gold) Intraday Trading Plan – Tuesday, 5th August 2025Timeframe: M15 (15-Minute)
Strategy Type: Intraday Buy-the-Dip (Scalp-to-Swing)
Market Bias: Bullish
Risk Profile: Short-Term Scalping with Staggered Exits
Execution Style: Multi-phase, Wait-and-Trigger Confirmation Strategy
🧠 Technical Market Overview
Gold remains firmly in a short-term uptrend structure with consistent higher lows and strong buyer momentum since the start of the month. The Asian session on Tuesday is expected to be quieter, creating room for controlled retracements before London and New York bring in volume.
Price is currently trading above key moving averages on the M15 chart (50 EMA and 200 EMA), showing bullish continuation. With market structure respecting rising channel patterns and Fibonacci retracement levels holding well, the day presents a clear opportunity to execute a ladder-style buying plan.
🔍 M15 Intraday Execution Plan
✅ Phase 1: Buy on Retracement to 3366 (Entry Zone)
Entry Zone: Around 3366
Reasoning:
3366 aligns with the 38.2% Fibonacci retracement of the prior M15 leg
A well-established support zone from previous breakout base
Strong volume and wick rejection in this zone from prior session
Confirmation:
Bullish engulfing, pin bar, or strong momentum candle on M15
RSI (14) bouncing above 40
Price rejection from 3365–3367 zone
Stop Loss:
Below 3359 (well below intraday structure)
🎯 Target 1: 3377
Why:
Local resistance from earlier M15 swing highs
Also represents a round number + intraday liquidity zone
High probability zone for first exit or reaction
Action:
Take partial profits (~40%)
Move SL to breakeven or trail below 3369
Wait for market to pull back for re-entry
✅ Phase 2: Wait for Pullback (After 3377 is Hit)
Retracement Zone: 3371–3373 (new higher low formation)
Entry Trigger:
Price consolidates or forms a small flag pattern
Clear bullish momentum on candle breakout
🎯 Target 2: 3387
Why:
Next resistance level based on Monday’s NY session high
Also coincides with extended fib target (1.272 level of 3366–3377 move)
Action:
Secure additional 30% profit
Move SL to 3376
Wait for next consolidation for final trade setup
✅ Phase 3: Final Entry After Consolidation Near 3380–3383
Reasoning:
Micro-pullback to a newly established support before last wave
Continuation pattern or breakout flag expected to form
🎯 Target 3: 3397
Why:
Psychological zone near 3400, commonly tested by algo-driven spikes
Key intraday liquidity magnet where large exits usually occur
Also aligns with the upper edge of projected intraday trend channel
Action:
Close all remaining positions
Watch for reversal signal or potential breakout to plan next session
⚠️ Risk Management Plan
Max exposure: 1–1.5% of capital, split across multiple entries
Each entry must have independent SL and TP
Never average down; add only after successful TP1
Close full position if price breaks below 3359 and closes below 50 EMA on M15
🔁 Summary Table
Phase Buy Level Target SL Action
Phase 1 3366 3377 3359 Take 40%, trail SL
Phase 2 3371–3373 3387 3366 Take 30%, trail SL
Phase 3 3380–3383 3397 3376 Take 30%, full close
📊 Technical Indicators to Support Plan
EMA 50 & EMA 200: Trend direction and pullback support
RSI (14): Momentum confirmation (ideal entry RSI: 40–50 bounce)
Volume Profile: Entry zones should align with HVN (High Volume Nodes)
🧭 Intraday Session Awareness
Asian Session: Look for slow grind or pullback toward 3366
London Open (3pm SG time): Likely volatility spike toward 3377
New York Open (8:30pm SG time): Possible momentum to 3387 or 3397
Avoid Entry During News Spikes: Especially US economic data

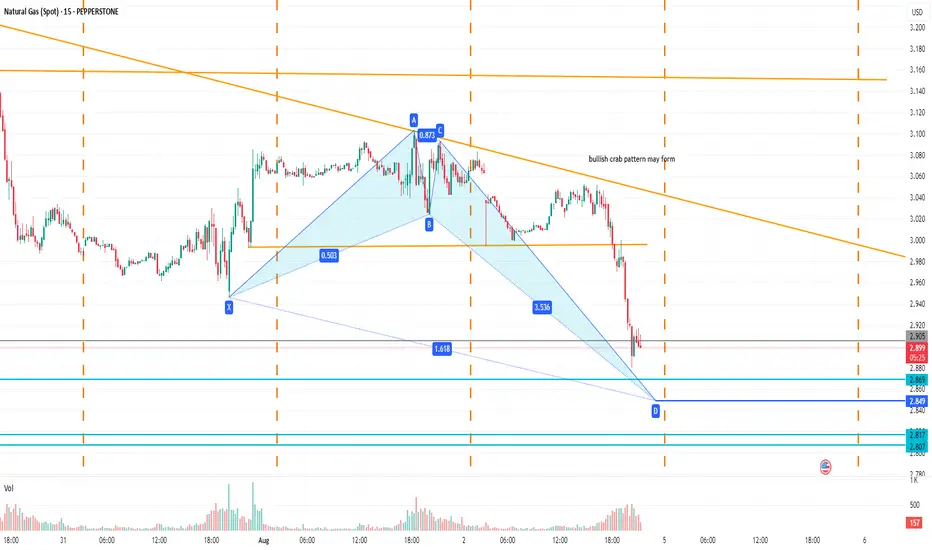
Natural Gas spotBullish Crab pattern may form, but over all sell on rally as ichimoku cloud break in weekly but fallen too much so need to be careful. Level of crab pattern completion spotted in chart.
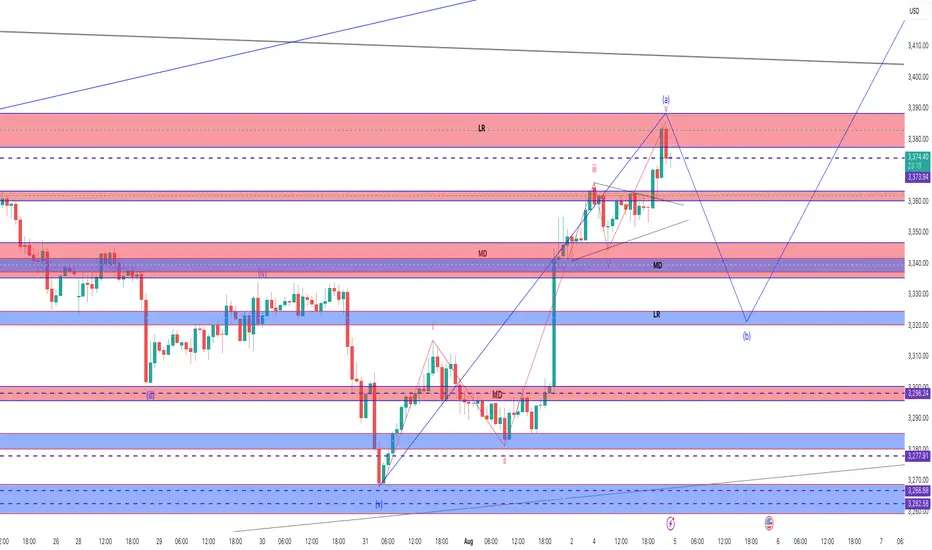
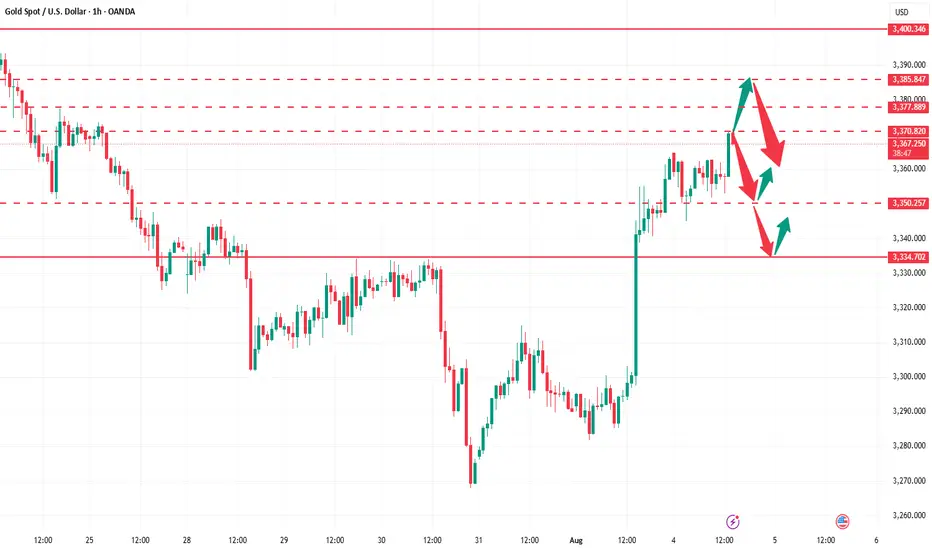
Letting the Pullback Happen – Lining Up for the Next BuyPrice just hit that tough resistance at 3,373–3,380 and started to drop—pretty much what I expected for wave (a) top. Now waiting for a wave (b) pullback. Not chasing here, just being patient.
Game plan:
Waiting for price to drop into the 3,330–3,325 support zone.
If I see a nice bounce or bullish candle in that area, I’ll look to go long.
First target: Back to the 3,373–3,380 resistance. If price smashes through, will hold a small portion for a bigger run.
Stop loss: Just below 3,320 or the latest swing low—keeping it tight.
If price goes lower, next buy zone is 3,298, then 3,278. I’ll repeat the same idea.
If price dumps below 3,262, I’m out. No interest in holding longs if support fails.
4H Gold/USD - Decoding the liquidity zones 📈 Smart Money Concept: Liquidity Grab & Market Shift
This 4H Gold/USD chart shows a classic liquidity sweep below a key level (Sell-side liquidity) followed by a CHoCH (Change of Character) — signaling a bullish market structure shift. A fair value gap (FVG) is formed as price aggressively breaks previous highs, offering a clean entry point on the retest.

HI GUYShere i have a sneak peak of how i think silver has to play out.
i expect sells now, as we form the daily double bottom.
what do u think

Bearish forcast On Naturalgas Keypoints -
1. +48 Bcf EIA storage build beat forecasts and the 5-year average, signaling excess supply
2.U.S. dry gas production hit 108.1 Bcf/day
3.The next major downside level will be at $2.574. With fundamentals pointing to an oversupplied market and only short-term weather demand offering support, near-term sentiment remains bearish.

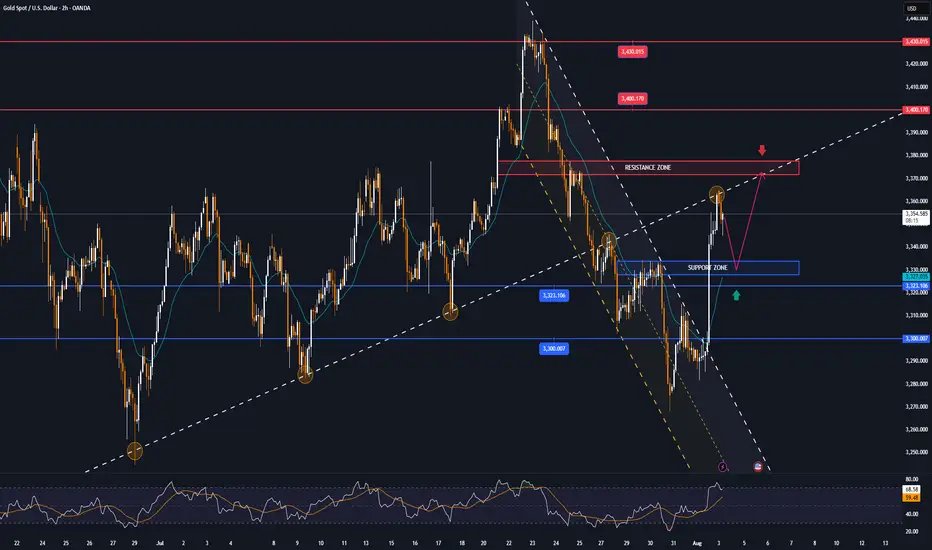
Why do you always miss the real opportunities?Judging from the current gold trend, gold rose to a high of around 3368 and then entered a narrow range of fluctuations. Our previous long plan failed to continue to hold at the high level. Although some brothers may feel regretful, the market is always full of variables. We must flexibly adjust our thinking according to market changes. At present, there is a need for a retracement on the technical side. This retracement is not a trend reversal, but provides space for subsequent bullish momentum. Overall, the bullish trend is still dominant, but the current price is approaching the important pressure area of 3370-3385. The short-term carrying capacity has weakened, and it is not advisable to chase highs blindly. It is recommended to be cautious at high levels in operations. In the short term, it can be given priority to try to intervene with short positions in batches in the 3370-3385 area, waiting for a technical correction. If it subsequently retraces to the key support area of 3350-3335 and stabilizes, you can consider the long position layout again and continue to participate in the main bull trend.
Gold operation suggestion: short in batches in the 3370-3385 area, with the target at 3355-3350. If it falls back to the 3350-3335 area and stabilizes, consider entering a long position at the right time.
GOLD ROUTE MAP UPDATEHey Everyone,
Great start to the week with our chart idea playing out, as analysed.
We got our Bullish target 3370 hit and now waiting for ema5 lock to confirm gap to 3392. Failure to lock will see lower Goldturns tested for suport and bounce, inline with our plans to buy dips.
We will keep the above in mind when taking buys from dips. Our updated levels and weighted levels will allow us to track the movement down and then catch bounces up.
We will continue to buy dips using our support levels taking 20 to 40 pips. As stated before each of our level structures give 20 to 40 pip bounces, which is enough for a nice entry and exit. If you back test the levels we shared every week for the past 24 months, you can see how effectively they were used to trade with or against short/mid term swings and trends.
The swing range give bigger bounces then our weighted levels that's the difference between weighted levels and swing ranges.
BULLISH TARGET
3370 - DONE
EMA5 CROSS AND LOCK ABOVE 3370 WILL OPEN THE FOLLOWING BULLISH TARGETS
3392
EMA5 CROSS AND LOCK ABOVE 3392 WILL OPEN THE FOLLOWING BULLISH TARGET
3416
EMA5 CROSS AND LOCK ABOVE 3416 WILL OPEN THE FOLLOWING BULLISH TARGET
3429
EMA5 CROSS AND LOCK ABOVE 3429 WILL OPEN THE FOLLOWING BULLISH TARGET
3439
BEARISH TARGETS
3348
EMA5 CROSS AND LOCK BELOW 3348 WILL OPEN THE FOLLOWING BEARISH TARGET
3328
EMA5 CROSS AND LOCK BELOW 3328 WILL OPEN THE FOLLOWING BEARISH TARGET
3313
EMA5 CROSS AND LOCK BELOW 3313 WILL OPEN THE SWING RANGE
3296
3281
As always, we will keep you all updated with regular updates throughout the week and how we manage the active ideas and setups. Thank you all for your likes, comments and follows, we really appreciate it!
Mr Gold
GoldViewFX

XAUUSD Technical Analysis – Bullish Continuation SetupXAUUSD Technical Analysis – Bullish Continuation Setup
📊 Market Structure Overview:
The chart shows a clear bullish structure shift, marked by multiple Break of Structure (BOS) events that validate strength from buyers. After forming equal lows and a liquidity sweep at the strong support zone, price has aggressively moved higher, breaking through minor resistance levels and showing clear bullish intent.
🧱 Key Technical Elements:
🔹 1. Strong Support Zone (Demand Rejection)
Price respected the strong demand zone between $3,260 – $3,280, where aggressive buying was seen after forming a bullish engulfing breakout. This zone aligns with previous demand and a major BOS, confirming institutional buying interest.
🔹 2. Bullish Order Flow & Break of Structure (BOS)
Multiple BOS levels across July and early August highlight a sequence of higher highs and higher lows, indicating trend continuation.
The most recent BOS after July 30 shows an impulsive break, confirming bullish dominance and clean order flow.
🔹 3. Fair Value Gaps (FVGs)
Bullish FVG (Mid-July): Price respected and bounced from this zone, showing previous imbalance was filled and used as a base for continuation.
New FVG (Above $3,420): The current upside target lies within this area, acting as a magnet for price due to unfilled orders.
🔹 4. Buy-Side Liquidity & Target Zone
The market is approaching a buy-side liquidity zone around $3,385, a key short-term target where previous highs and stop orders are likely pooled.
If liquidity above $3,385 is taken efficiently, price may expand into the FVG zone between $3,420 – $3,460.
🔹 5. Bullish Confirmation & Momentum
The candle structure shows a clean bullish impulsive move, followed by minor consolidation—likely a bullish flag/pennant indicating potential for further continuation.
Momentum is favoring buyers, and short-term consolidation above $3,340 is healthy for continuation.
🔐 Liquidity & Institutional Narrative
Equal Lows (EQL) and FVG fills suggest prior liquidity was swept and used to fuel institutional long positions.
The recent BOS confirmed that smart money has shifted bias toward longs, and price is now targeting remaining inefficiencies to the upside.
The clear alignment of BOS, liquidity sweep, and bullish FVGs reinforces a strong institutional footprint on this move.
🔍 Key Levels to Watch:
Level Type Price Zone (USD)
🔺 Resistance / FVG 3,420 – 3,460
🎯 Immediate Target 3,385
📉 Short-Term Support 3,340 – 3,320
🛡️ Major Demand Zone 3,260 – 3,280
📌 Conclusion & Outlook:
XAUUSD has initiated a strong bullish leg from the demand zone, confirming accumulation and structural reversal. Price is now moving toward the buy-side liquidity target of $3,385, with potential continuation toward the FVG resistance zone of $3,420–$3,460.
As long as price remains above the $3,320 structure support, the bullish bias remains intact. Any pullbacks should be seen as buying opportunities, especially on lower timeframe confirmations.

XAUUSDXAUUSD longterm its going to 5K
Short/midterm its going to 3500
H4 still on a consolidation.
The best thing to do is to wait for the end of the summer.

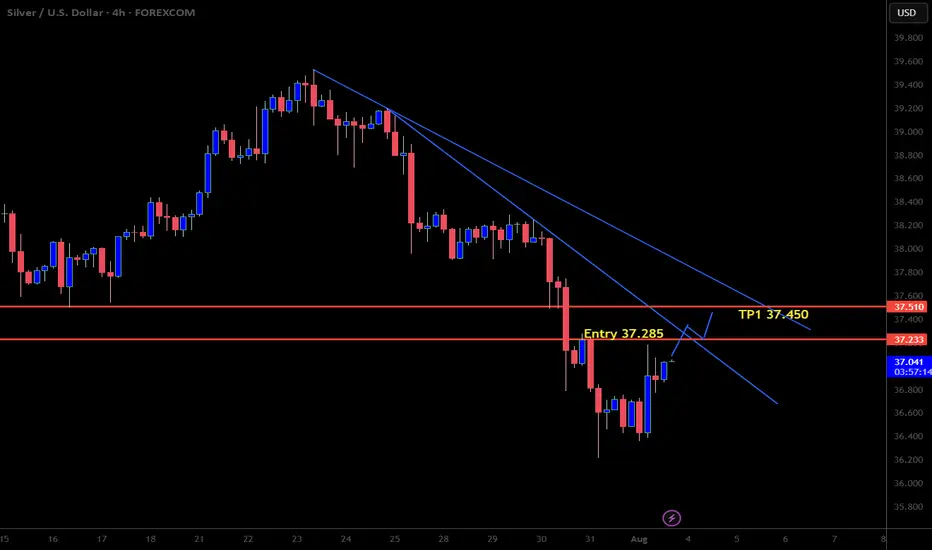
Bullish move on SilverWe have to be a little patient with this trade. I'm looking to buy XAGUSD once we get a close above 37.285 on an H4 timeframe. Should be a nice trade for the week. Happy Trading!!
U.S. Natural Gas Poised for Rebound After Steep July DropU.S. natural gas prices sank in July due to mild weather, strong supply, and LNG export disruptions. The EIA cut its price outlook but expects a recovery by winter.
While technicals hint at a short-term rebound, oversupply and weak summer demand keep pressure on prices. A sustained recovery depends on tighter balances and rising LNG flows.
MILD WEATHER AND STRONG SUPPLY DRAGGED U.S. NAT-GAS PRICES
CME Henry Hub Natural Gas Futures fell 10.1% in July, marking the steepest monthly decline since April (-19.3%). For the week ending 25/Jul, prices dropped 12.8%, marking the sharpest weekly fall since the week ending 31/Jan (-24.4%).
The selloff was fuelled by milder-than-expected summer weather, robust production, reduced LNG exports, and strong storage builds. July typically sees lower U.S. gas demand compared to the winter months, and in 2025, cooler conditions curbed electricity use for air conditioning, softening demand for gas-fired power generation.
Meanwhile, U.S. natural gas output remained robust through H1 2025, with supply growth outpacing consumption.
With production still high and power sector demand underwhelming, the EIA expects prices to remain under pressure until the winter withdrawal season (November to March).
LNG EXPORT DISRUPTIONS DEEPEN PRESSURE ON U.S. GAS PRICES AMID STRONG SUPPLY
U.S. LNG export flows declined in July 2025, primarily due to maintenance and operational delays at major terminals. These disruptions significantly reduced gas deliveries to export facilities, limiting outbound volumes despite the U.S. maintaining ample export capacity.
At the same time, domestic natural gas supply continued to rise. According to S&P Global , for the week ending 30/Jul, total supply increased by 0.2% week-over-week. While modest, this supply growth added to an already well-supplied market.
The reduced export activity amplified the bearish impact of weak summer demand, contributing to the sharp price decline seen in July.
RISING U.S. GAS INVENTORIES ADD PRESSURE AS PRODUCTION OUTPACES DEMAND
Another drag on prices has been the steady build-up in U.S. natural gas inventories in recent weeks, driven largely by increased domestic production.
Source: EIA
As of the week ending 25/Jul, U.S. natural gas inventories are 6.7% above the five-year average (2020–2024) despite ending the previous withdrawal season 4% below the five-year average, the lowest in three years.
Source: EIA
Injections have exceeded the five-year average as U.S. natural gas production has increased in Q2 2025 compared with Q1 2025.
The EIA expects inventories to end the injection season on 31/Oct with 3,910 Bcf of natural gas in storage, 5% more than the forecast it made previously and 3% more than the five-year average.
EIA LOWERS GAS OUTLOOK BUT STILL EXPECTS A REBOUND IN PRICES
The EIA has revised its natural gas price outlook downward in its latest Short-Term Energy Outlook (STEO), citing stronger-than-expected storage builds. The agency now forecasts Henry Hub prices to average USD 3.67/MMBtu in 2024 (down 8.7%) and USD 4.41/MMBtu in 2025 (down 9.6%) compared to the previous month’s estimates.
Source: EIA STEO
Despite the lower near-term outlook, the EIA still sees prices gradually rising from Q3 2025 through Q1 2026. As maintenance at major LNG export facilities concludes, export volumes are expected to recover, helping to absorb excess supply.
Additionally, structural demand from Europe remains strong. The EU has committed to purchasing USD 750 billion worth of energy—including LNG, crude oil, and nuclear fuels- from the U.S. over the next three years.
BEARISH PRESSURE PERSISTS, BUT TECHNICAL INDICATORS HINT AT REBOUND
Henry Hub has traded below its 9-day and 21-day moving averages since 21/Jul, signalling sustained bearish pressure.
On 01/Aug, it showed signs of breaking above the 9-day average, hinting at a potential shift.
RSI and MACD indicators are suggesting fading bearish momentum for Henry Hub, pointing to a potential short-term price rebound.
HYPOTHETICAL TRADE SETUP
Henry Hub prices saw a steep monthly drop in July, weighed down by multiple factors mentioned above. However, several signs point to a potential rebound.
Despite the recent slide, technical indicators like RSI and MACD suggest fading bearish momentum.
With bearish drivers priced in and both technical and fundamental signals hinting at stabilization or a short-term bounce, traders may consider going long CME Micro Henry Hub Natural Gas Futures.
These contracts, sized at 1/10th of the standard futures, offer efficient capital deployment and precise risk control, making them ideal for expressing directional views or scaling into a larger position as confirmation builds.
This paper posits a long position in CME Micro Henry Hub Natural Gas Futures (Sep 2025) expiring on 26/Aug (MNGU2025) with the following trade setup:
• Entry: 3.10/MMBtu
• Target: 3.46/barrel
• Stop: 2.86/barrel
• P&L at Target (per lot): +360 ((3.46 – 3.10) x 1,000)
• P&L at Stop (per lot): -240 ((3.10– 2.86) x 1,000)
• Reward-to-Risk Ratio: 1.5x
The same view can be expressed using standard CME Natural Gas futures, which offer 10x larger notional sizes and deep liquidity.
MARKET DATA
CME Real-time Market Data helps identify trading set-ups and express market views better. If you have futures in your trading portfolio, you can check out on CME Group data plans available that suit your trading needs tradingview.com/cme .
DISCLAIMER
This case study is for educational purposes only and does not constitute investment recommendations or advice. Nor are they used to promote any specific products, or services.
Trading or investment ideas cited here are for illustration only, as an integral part of a case study to demonstrate the fundamental concepts in risk management or trading under the market scenarios being discussed. Please read the FULL DISCLAIMER the link to which is provided in our profile description.

XAUUSD SHORTElite analysis
Price took out liquidity at the top
Price is confirming change of direction
Executed in lower time frame
Targeting lower liquidity pools

XAG/USD Long Setup | H1 TimeframeA classic setup based on #SmartMoneyConcepts:
✅ Change of Character (CHOCH) after a liquidity sweep.
✅ Price returned to the Order Block & filled the FVG.
✅ Entry at the Point of Interest (POI) with a high R/R.
Waiting for it to reach the buy-side liquidity targets. Do you agree?

After data shock, GOLD has bullish conditions againOANDA:XAUUSD rose more than 2% on Friday, hitting a one-week high, as weaker-than-expected U.S. non-farm payrolls data boosted hopes of a Federal Reserve rate cut and the announcement of new tariffs boosted safe-haven demand.
On the economic data front
Gold prices rose more than 2% in U.S. trading on Friday (Aug. 1), hitting a one-week high, as weaker-than-expected U.S. non-farm payrolls data fueled hopes of a Federal Reserve rate cut and safe-haven demand was boosted by the announcement of new tariffs.
The U.S. Department of Labor's Bureau of Labor Statistics reported that nonfarm payrolls increased by just 73,000 jobs in July, well below market expectations of 110,000. June's data was revised down to just 14,000, indicating a significant slowdown in job growth. The unemployment rate rose to 4.2%, indicating a cooling labor market.
The jobs data was weaker than expected, but slightly higher than the market's lowest forecast. This increases the likelihood of a rate cut by the Fed later this year. As a non-yielding asset, gold typically performs better in a low-interest-rate environment.
According to CME Group's FedWatch tool, market participants now expect the Federal Reserve to cut rates twice before the end of the year, starting in September. Earlier this week, the Fed held rates steady at 4.25%-4.50%. Chairman Powell said it was too early to determine whether a rate cut would be forthcoming in September, citing inflation and employment data.
On the trade front
Trump has imposed a new round of tariffs on exports from dozens of trading partners, including Canada, Brazil, India and Taiwan, causing a global market crash.
Countries are scrambling to negotiate a better deal. In times of economic and geopolitical uncertainty, safe-haven gold is in high demand.
So far in 2025, gold prices have risen more than $400, hitting a record high of $3,167.57/oz on April 3, driven by safe-haven demand and central bank buying.
Weak jobs data also sent the dollar lower against major currencies, further supporting gold prices as a weaker greenback makes gold more attractive to investors holding other currencies.
Investors' Attention Turns to September FOMC Meeting
Markets are now focused on the September Federal Open Market Committee (FOMC) meeting. Facing the dual pressures of volatile inflation, slowing employment and escalating global trade tensions, the Fed will have to balance its inflation target with economic growth.
Markets are betting on the Fed to begin a new round of easing, and gold, as a hedge against currency devaluation and economic uncertainty, is expected to continue to benefit.
Gold prices have risen more than 30% year-to-date, reflecting the market’s preference for safe-haven assets. If weak U.S. economic data continues in the coming weeks, or if new geopolitical conflicts emerge, gold prices are expected to continue their upward trend, challenging new highs for the year.
Summary, Commentary
Weak employment, new tariffs and a slumping stock market have all contributed to a strong recovery in gold prices. With the possibility of the US Federal Reserve cutting interest rates in September increasing significantly, gold market sentiment has warmed and risk aversion has returned.
Investors will need to keep a close eye on inflation data, Fed officials’ speeches, and whether Trump continues to stoke trade tensions, which could lead to greater volatility in the gold market.
Against the backdrop of the unexpected non-farm payrolls report and moderate inflation, the market has essentially “locked in” the possibility of a rate cut in September, but whether the cut will be 25 or 50 basis points, and whether there will be further rate cuts in the future, will depend on the interaction between the Fed members’ verbal guidance and market expectations.
Technical Outlook Analysis OANDA:XAUUSD
On the daily chart, affected by the sudden weak data that shocked the market, gold broke most of the technical structure that was leaning towards the downside. Price action was pushed above the EMA21, while the short-term downtrend channel was also broken above and the Relative Strength Index crossed above 50.
These are the initial conditions for a short-term uptrend. But to confirm an uptrend and a new uptrend in the near term, gold needs to continue to break above the 0.236% Fibonacci retracement level (3,371 USD) first, then the target will be around 3,400 USD in the short term.
If gold breaks above $3,400 again, traders should set a new target of $3,430 in the short term, rather than $3,450 which is the all-time high.
Motivationally, the RSI has not reached oversold territory to provide pure reversal support, but it has been pushed by the market shock after the NFP data release, so this rally may not be sustainable in a purely motivational way either.
Overall, gold is now more bullish after a rally on Friday, opening up initial conditions for expectations of a new uptrend. And the notable points will be listed as follows.
Support: 3,323 – 3,310 – 3,300 USD
Resistance: 3,371 – 3,400 – 3,430 USD
SELL XAUUSD PRICE 3376 - 3374⚡️
↠↠ Stop Loss 3380
→Take Profit 1 3368
↨
→Take Profit 2 3362
BUY XAUUSD PRICE 3327 - 3329⚡️
↠↠ Stop Loss 3323
→Take Profit 1 3335
↨
→Take Profit 2 3341