GOLD 4H CHART ROUTE MAP UPDATE & TRADING PLAN FOR THE WEEKHey Everyone,
Please see our 4h chart route map and trading plan for the week ahead.
We are now seeing price play between two weighted levels with a gap above at 4381 and a gap below at 4303. We will need to see ema5 cross and lock on either weighted level to determine the next range.
We will see levels tested side by side until one of the weighted levels break and lock to confirm direction for the next range.
We will keep the above in mind when taking buys from dips. Our updated levels and weighted levels will allow us to track the movement down and then catch bounces up.
We will continue to buy dips using our support levels taking 20 to 40 pips. As stated before each of our level structures give 20 to 40 pip bounces, which is enough for a nice entry and exit. If you back test the levels we shared every week for the past 24 months, you can see how effectively they were used to trade with or against short/mid term swings and trends.
The swing range give bigger bounces then our weighted levels that's the difference between weighted levels and swing ranges.
BULLISH TARGET
4381
EMA5 CROSS AND LOCK ABOVE 4381 WILL OPEN THE FOLLOWING BULLISH TARGET
4459
BEARISH TARGET
4303
EMA5 CROSS AND LOCK BELOW 4303 WILL OPEN THE FOLLOWING BEARISH TARGET
4222
EMA5 CROSS AND LOCK BELOW 4222 WILL OPEN THE SWING RANGE
4130
4042
EMA5 CROSS AND LOCK BELOW 4042 WILL OPEN THE SECONDARY SWING RANGE
3964
3873
As always, we will keep you all updated with regular updates throughout the week and how we manage the active ideas and setups. Thank you all for your likes, comments and follows, we really appreciate it!
Mr Gold
GoldViewFX
Futures market

Gold (XAUUSD) - Range High Liquidity & Potential Reversal SetupGold (XAUUSD) 30-Minute Chart – Range High Liquidity & Potential Reversal Setup
Technical Analysis
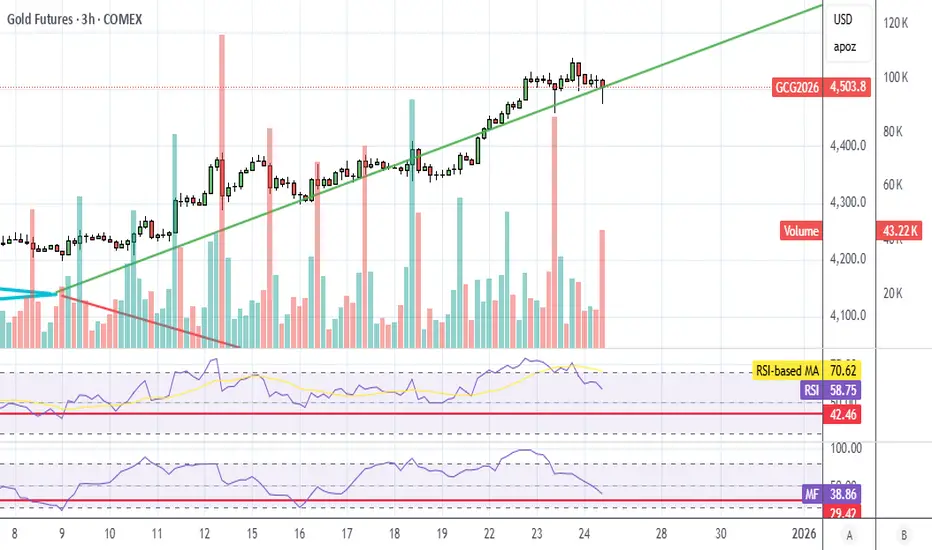
Gold on the 30-minute timeframe is currently trading in a well-defined range, with price repeatedly reacting around a major horizontal resistance zone near 4498–4500. This level has been tested multiple times, clearly acting as a liquidity pool, where smart money is distributing positions.
Each touch of this zone is marked by rejection candles and wicks, indicating selling pressure and the presence of strong institutional orders. The repeated failures to break and hold above this level suggest that buyers are struggling to gain control.
Key Resistance – Major Supply Zone
The highlighted horizontal line is a major resistance / supply area.
Multiple equal highs (liquidity grabs) are visible.
Price keeps returning to this zone but fails to close strongly above it.
This behavior often precedes either:
A fake breakout, or
A sharp rejection leading to a deeper pullback
This zone is labeled “Major” for a reason — it is not a random level.
Reversal Zone & Volume Perspective
Below current price, we can clearly see a marked Reversal Zone, backed by:
Previous strong bullish impulse
Large-bodied candles (volume burst area)
Unfilled institutional orders (demand imbalance)
This green box represents an area where:
Smart money previously entered aggressively
Price may return to rebalance inefficiency
A reaction from this zone is highly probable, especially if price breaks the minor structure support above it.
Current Price Behavior – Waiting for Confirmation
At the moment:
Price is compressing below resistance
Volatility is decreasing
Market is indecisive
This is NOT a chase trade.
As highlighted on the chart:
➡️ “Need Pattern”
We wait for confirmation such as:
Bearish engulfing
Break and retest of minor support
Strong rejection wick at resistance
Volume expansion on downside
Patience here protects capital.
Projected Scenarios
Scenario 1 – Bearish Rejection (Higher Probability)
Price rejects from the major resistance
Breaks intraday support
Moves into the reversal + volume zone
Possible bounce or consolidation from that area
Scenario 2 – Liquidity Grab & Continuation
A short spike above resistance (fake breakout)
Immediate rejection
Strong bearish move afterward
Scenario 3 – Clean Breakout (Lower Probability)
Strong 30m close above resistance
Acceptance above 4500
Retest and continuation to higher levels
Trading Mindset
This is a location-based setup, not a prediction.
Let the market show its hand
Trade reaction, not anticipation
Confirmation > Emotion
High-probability trades are built on patience, structure, and volume, not speed.
Conclusion
Gold is currently sitting at a critical decision zone. The chart shows clear institutional footprints, strong resistance, and a well-defined downside target area. Traders should stay disciplined and wait for price action confirmation before entering any position.

Be wary of a gold sell-off; avoid chasing highs.With the Christmas holidays approaching, gold trading will cease in two hours, and the market will be closed tomorrow. Today, we accurately captured gold market dynamics, recommending a long position near 4475, which rebounded as expected to around 4496.
Gold jumped to a new high of $4526 during the Asian session before retreating, currently trading significantly lower at $4460. This is attributed to pre-Christmas selling pressure.
On the news front, Japan's proposed significant reduction in the issuance of ultra-long-term government bonds is prompting global capital to reconsider its safe-haven asset allocation. Potential fluctuations in the yen's exchange rate may indirectly impact the gold market. Coupled with the recent continued volatility in US Treasury yields, the probability of unusual fund flows during European and American trading sessions is increased, easily triggering a sudden sell-off. The current market is characterized by intense bullish and bearish competition, and fragmented news can amplify market fluctuations. It is crucial to combine technical signals with calm judgment to avoid being misled by short-term noise.
From a technical perspective, spot gold touched a high of 4525 during the day before fluctuating downwards. The 5-minute candlestick chart shows a clear downward trend, with the current price at 4460, below the intraday trading range's middle band. The 4500-4510 range forms a strong short-term resistance zone, and given the weak rebound, the probability of a further downward move continues to rise. The intraday low of 4448 is the first support level; a break below this level could lead to tests of even lower support zones, indicating continued short-term bearish momentum.
Trading Strategy: Sell gold at the resistance level of 4490-4505 and buy gold near the support level of 4440-50. Although the market is currently under short-term selling pressure, the overall upward trend remains strong, and the current large-range consolidation provides favorable conditions for trading.

4Hr bullish divergence shows consolidation is comingThis chart has been showing hidden bullish divergence on the RSI and every time price action "shakes" this silver will start a consolidation refer to yellow circle on left side. Now we watch the right side circle and if we print a higher high with RSI AND price action then we will enter a short consolidation.

USOIL – TFOTechnical:
Price is rebounding from the 55–56 demand zone and currently trades near 58.30. Structure remains range-bound, capped below the 61–62 resistance. As long as price stays below that level, upside looks corrective. A rejection near 60–61 favors continuation back toward 57. A break and hold above 62 would open room toward 65–66.
Fundamental:
Oil remains pressured by global demand concerns and expectations of ample supply. OPEC+ headlines and US inventory data remain key catalysts. Upside is limited unless demand expectations improve or supply risks re-emerge; otherwise, consolidation dominates.

XAUUSD – Squeeze Before the MoveGold is currently trading inside a symmetrical triangle, showing clear price compression between descending trendline resistance and ascending trendline support. This structure suggests a strong breakout is approaching.
Earlier price action showed multiple CHoCH (Change of Character), confirming a shift in short-term market structure, followed by a BOS (Break of Structure) that led into consolidation rather than continuation — a sign of indecision and liquidity building.
Key Levels & Scenarios:
🔼 Bullish Scenario:
A clean breakout and close above triangle resistance opens the path toward the weak high, with upside continuation expected after a minor pullback.
🔽 Bearish Scenario:
A breakdown below triangle support would confirm bearish intent, targeting lower liquidity and prior demand levels.
Bias: Neutral until breakout
Strategy: Wait for confirmation (break & retest) before entry
Market Condition: Volatility expansion expected
⚠️ Patience is key — let price reveal direction

Gold New Highs?The chart is clear!
If gold breaks the triangle to the upside, then we have the potential to soar even higher and reach new highs.
It may also fill the triangle before launching to space :)
This is for training purposes only.
Trade at your own risk.
Good Luck
Nshan

XAGUSDMarket Structure
Strong bullish impulse followed by range consolidation.
Price action fits a Wyckoff re-accumulation structure after the markup phase.
The recent sharp drop looks like a sell-side liquidity sweep, not a trend reversal.
Key Levels
Range high / resistance:
72.20 – 72.40
Range mid:
71.60 – 71.80
Demand / buy-side liquidity:
70.80 – 70.50 (highlighted demand zone)
Invalidation:
Below 70.00
Price Action & Liquidity
The impulsive drop into 70.8–70.5 swept sell-side liquidity.
Strong reaction from the demand zone confirms buyers defending.
As long as price holds above 70.00, bullish structure remains valid.
Likely path: spring → consolidation → markup.

NASDAQ: Bring On The Santa Rally! Short Term Buys!Welcome back to the Weekly Forex Forecast for the week of Dec. 22-26th.
In this video, we will analyze the following FX market: NASDAQ (NQ1!) NAS100
The NASDAQ is reaching towards the relative equal highs, and maybe with the help of a
Santa Rally, it gets their!
I like the fact that the market closed the last two days of last week with bullish candles. I expect to see some follow through into early next week.
Enjoy!
May profits be upon you.
Leave any questions or comments in the comment section.
I appreciate any feedback from my viewers!
Like and/or subscribe if you want more accurate analysis.
Thank you so much!
Disclaimer:
I do not provide personal investment advice and I am not a qualified licensed investment advisor.
All information found here, including any ideas, opinions, views, predictions, forecasts, commentaries, suggestions, expressed or implied herein, are for informational, entertainment or educational purposes only and should not be construed as personal investment advice. While the information provided is believed to be accurate, it may include errors or inaccuracies.
I will not and cannot be held liable for any actions you take as a result of anything you read here.
Conduct your own due diligence, or consult a licensed financial advisor or broker before making any and all investment decisions. Any investments, trades, speculations, or decisions made on the basis of any information found on this channel, expressed or implied herein, are committed at your own risk, financial or otherwise.

XAUUSD(GOLD): Two Entries Both Has Equal Swing Buy PotentialDear Traders,
Buying Setup For OANDA:XAUUSD Based On SMC+ICT Strategy📈
🔺Gold has two potential buying areas. The first is a risky zone where the price may continue its bullish move but also has a risk of bears withdrawing liquidity from the entry area.
🔺Second Entry is more suitable for most types of traders however, due to manipulation in the market we could see early mitigation in the price, which could ultimately invalidating our second entry zone.
Which entry is suitable for you?💭
🔺For most traders, the initial entry can be beneficial although it is inherently risky. In gold trading, risk is always present but it can also lead to greater rewards. Traders may consider entering both with smaller lot sizes and well-thought-out risk management strategies.
🔺Place stop-loss and take-profit orders based on your own assessment of the market as this is a personal decision for each individual or retail trader.
If you like our work then please like and comment on our ideas which will encourage us to post such more analysis. As always follow us to get the most up to date trade ideas.
Team Setupsfx_❤️🏆

Gold Trade Plan 24/12/2025Dear Traders,
XAUUSD (Gold) Technical Analysis – 30-Minute Timeframe
📅 December 24, 2025
Market Structure
The short-term trend is bullish.
Price is moving inside a well-defined ascending channel (blue lines).
A rising trendline (black) is acting as a dynamic support.
Key Levels
Major Support Zone:
Highlighted blue box around 4450 – 4460
This zone represents:
Lower boundary of the ascending channel
Strong horizontal support
Previous reaction area
Resistance Levels:
Minor resistance: 4500 – 4510
Major resistance: 4550 – 4560 (upper boundary of the channel)
Possible Scenarios
🔹 Bullish Scenario (Primary Scenario)
Price pulls back toward the 4450–4460 support zone
Support holds and a bullish reversal candle forms (Pin bar / Engulfing)
Price resumes upward movement toward:
Target 1: 4510
Target 2: 4550 – 4560 (channel high)
📌 This scenario aligns with the overall bullish market structure and has a higher probability.
🔹 Deeper Correction Scenario (Less Likely)
A strong breakdown below 4460 with candle close
Price exits the ascending channel
Further downside correction (not confirmed yet)
Trading Summary
Market Bias: Buy on dips
Best opportunities:
Long entries near channel support
Short positions only if:
Support breaks clearly, or
Strong rejection appears at channel resistance with confirmation
Regards,
Alireza!

GOLD is bullish now & many Traders don't see it !!!The price on the 4h timeframe is within an ascending triangle, which can be promising. If the price breaks this pattern with bullish candles, it could easily rise by the distance of AB=CD.


XAUUSD: This Is a Breakout PreparationXAUUSD – 1H |
Structure: Strong impulsive rally followed by bullish consolidation below previous high → classic continuation pattern.
Key Zone: Former resistance ~4,350–4,380 flipped into strong support. Price keeps respecting this base.
Momentum: Higher highs & higher lows intact → buyers still in control. No distribution signal yet.
Next Objective: Clean continuation opens the path toward 4,700 (new ATH projection).
Macro Drivers (Supporting the Move):
Fed rate-cut expectations in 2025 keep real yields pressured.
USD lacks strong upside momentum, reducing headwinds for gold.
Ongoing geopolitical & fiscal uncertainty sustains safe-haven demand.
➡️ Bias: Bullish continuation. Pullbacks into support are buy-the-dip, not reversal signals

XAUUSD - Gold has reached its ceiling?!Gold is trading above the EMA200 and EMA50 on the 4-hour timeframe and is trading in its ascending channel. A reduction in the upward momentum and a correction towards the demand range will provide us with a better risk-reward buying position.
On December 10, the Federal Reserve surprised financial markets when it announced that **just two days after halting its balance sheet runoff**, it would resume **expanding its balance sheet starting December 12**. At first glance, this swift reversal appeared to signal a return to accommodative monetary policies, but a closer examination reveals that **its nature and scale differ meaningfully from past experiences**.
Although the move came earlier and with greater force than markets had anticipated, it should not be interpreted as the **start of a new round of quantitative easing (QE)**. During the 2008 global financial crisis and again amid the COVID-19 shock in March 2020, the Federal Reserve injected massive liquidity into the financial system through **large-scale purchases of long-term government bonds**. Those programs were designed to **push down bond yields, ease financial stress, and directly support economic activity**.
What is unfolding today is fundamentally different. This time, **liquidity injections are primarily being conducted via short-term securities**, and, crucially, there is no expectation that **the size of the Fed’s balance sheet will increase relative to GDP**—a key distinction from traditional QE episodes.
In reality, recent decisions more closely resemble the events that followed the **repo market turmoil of September 2019**. At that time, the Federal Reserve misjudged the impact of new liquidity regulations on banks’ demand for central bank reserves and allowed **balance sheet reduction (QT)** to continue for too long. As a result, **excess reserves fell to levels insufficient to meet liquidity needs during critical moments**, triggering a sharp spike in short-term interest rates and ultimately forcing an **emergency intervention by the central bank**.
While markets typically enter a quieter phase ahead of year-end holidays, certain **geopolitical risks** have the potential to disrupt this seasonal calm. One of the most prominent risks is the **escalation of tensions between the United States and Venezuela**. In recent days, Donald Trump has repeatedly warned about **expanding military actions against drug trafficking networks**, even floating the possibility of shifting operations from maritime routes onto Venezuelan territory—a scenario that could rapidly intensify tensions.
Along these lines, the United States has effectively imposed a **de facto blockade on sanctioned oil tankers** over the past week, restricting their movement to and from Venezuela. Should Trump decide to further escalate pressure on the government of **Nicolás Maduro**, the likelihood of a meaningful market reaction would rise considerably. Such a scenario could initially **support oil prices** and, to a lesser extent, **drive safe-haven flows toward gold**.

Gold Long ICT This is an analysis of gold using the three phases of the market: accumulation, manipulation (fakeout), and distribution.
The entry is based on the 15-minute Fair Value Gap (FVG) created by strong buying pressure that produced a Market Structure Shift (MSS).
This trade offers an attractive 1:4 risk-to-reward ratio.
The overall setup is supported by gold’s strong bullish bias and the consistent formation of new all-time highs (ATHs).

XAUUSD: Long from SupportI view the current price action as a deviation within a defined value range.
At current levels, XAUUSD is trading at a Discount, presenting a high-probability opportunity to revert to the mean/ Trend.
Current State: Price has reached my predicted Dip within the structure.
Trigger : Rejection from the zone suggests the market recognizes this area as .
Strategy : I am entering a Long position to capture the move back toward the other side of the value range.
Trade Parameters (1:3 RR) This setup meets my strict risk management criteria aimed at asymmetric returns.

SELL GOLDIn todays session we are ,omitoring GOLD for shorts. I know it has wrecked sellers but we are in major squeeze to the upside.Ou short entry is at 4412 stops above 4452 and targets bewlo 4181. First sign of the drop is LODNON IS BEARISH, NEW YORK IS BEARISH. Keep it locked and enjoy the holidays.
Always risk what you can afford to loose.

Gold V Diamond?
Hi
My 2c POV
Gold yesterday felt over heated. With formation of Diamond.
I uptrend if this is found, time for reversal. I think on daily it's called a Doji.
At closing, price tested. Diamond breakdown prc.
Simple
To sell, have a stop above diamond.
Remember. This asset is hot< it's not a junk.
All the best
Not a guru

XAUUSD — Strong Supply Rejection With Bearish Pullback TargetPrice has reached a well-defined strong supply zone, where sellers rejected higher prices, showing signs of exhaustion near the top of the rising channel.
After multiple tests and a failed continuation, momentum is weakening, increasing the probability of a pullback toward the marked support area.
As long as price remains below the supply zone, the bias stays bearish, with the next move likely targeting lower support before any fresh direction.

Gold Spot / U.S.Dollar . 1 HBonjour and greetings to my dear followers,
This is a brief analysis to catch the momentum on a 1-hour time frame, so please don’t overlook the shorter-term view. The 1-hour chart is the Gold Spot chart (XAUUSD), which clearly shows buying opportunities. Based on the DXY, this analysis is updated.
Chart review:
Monthly target based on the DXY’s downward step: the gold target is 4756.51 dollars, and the 1-hour buying area is 4223.26. A buy is appropriate with confirmations. The 4-hour liquidity is 4163.46, and the decision zone is 4061.18. At the moment I have received very strong sell confirmations, so this week should present excellent selling opportunities up to these levels, with confidence.
The weekly buying zone is 3378.77 dollars, where the likelihood of price reaching these levels is very high. These price points have been observed for gold in the past several times; we will reassess the chart. After price reaches the 1-hour, 4-hour, and daily zones and receives a sign of renewed upward confirmation, we will proceed.
When the price reaches these levels, we will enter buying positions upon receiving appropriate confirmations.
Position updates:
I regularly update both buy and sell positions on the 4-hour and daily time frames and will republish this analysis.
Risk disclosure:
This analysis is for informational purposes only and should not be considered financial or investment advice. Trading in financial markets carries risks and may result in the loss of your capital. Therefore, please conduct the necessary research and enter trades with full awareness before taking action.
Thank you!
Wishing everyone success!
Fereydoon Bahrami
“A retail trader in the Wall Street trading center (Forex).”

XAUUSD | Another One....Hello traders,
No technical analysis needed here. It is just "another one".
Good Luck!
All our analysis is shared with honesty, care, and real effort. If you find value in it, a like or comment means a lot to show your support🙏📊
