Gold (1H): Trend Rotation & Path to ObjectiveDescription :
"Analyzing the 1-Hour structure of Gold (XAUUSD), we are witnessing a significant shift in momentum using Fibonacci Arcs.
Technical Observations:
Change of Character (ChoCh): The price faced rejection at the highs, signaling a potential shift in market structure. This initial sign of weakness suggests the bulls are losing control.
Trend Rotation: We are currently observing a Trend Rotation phase where the price is curving downwards, respecting the Fibonacci levels.
Outlook & Objectives:
Bearish Bias: As long as the rotation continues below the recent highs, the short-term view remains bearish.
Target Area: The price action suggests it is Heading towards the Objective, which aligns with the key support zone around 4380 - 4390.
Disclaimer: This analysis is based on technical patterns and is for educational purposes only. Not financial advice."
Futures market

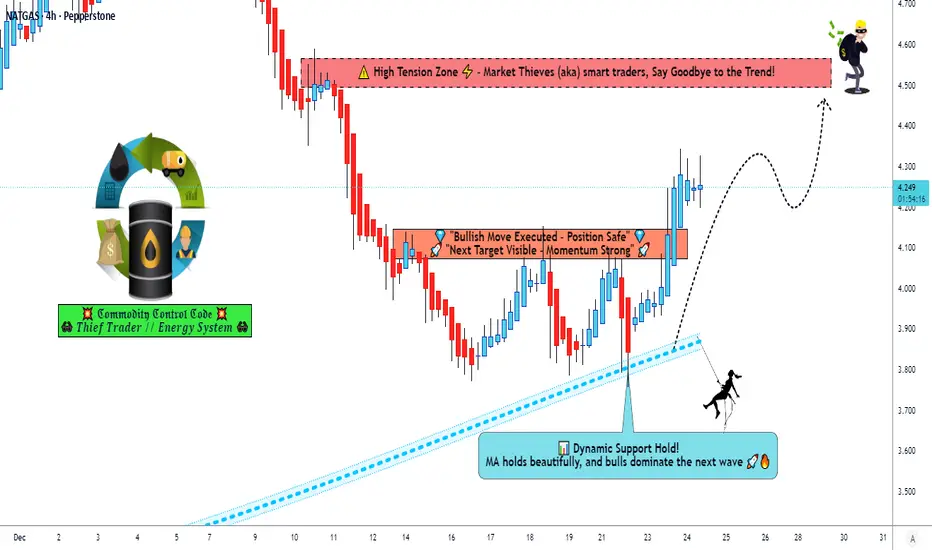
XNG/USD Trade Guide | Bullish Momentum Building🔥 XNG/USD (NATURAL GAS) — Bullish Trade Opportunity | Day / Swing Setup
📌 Asset Overview
Asset: XNG/USD — Natural Gas
Market: Energies | Commodities
Trading Style: Day Trade / Swing Trade
📈 Trade Plan — BULLISH BIAS
🟢 Primary Bias: Bullish continuation
🟢 Market Structure: Demand strength holding above key zones
🟢 Volatility: Expanding (energy markets active)
🎯 Entry Strategy
💡 Entry:
➡️ YOU CAN ANY PRICE LEVEL ENTRY
➡️ Flexible execution based on your own confirmation model
➡️ Suitable for both scalpers & swing traders
🛑 Risk Management
🚨 Stop Loss: 3.900
⚠️ This is thief SL
📝 Risk Note:
Dear Ladies & Gentlemen (Thief OG’s),
I am NOT recommending to follow only my SL.
✔️ Adjust stop loss based on your strategy, risk appetite, and account size.
✔️ Capital protection comes first.
💰 Profit Objective
🎯 Target: 4.500
📊 Target Logic:
Strong resistance zone ahead
Overbought conditions expected near highs
Trap probability increases → book profits & escape smartly
📝 TP Note:
Dear Ladies & Gentlemen (Thief OG’s),
I am NOT recommending to follow only my TP.
✔️ Secure profits based on your plan & market behavior.
🔗 RELATED PAIRS TO WATCH (Correlation Watchlist)
Keep an eye on these $-denominated energy & USD drivers:
🛢️ Energy Correlation
USOIL ( BLACKBULL:WTI ) → Strength supports energy sentiment
UKOIL ( BLACKBULL:BRENT ) → Confirms global energy demand tone
💵 USD Correlation
DXY (U.S. Dollar Index)
🔻 Weak USD = 🔺 Natural Gas supportive
🔺 Strong USD = ⚠️ May slow upside momentum
🏭 Energy Equity Proxy
Energy sector indices / producers
Institutional inflows into energy stocks often align with NG strength
🌍 FUNDAMENTAL & ECONOMIC FACTORS TO CONSIDER
🔥 Natural Gas–Specific Drivers
🌡️ Weather Outlook (US & Europe):
Colder-than-normal forecasts = higher heating demand → bullish NG
🏭 Storage Levels:
Lower-than-average inventories support upside pricing
🚢 LNG Export Demand:
Strong U.S. LNG exports tighten domestic supply
💼 Macro & Economic Factors
🏦 Federal Reserve Policy:
Rate cut expectations → weaker USD → supportive for commodities
📊 US Economic Data (GDP, PMI):
Strong growth = higher industrial energy demand
🌍 Geopolitical Energy Risks:
Supply disruptions amplify volatility & upside spikes
🧠 TRADER’S NOTE
✔️ This setup is directional, not predictive
✔️ Let price action confirm your execution
✔️ Manage risk like a professional, not a gambler
📌 If this analysis helps your trading, support it with a 👍 Like, 💾 Save, and 🗨️ Comment — it helps the idea reach more traders.
XAUUSDFocus on the current trading range of 4475-4525. A false breakout of the support level may attract buyers waiting for a suitable price. I do not rule out the possibility that gold prices will retest the 4452-4442 range before any upward movement (given the relatively active profit-taking sentiment).
Resistance levels: 4500, 4525
Support levels: 4475, 4470, 4466, 4452

XAUUSD: Market Analysis and Strategy for December 24Gold Technical Analysis:
Daily Support Level: 4382
4-Hour Support Level: 4430
1-Hour Support Level: 4470
Gold rose and then fell back today. The 4-hour chart shows a "gravestone doji" pattern in the European session, indicating a possible decline and putting some pressure on the short-term bullish trend. Moving averages remain in a bullish alignment, Bollinger Bands are trending upwards, and the price is currently holding above the upper Bollinger Band support. The MACD indicator is crossing upwards, and trading volume continues to increase. Today's support levels to watch are 4470/4460.
The 1-hour chart shows the price consolidating at high levels. The current structure still favors the bulls, but the Bollinger Bands are narrowing, indicating a slowdown in upward momentum. Short-term support is around 4470. After the technical pattern recovers, it may accumulate momentum for another rebound. The trading strategy is to buy after confirming support.
Trading Strategy:
BUY: 4470 near
BUY: 4458 near
If a significant pullback occurs below 4450, the trading plan is: BUY 4430~4420
More Analysis →

See if there's a pullback and a second entry opportunity.Gold's movement yesterday was largely in line with expectations, rising initially before falling, then pulling back again. After dropping from around 4497 to around 4430, gold rebounded, then rose again to around 4499 before encountering resistance and falling back to around 4483. This provided a good profit margin for those who participated in the trading based on the structure.
After opening today, gold prices surged again, reaching a high of around 4526. From the current trend structure, the upward trend has not changed in any substantial way, and the bulls still dominate. As for where this round of gains can ultimately extend and where the stage high resistance is, there is no need for subjective speculation at this stage; let the market do its thing. In terms of trading strategy, the principle of following the trend and waiting for a pullback remains unchanged. The pullback position can be planned in advance. Pay close attention to the support level around 4500-4480. As long as the pullback does not break, it is still a normal adjustment in a strong structure. The overall direction is still upward. Do not chase the highs or try to guess the top. Following the trend and looking for opportunities within the structure is the more prudent way to deal with the current market.

To our amazing followers — thank you for being with us!Huge shoutout to all our followers for an incredible year!! Your support is everything; it’s what keeps us motivated every single day!
We’ve got some killer updates in the works for 2026🚀 to Boost Your Trading.
We’re gonna work our tails off to keep your trust and deliver the best value possible.
Stay tuned!🔥

BUY XAUUSD ASSET-GOLD Gold Trade Explanation
I followed higher timeframe direction first.
Price was trading in a clean area with clear structure.
I waited for confirmation before entering.
The entry was taken only after price showed acceptance in my zone.
Risk was predefined before execution.
No chasing. No adjustments after entry.
The trade respected structure and continued as expected.
Execution followed plan and timing rules.
This was a rules-based trade.
Process first. Outcome second.

GOLD ViewGold surged past $4,500 per ounce on Wednesday to a fresh record, driven by expectations of further Federal Reserve easing and rising geopolitical tensions.
US economic growth remained solid in the third quarter, with GDP expanding at a faster pace than in the prior period, although labor market data pointed to continued but gradually moderating job creation.
Markets are still pricing in two rate cuts in 2026 as inflation cools and employment conditions soften, even as policymakers remain divided.
Meanwhile, tensions involving Venezuela, where the US has blockaded oil tankers, have lifted safe-haven demand and increased geopolitical risk across commodity markets.

Gold Pauses, Not Reverses — Pullback Before the Next ExpansionXAUUSD – 1H KEY POINTS
Technical
Strong impulsive uptrend intact; current move is a healthy pullback.
Price holding above prior breakout → bullish retest structure.
As long as price stays above the support zone ~4,420–4,430, upside remains favored.
Next upside targets sit around 4,525 → 4,570.
Key Levels
Support: 4,420 – 4,430
Resistance / Target: 4,500 → 4,525 → 4,570
Macro / News Impact
USD softness & falling real yields continue to support gold.
Ongoing geopolitical risk + rate-cut expectations keep demand strong.
No risk-off shock → pullbacks are being bought, not sold.
Bias
Buy pullbacks above support.
Trend invalidated only on a clean break below support.

Latest gold price analysis today!Market News:
At the end of 2025, the global spot gold market experienced an unprecedented and frenzied surge. London gold prices repeatedly broke records, international gold prices broke through the $4500 mark, and domestic brand gold jewelry prices even surpassed $1400 for the first time. Rongtong gold prices also broke through the $1000 mark! Escalating geopolitical tensions are maintaining demand for safe-haven assets, providing continued support for gold. Multiple factors, including expectations of a Federal Reserve rate cut and a weakening dollar, coupled with strong industrial demand and active central bank buying, have propelled the entire gold market into a super bull market mode! The recent surge also reflects a year-end adjustment before the long holidays. Although profit-taking at higher levels may trigger short-term consolidation, the overall trend remains positive. Wednesday is Christmas Eve, and most European and American markets are closed or have closed early. Thursday is Christmas Day, and markets are closed all day with no major economic data releases. Thin trading could lead to significant volatility or short-term profit-taking risks.
Technical Analysis:
Gold maintained its strong buying momentum, continuing to refresh historical highs. The daily chart maintains a strong bullish structure, the buying trend remains intact, the moving average system maintains a golden cross and upward opening, and the RSI indicator has reached a high of 80. Short-term hourly and four-hour charts continue the breakout with increasing volume, the price is trading along the 10-day moving average and the upper Bollinger Band, constantly refreshing historical highs. The only thing to do is follow the market trend and trade with the trend. Avoid trying to guess the top and maintain the trading strategy of buying on dips. In the Asian morning, gold continued its strong performance. The 1-hour chart is still clearly driven by buying, the moving averages are diverging in a bullish direction, and pullbacks are consistently and quickly corrected, indicating that the current phase is not the end of the trend but an acceleration phase within a strong uptrend. The price stabilizing around 4500 is essentially a second rise after the previous consolidation, and the trend has not been broken. However, it should be noted that after the continuous rise, short-term divergence has begun to accumulate. At this level, the key to judgment is not "whether it will fall," but whether there is still room for another rise during a pullback. As long as the pullback doesn't result in uncontrolled volume spikes, the overall trend remains a consolidation within a strong uptrend.
Gold Trading Strategy:
Buy gold at 4475-4480 (short-term), stop-loss at 4460, target 4520-4550;
Sell gold at 4560-4565 (short-term), stop-loss at 4580, target 4500-4480.
Key Levels:
First Support: 4498, Second Support: 4470, Third Support: 4452
First Resistance: 4537, Second Resistance: 4568, Third Resistance: 4590

GIFTNIFTY IntraSwing Levels For 24th Dec '25Watch NIFTY Spot while Entering Trade
💥Level Interpretation / description:
L#1: If the candle crossed & stays above the “Buy Gen”, it is treated / considered as Bullish bias.
L#2: Possibility / Probability of REVERSAL near RLB#1 & UBTgt
L#3: If the candle stays above “Sell Gen” but below “Buy Gen”, it is treated / considered as Sidewise. Aggressive Traders can take Long position near “Sell Gen” either retesting or crossed from Below & vice-versa i.e. can take Short position near “Buy Gen” either retesting or crossed downward from Above.
L#4: If the candle crossed & stays below the “Sell Gen”, it is treated / considered a Bearish bias.
L#5: Possibility / Probability of REVERSAL near RLS#1 & USTgt
HZB (Buy side) & HZS (Sell side) => Hurdle Zone,
*** Specialty of “HZB#1, HZB#2 HZS#1 & HZS#2” is Sidewise (behaviour in Nature)
Rest Plotted and Mentioned on Chart
Color code Used:
Green =. Positive bias.
Red =. Negative bias.
RED in Between Green means Trend Finder / Momentum Change
/ CYCLE Change and Vice Versa.
Notice One thing: HOW LEVELS are Working.
Use any Momentum Indicator / Oscillator or as you "USED to" to Take entry.
⚠️ DISCLAIMER:
The information, views, and ideas shared here are purely for educational and informational purposes only. They are not intended as investment advice or a recommendation to buy, sell, or hold any financial instruments. I am not a SEBI-registered financial adviser.
Trading and investing in the stock market involves risk, and you should do your own research and analysis. You are solely responsible for any decisions made based on this research.
"As HARD EARNED MONEY IS YOUR's, So DECISION SHOULD HAVE TO BE YOUR's".
Do comment if Helpful .
Do Comment for In depth Analysis.
❇️ Follow notification about periodical View

XAUUSD WeAxes scalper plan (next few sessions):Structure: Gold is still in a strong uptrend, trading above all key SMAs on D and H4, but momentum is stretched with RSI in overbought territory.
Premium zone (short‑term fades only): 4,430–4,480. I only look for shorts after a sweep of highs + M15/H1 CHoCH down, targeting 4,400 then 4,370.
First discount buy zone: 4,390–4,400 (near 4H 20‑SMA / VWAP). I look for sweeps of lows + CHoCH up to long back toward the highs.
Deeper discount (A+ only): 4,350–4,320; if tapped with strong news flush, I’ll wait for liquidity grab + displacement up and aim for a rotation back toward 4,400–4,430.
No trades in the middle, London/NY only, risk 0.25–0.75% per trade, 1% only on A+ sweep + CHoCH setups.

XAUUSD – Buy Zone Reaction | Bullish Continuation Setup (30m)Gold is currently pulling back into a well-defined demand / buy zone, which previously acted as strong support. Price respected this area in the past and is now revisiting it after a consolidation phase, suggesting potential accumulation.
Technical View:
Overall structure remains bullish
Price is reacting from a key support zone
Consolidation above demand indicates buyers are still in control
Trade Idea:
Buy Zone: Highlighted demand area
Target: Previous high / marked resistance zone
Invalidation: Clear break and close below the buy zone
This setup favors a bounce from support toward the upside target, provided the zone holds. Confirmation from lower-timeframe price action is recommended before entry.

Elliott Wave Analysis XAUUSD – 23/12/2025
1. Momentum
D1 (Daily):
The D1 momentum has already shifted to the upside. However, this reversal is occurring directly within the overbought zone. This suggests that the current bullish move may not be sustainable for long, and the risk of a medium-term reversal should be carefully monitored.
H4:
H4 momentum is currently compressed, indicating that the bullish move still has room to continue. That said, a momentum reversal can occur at any time. A single confirmed bearish H4 candle would likely trigger a corrective move lasting several H4 candles.
H1:
H1 momentum is currently turning down. Therefore, in the short term, there is a high probability of a pullback on the H1 timeframe, especially if the decline extends over several consecutive H1 candles.
2. Elliott Wave Structure
D1:
The current D1 wave structure shows that price has broken above the Wave 3 high. Although this does not completely invalidate the flat correction scenario, it serves as an important warning signal that requires close attention.
The 127% extension of the purple W wave is the next key observation zone. According to Elliott Wave theory, if price breaks below the base of wave W, wave X often extends toward the 127% level of wave W.
If price decisively breaks this zone, we must prepare for the possibility of a new bullish trend, potentially with a larger upside expansion. In that case, an updated scenario will be provided.
H4:
Wave 5 (blue) is currently extending. At this stage, the priority remains observation and confirmation from H4 momentum.
If a confirmed bearish H4 candle appears, we will reassess whether a short-term top has already been formed.
H1:
Within the red 5-wave structure, wave 5 is showing signs of extension. Inside this red wave 5, a smaller black 5-wave structure is developing.
When wave 5 extends, precise target projection becomes more challenging. Therefore, at this stage, we use the 127% extension of the purple W wave on D1, around the 4514 price zone, as the primary observation target.
If price breaks strongly above 4514, the probability of a new bullish trend increases significantly.
If price reaches this zone and reverses downward, the D1 flat correction scenario remains valid, and the downside target of the purple Y wave may be adjusted higher than initially expected.
3. Trading Plan & Targets
The 4514 zone is considered the primary Sell observation area. However, it is important to emphasize:
- Top picking always carries very high risk, even though potential rewards may be large
- With an extended wave 5, price action can become highly volatile and irregular
- Therefore, position sizing and strict risk management are mandatory
Sell Zone: 4514 – 4516
Stop Loss: 4535
Take Profit 1: 4420
Take Profit 2: 4348

Gold Trade Set Up Dec 24 2025Price came down and has respected demand and swept London lows so now if price can close above CISD i will take buys up to London highs and higher BSL/ATH

Silver could keep going Drawn a few strong trend lines and this pattern of rejection then strong upward movement is seen
I think this is repeating and could push silver very high
bullish on this weekly chart

“Gold Is Not Overextended — This Is Controlled Accumulation CURRENT MARKET ANALYSIS & TODAY’S TREND
Gold (XAUUSD) – H1
Market Context
Gold continues to maintain a dominant bullish trend on the H1 timeframe. Following the Wyckoff accumulation process (Phase B), price has shown clear absorption behavior, breaking above the previous equilibrium area. This confirms that smart money remains in control of the trend.
Structure & Technical Perspective
Price is developing a continuation impulsive structure, where corrective legs (2) and (4) remain purely technical and do not damage the bullish framework.
The market stays above key moving averages, validating sustained upside momentum.
The 4.46x – 4.47x zone is acting as a dynamic support area. As long as price holds above this region, bullish strength remains intact and continuation pressure builds.
Today’s Scenario
Primary bias: BUY with the trend.
Focus on pullback entries, not chasing highs.
If momentum persists, the market is positioned to extend toward the 4.57x zone and beyond.
Only a clear breakdown below the lower support zone would require reassessing the bullish outlook.
Market Conclusion
Main Trend: UP
Market State: Re-accumulation within a strong bullish cycle
Strategy: Follow the trend, execute patiently, manage risk strictly
Gold is not distributing — it is absorbing supply and preparing for the next leg higher.
TODAY’S LIMITED STRATEGY — DEC 24
Intraday Bias: Re-accumulation
📌 SETUP 1: Timing Sell Zone (Counter-trend scalp)
SELL ZONE: 4576 – 4579
TP: 4573 – 4568
SL: 4583
Short-term reaction trade only. Strict risk control required.
📌 SETUP 2: Timing Buy Zone (Trend-following)
BUY ZONE: 4430 – 4433
TP: 4436 – 4441
SL: 4426
Preferred setup — aligns with the dominant bullish structure.
Final Note:
Stay disciplined. Trade in alignment with structure, respect risk management, and let the market confirm continuation rather than forcing entries.

Sorry, I'm still buying gold!Gold surged past $4,500 per ounce on Wednesday to a fresh record, driven by expectations of further Federal Reserve easing and rising geopolitical tensions.
US economic growth remained solid in the third quarter, with GDP expanding at a faster pace than in the prior period, although labor market data pointed to continued but gradually moderating job creation.
Markets are still pricing in two rate cuts in 2026 as inflation cools and employment conditions soften, even as policymakers remain divided.
Meanwhile, tensions involving Venezuela, where the US has blockaded oil tankers, have lifted safe-haven demand and increased geopolitical risk across commodity markets.

XAUUSD H1 CHART ANALYSIS I 12/241. Trend Overview
Primary Trend: Gold is in a strong Bullish trend. This is clearly indicated by the ascending trendline starting from the lows below 4,360.
Market Structure: The price is consistently forming Higher Highs (HH) and Higher Lows (HL). Currently, the price is showing signs of consolidation around the most recent peak.
2. Volume Profile Analysis
The Volume Profile on the left side of the chart reveals key areas of liquidity:
POC (Point of Control) – ~4,484: This is the price level with the highest traded volume. The price is currently reacting just above this level, making it a pivotal support zone. As long as price stays above the POC, the upward momentum remains healthy.
VAH (Value Area High) – ~4,499: This represents the upper boundary of the Value Area. The price recently broke above this level and is currently "retesting" it.
VAL (Value Area Low) – ~4,424: This is a major support zone further down. In the event of a deep correction, this would be a primary area for buyers to re-enter.
3. Potential Price Scenarios
Scenario 1: Bullish Continuation
If the price stabilizes and closes firmly above the 4,500 level (a psychological barrier near the VAH), Gold is likely to target higher levels such as 4,520 or beyond.
Recent candles show lower wicks (rejection), indicating buying pressure stepping in whenever the price touches the POC zone.
Scenario 2: Technical Correction
If the price fails to hold the 4,484 (POC) support, Gold may enter a short-term corrective phase toward the Trendline (roughly the 4,460 – 4,470 area).
A correction like this is often considered healthy for the market to "reset" before the next leg up.
4. Trading Strategy Reference
Long Entry (Buy): Look for buying signals around the 4,484 (POC) zone or a confirmed breakout above the 4,500 resistance with high volume.
Stop Loss (SL): Ideally placed below the immediate support or the ascending trendline (around the 4,450 area).
Take Profit (TP): Target the recent swing high at 4,525 and subsequent round numbers.
Note: Gold is trading at historically high levels according to this chart (4,4xx range). Be sure to monitor fundamental drivers such as the DXY (US Dollar Index) or Fed announcements to complement this technical view.

goldI'm entering a short position on gold, as it's oversold on the weekly, daily, 4-hour, and 1-hour charts. Furthermore, it has been moving within this upward channel. The area marked in red is an overextended Fibonacci zone, between 4 and 4.41. I have two entry points. If I have $1,000, I'll enter with $500 at the first entry point, with a stop-loss in the middle of the red zone, and my second entry will be at the stop-loss level of the first entry.

Silver is inevitably going to be very strong.Silver always moves late, but a strong pattern has already formed on the upside to $40-60-80-100. We are going back to 2002.
In early 2004, the metal began to rise in price rapidly and by the end of 2007 the price reached $18 per troy ounce.
Just ask your parents what happened in 2000-2005, it will be the same again.ain.

Are bulls back??Hard to say, finally getting some kind of structure. We bottomed at 3.46 only once, if we go back down we would hope to see a double bottom off that. 4hr is halfway through its extension and slowing down a bit. We need to see 4 hour strengthen again to get a real rally going off of this move. If not spot will be returning to $4. We are approaching the cloud but we would want to see this break the cloud by Monday and that prospect is slowly diminishing. Widening out to Daily RSI slightly crossed but hasn’t turned fully positive. MACD is beginning to plateau getting ready for a turn around but it isn’t confirmed yet. Good luck all. We will re analyze on Monday.

