Dow Jones: Potential Explosive Move!Hey Traders,
In today's trading session we are monitoring US30 (Dow Jones) for a buying opportunity around the 48,400 zone. The index is trading in a strong uptrend and is currently in a correction phase, approaching the trend area at 48,400 support and resistance.
Trade safe,
Joe.
Market indices

Major correctionI'm targetting a drop to 11 000 around Aug to Dec next year and back to more reasonable valuations than currently. This would also arrive at the very long term lower trend line on the log chart. The area around 11 000 looks to me like it need retesting. And it would need to be in this sort of time f

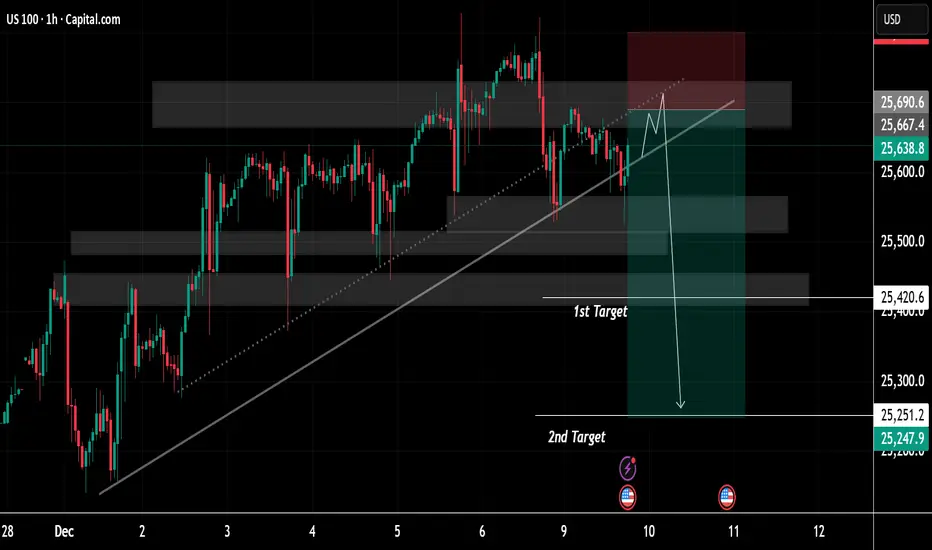
US100 Price Update – Clean & Clear ExplanationUS100 is moving within a broad ascending channel, defined by a long-term diagonal support line that has guided the market’s bullish momentum since late November. Multiple interaction points along this trendline show it has historically acted as a reliable dynamic support zone.
Several shaded horizo
DAX40 continuation on bullish biasDAX40 SMC retracement into structure and continuing its weekly bias(bullish).

SELLS ON US30Sell order on US30. I saw a shift in momentum to the downside as marked ny the red candle on H2 time frame. i dont expect this short to work though as we are on all time highs CAPITALCOM:US30

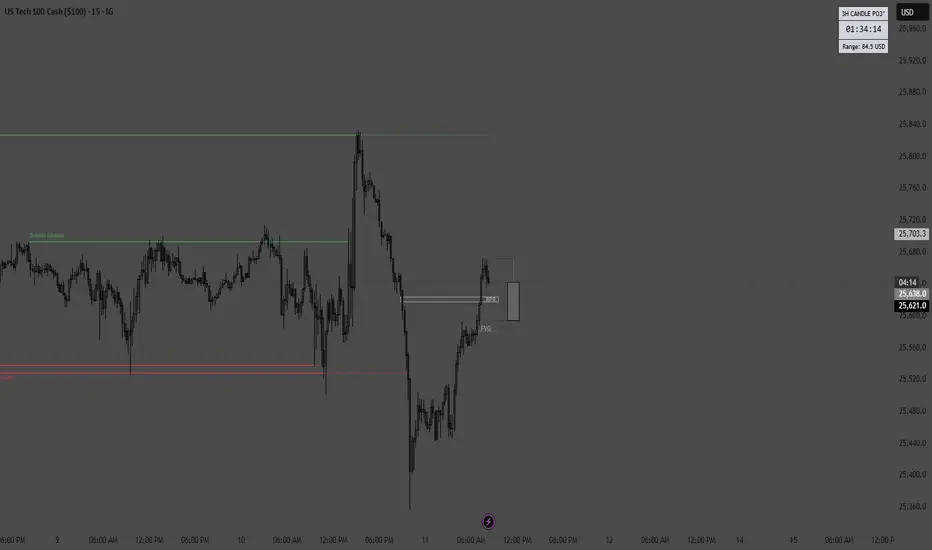
Another bad day for price action in the Nasdaq
BAD DAY TO TRADE
Nasdaq is very choppy today just as it has been for the entire year. London session already dealt with very high FOMC push so if it went more Bearish on the day I wouldn't be surprised. However the price action for December has been absolutely abysmal. Pre-Market stocks are lo
SPX500 | Bulls Target 6957 as Breadth Improves Beyond AISPX500 – Technical Overview
The S&P 500 has reached a new record high, notably without support from AI-related stocks.
Despite underwhelming earnings from Oracle and Broadcom, the broader market continued to rally—an encouraging sign that sector leadership may be broadening rather than relying sole

SPX Is going up...time to buySPX 500 is in a clear upwards channel and has broken the last bit of resistance (white trendline line shown) - this is a clear confirmation that the next target will be the next resistance zone to the upside shown above (this is a great buy trade opportunity) - buy the SPX 500 now

S&P 500 Breakdown Alert — Rising Wedge Reversal in Play!Today I want to share an S&P 500 index( SP:SPX ) analysis, as this index plays a major role in guiding correlated markets—especially crypto, and particularly Bitcoin( BINANCE:BTCUSDT ).
The S&P 500 index entered the Potential Reversal Zone(PRZ) and resistance zone($6,902_$6,875), where it began to

The Trading Range is about to be testedTomorrow we should see all time highs, but I'm thinking it will not stick and so the trading range play may be in effect. Vix also about to test it's previous channel under 14. Gold, possibly a false breakout, seems to be following the general market. Oil may have bottomed, but nothing definitive. N

See all popular ideas
Index collections
Frequently Asked Questions
An index is a financial instrument that measures the performance of underlying assets or tracks other financial data. Some indices are designed to provide a broad view of the market, while others focus on tracking a particular sector of the economy. Indices give traders an instant snapshot of market sentiment with a rising index suggesting optimism about the economy and a declining index signaling uncertainty.
For example, the S&P 500 Index (SPX) tracks the performance of 500 large publicly traded companies in the United States, while the US consumer price index (CPI) measures US inflation and deflation.
Usually, indices are expressed in points, but some, like the S&P 500, can be expressed in the national currency.
With TradingView, you can follow all indices in one place.
Indices are used to track assets or financial data, so they're not designed for trading, but some financial instruments linked to indices can be traded on exchanges. They include mutual funds, exchange-traded funds (ETFs), index futures, contracts for difference (CFDs), and options on indices.
We recommend conducting a thorough analysis before settling with any of these instruments: explore indices ideas and forecasts and then select a reliable brokerage on TradingView. Once you open an account, you'll be all set to start investing in indices.
We recommend conducting a thorough analysis before settling with any of these instruments: explore indices ideas and forecasts and then select a reliable brokerage on TradingView. Once you open an account, you'll be all set to start investing in indices.
The main global indices that investors and traders track include the S&P 500, FTSE 100, Dow Jones, and more.
For your convenience, we have a list of all major indices in one place — analyze their stats to conduct a well-rounded analysis.
For your convenience, we have a list of all major indices in one place — analyze their stats to conduct a well-rounded analysis.
Stock market indices are mainly used to gauge the health of a particular sector of the world economy. For example, as one of the main global indices, the S&P 500 (SPX) provides investors and traders with insight into the health of the US economy. Another reputable index, the DAX Index, helps assess the performance of German blue-chip companies. It is one of the primary indicators of Germany's economic health in particular and, more broadly, the EU's economic health.
Today, CAC 40 is 8,068.62 EUR. It has decreased by 1.49% over the past month. DAX is 24,186.49 EUR (0.24% down since last month) while FTSE 100 is 9,649.02 GBP (2.53% down since last month).
For the broader outlook, we have a list with indices of the European countries.
For the broader outlook, we have a list with indices of the European countries.
As of today, the S&P 500 stands at 6,827.42 USD, showing a 0.59% decrease over the past month. Dow Jones is currently at 48,458.06 USD, reflecting a 0.92% increase during the same period. Meanwhile, Nasdaq 100 has reached 25,196.73 USD, marking a 1.81% decrease compared to the previous month.
For the broader outlook, we have a list with all indices in one place.
For the broader outlook, we have a list with all indices in one place.
The Standard and Poor's 500 (SPX) is one of the most reputable indices, tracking the performance of 500 largest publicly traded US-based companies. It represents approximately 80% of the total US equity market capitalization, making it the prime indicator of the US economy's health.
Today, the SPX is 6,827.42 USD, it has decreased by 0.59% over the past month.
On TradingView, you can track SPX components and watch the SPX chart to stay on top on index dynamics.
Today, the SPX is 6,827.42 USD, it has decreased by 0.59% over the past month.
On TradingView, you can track SPX components and watch the SPX chart to stay on top on index dynamics.
The Dow Jones, or just the Dow, is short for the Dow Jones Industrial Average Index (DJI). It is one of the most reputable indices, tracking the performance of 30 blue-chip US stocks. All of them are stable and trusted companies boasting a long history of weathering the market under different circumstances, from gains during bull runs to surviving global economic crises.
Today, the DJI is 48,458.06 USD, it has increased by 0.92% over the past month.
On TradingView, you can track DJI components and watch the DJI chart to stay on top of index dynamics.
Today, the DJI is 48,458.06 USD, it has increased by 0.92% over the past month.
On TradingView, you can track DJI components and watch the DJI chart to stay on top of index dynamics.
An index fund is a financial instrument that tracks the performance of a financial index. Since indices cannot be bought as they are, index funds can have different structures that provide investors with exposure to the identical price fluctuations of a given set of stocks.
For example, an index fund can hold the exact stocks in a proportion similar to the index's initial weight, given to each stock. Therefore, as the index changes, a well-structured index fund would change by the same value.
To gain insight into market indices, explore our community ideas on indices.
For example, an index fund can hold the exact stocks in a proportion similar to the index's initial weight, given to each stock. Therefore, as the index changes, a well-structured index fund would change by the same value.
To gain insight into market indices, explore our community ideas on indices.