US100 Builds Momentum Toward New HighsUS100 Builds Momentum Toward New Highs
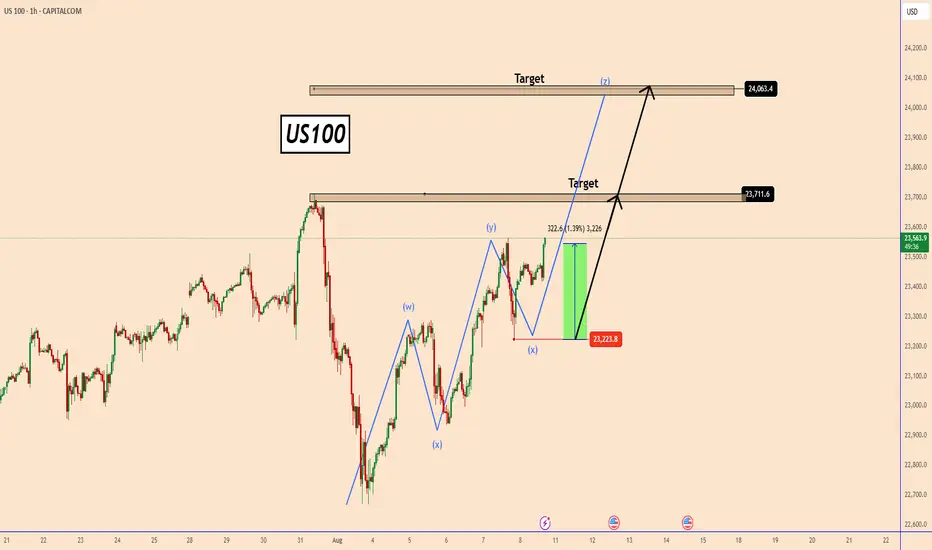
Since yesterday, the US100 has climbed by nearly 1.4%, rising from 23,223 to 23,550.
The bullish trend is strong, and it looks like US100 is preparing for a bigger upward move—possibly aiming to set a new all-time high.
Before continuing higher, US100 may first test the top of the current structure near 23,710, and then push toward 24,000.
The rally comes after weaker-than-expected NFP data, which has increased expectations for a 25 basis point rate cut by the Fed in September.
J.P. Morgan now forecasts a 25 bps rate cut, citing signs of a slowing labor market and uncertainty surrounding President Donald Trump's latest Fed nomination.
You may find more details in the chart!
Thank you and Good Luck!
PS: Please support with a like or comment if you find this analysis useful for your trading day
Market indices
NASDAQ Potential UpsidesHey Traders, in today's trading session we are monitoring NAS100 for a buying opportunity around 23,300 zone, NASDAQ is trading in an uptrend and currently is in a correction phase in which it is approaching the trend at 23,300 support and resistance area.
Trade safe, Joe.

Nikkei 225 Index Rises Towards the 42,000 LevelNikkei 225 Index Rises Towards the 42,000 Level
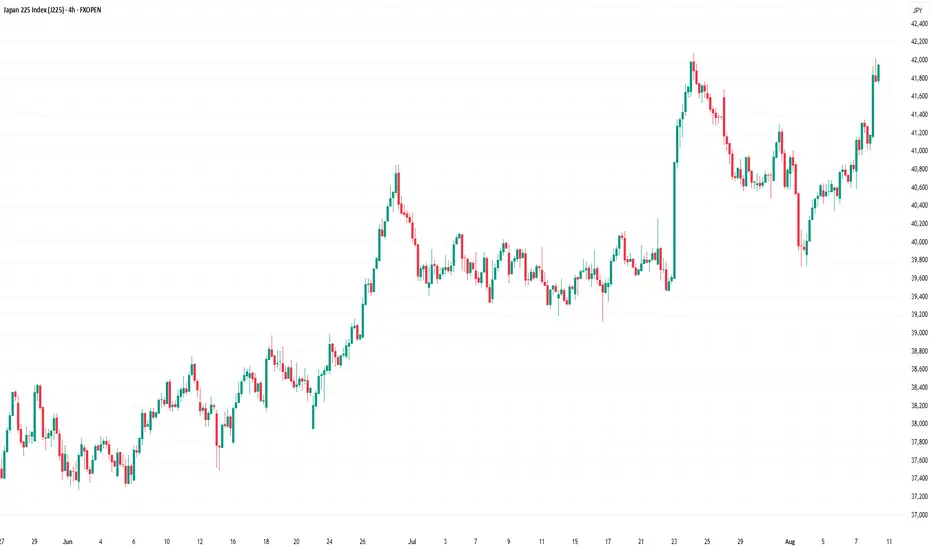
As the chart indicates, the Nikkei 225 stock index has today risen to the 42,000 mark, which is just below its all-time high.
Among the bullish drivers:
→ Corporate news. Strong quarterly results were reported by Sony Group and SoftBank.
→ Trade agreement developments. Positive news flow surrounds a potential tariff agreement between the United States and Japan, which could be finalised in the near term. According to Reuters, the Japanese government stated on Thursday that the US has pledged to adjust overlapping tariffs on Japanese goods to avoid double taxation.
Technical Analysis of the Nikkei 225 Chart
Previously, we highlighted the ascending channel that has shaped price action throughout 2025. This pattern remains valid, with the price now entering the upper half of the channel. The channel’s median line might act as a support level going forward.
The recent price behaviour attracts attention: a long bullish candle has formed on the chart – immediately following a breakout above the 41,280 resistance level (as indicated by the arrow). This signals a clear imbalance in favour of buyers.
From a bearish perspective:
→ The psychological resistance at 42,000 may hold – in late July, the price failed to stay above this level.
→ The RSI indicator has entered overbought territory.
→ Failure by the bulls to sustain a break above 42,000 could validate a potential Double Top bearish pattern.
From a bullish perspective:
→ The price might advance towards the upper boundary of the ascending channel.
→ The bullish candle displays characteristics of an FVG (Fair Value Gap) bullish pattern, which might serve as a future support level.
→ Further support could be provided by the orange trendline, as well as the former resistance at 41,280.
A bullish breakout attempt above 42,000 cannot be ruled out. However, will market optimism persist if the price approaches the upper limit of the channel?
This article represents the opinion of the Companies operating under the FXOpen brand only. It is not to be construed as an offer, solicitation, or recommendation with respect to products and services provided by the Companies operating under the FXOpen brand, nor is it to be considered financial advice.
Lower High Complete?OFC earnings provided buys a good level to pick up price but POC at 6375 was key.
The 4HR shows and englufing with LH partially complete.
Bias is Short!

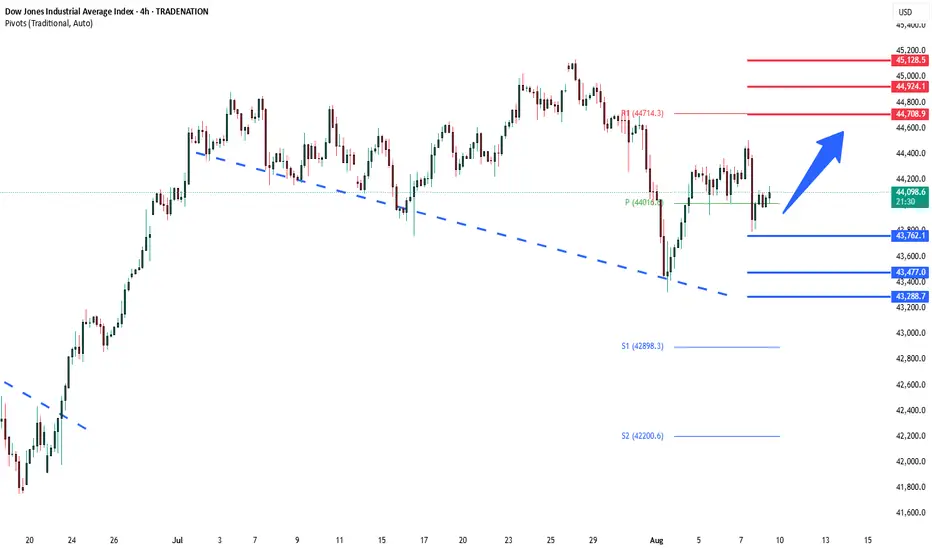
DowJones key trading levelsKey Support and Resistance Levels
Resistance Level 1: 44700
Resistance Level 2: 44924
Resistance Level 3: 45130
Support Level 1: 43760
Support Level 2: 43477
Support Level 3: 43288
This communication is for informational purposes only and should not be viewed as any form of recommendation as to a particular course of action or as investment advice. It is not intended as an offer or solicitation for the purchase or sale of any financial instrument or as an official confirmation of any transaction. Opinions, estimates and assumptions expressed herein are made as of the date of this communication and are subject to change without notice. This communication has been prepared based upon information, including market prices, data and other information, believed to be reliable; however, Trade Nation does not warrant its completeness or accuracy. All market prices and market data contained in or attached to this communication are indicative and subject to change without notice.
Smallcap paradox 200WEMA and 40WEMA200WEMA - Two touches in a bear market after a simmering bullmarket once 40WEMA is breached. Buying point for Lumpsum bros.
40WEMA - Ride it to buy dips during a bull market. Dip buying point for BTD monkeys.

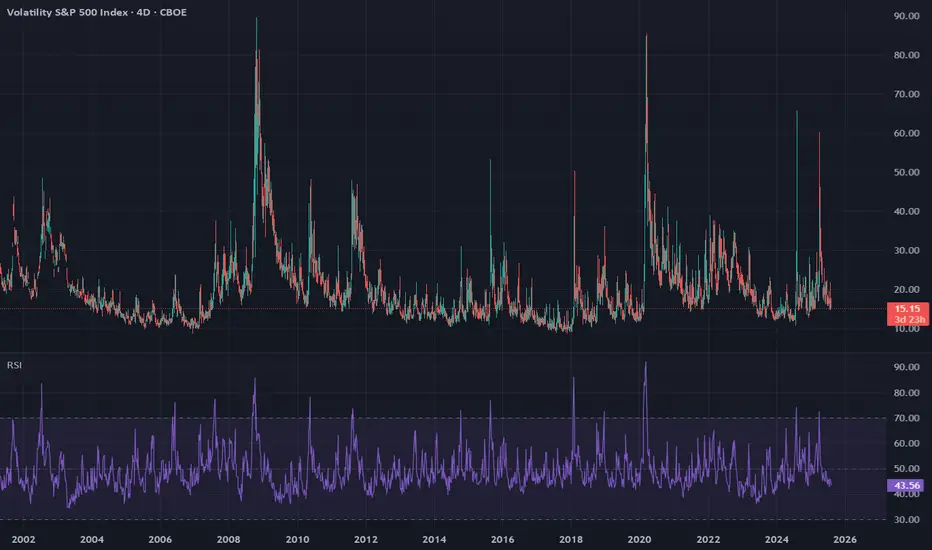
Have we entered a brand new normal or is a crash coming?The market's bullish narrative rests first and foremost on the control of volatility. I won't go too much deeper into that right now, but I have been discussing with AI the current period of volatility expression and would like to highlight the following points about the current period:
4d VIX RSI has not had a 5 point increase since April 1 of this year. That's 129 days and counting.
From Claude AI (Anthropic):
The ongoing 4 day VIX RSI fall period (started April 1, 2025, now at 128+ days) is completely unprecedented since September 2003 (when VIX formula was modernized).
That's already:
More than double the longest ever previous period of in October 28, 2020 to Jan 27, 2021 (63 days)
Nearly 10x longer than the average period (13.14 days)
Over 12 standard deviations beyond the mean
The only period ever to exceed 70 days since September 2003
Key Insight:
Since September 2003, 67.3% of all fall periods recovered within 2 weeks, and 84.2% recovered within 3 weeks. The current 128+ day period represents an extreme statistical outlier in modern VIX behavior.
Additionally, if we look at the S and P week chart, we see that the gap from May 9 to May 12 is the largest ever unfilled weekly gap in the entire history of the S and P.
We are currently in a whole new normal of "bullishness", akin to the time period just before the great crash and great depression (which was the most bullish the stock market has ever been).
The Stock Market History Says…The Stock Market History Says…
When Capital Rotation Events (CRE) hit, stocks stall & gold outperforms.
Past (1949, 1974, 2009) hints at a retest of the 300-month MA before the next big leg up, maybe around 2036.
Watch GOLD vs SPX for the signal.

US30 Dow Jones Analysis
Dow Jones is getting ready to move, but the big question is:
Will it bounce from 43,670, or wait to touch 42,770?
The answer depends on this week’s trading volume.
🚀 For a real take-off, we need a confirmed close above 44,580;
otherwise, expect a bit of sideways action while the market builds momentum.
This week could be exciting and full of opportunities!

Dow Jones Slides on Tariff News – What’s Next?US30 – Market Overview
US30 dropped nearly 600 points yesterday ahead of the announcement of new tariffs, adding pressure to the broader market.
Technical Outlook
Bearish Scenario:
While price remains below 44170, bearish momentum is favored, targeting 43960.
A confirmed break below 43960 would likely extend the decline toward 43630.
Bullish Scenario:
A 1H close above 44170 would shift the bias to bullish, targeting 44360 and possibly 44470.
Support: 43960 – 43630
Resistance: 44360 – 44470

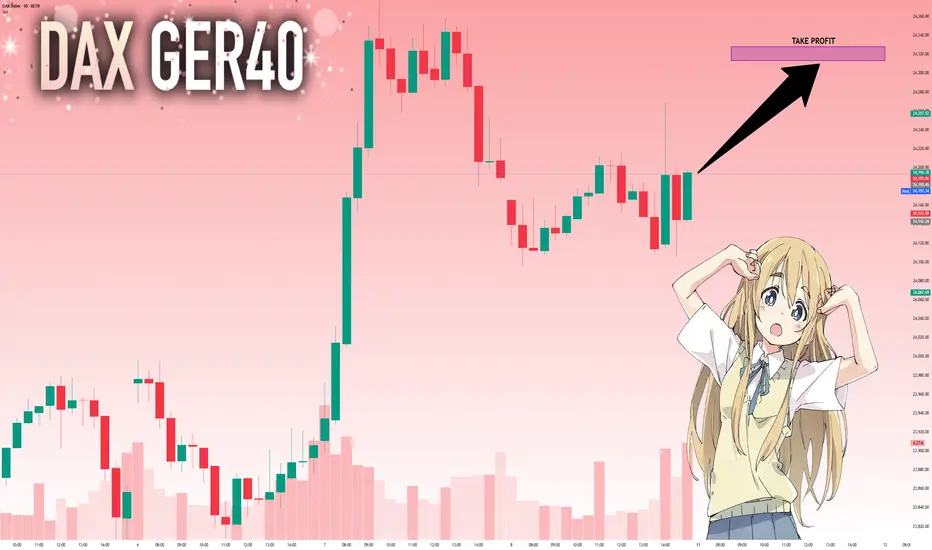
DAX: Next Move Is Up! Long!
My dear friends,
Today we will analyse DAX together☺️
The in-trend continuation seems likely as the current long-term trend appears to be strong, and price is holding above a key level of 24,194.78 So a bullish continuation seems plausible, targeting the next high. We should enter on confirmation, and place a stop-loss beyond the recent swing level.
❤️Sending you lots of Love and Hugs❤️
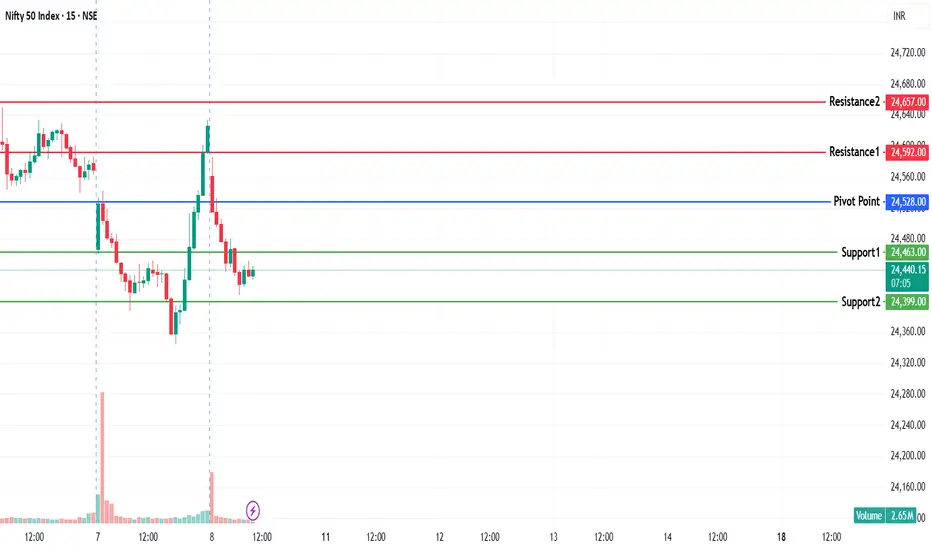
NIFTY KEY LEVELS FOR 08.08.2025NIFTY KEY LEVELS FOR 08.08.2025
Apologies for the delay in sharing this..
If the candle stays above the pivot point, it is considered a bullish bias; if it remains below, it indicates a bearish bias. Price may reverse near Resistance 1 or Support 1. If it moves further, the next potential reversal zone is near Resistance 2 or Support 2. If these levels are also broken, we can expect the trend.
If the range(R2-S2) is narrow, the market may become volatile or trend strongly. If the range is wide, the market is more likely to remain sideways
📢 Disclaimer
I am not a SEBI-registered financial adviser.
The information, views, and ideas shared here are purely for educational and informational purposes only. They are not intended as investment advice or a recommendation to buy, sell, or hold any financial instruments.
Please consult with your SEBI-registered financial advisor before making any trading or investment decisions.
Trading and investing in the stock market involves risk, and you should do your own research and analysis. You are solely responsible for any decisions made based on this research.
JPN225 H4 | Bearish reversalJapan 225 Index (JPN225) is reacting off the sell entry which acts as a swing high resistance and could reverse from this level oculd indicating a double top pattern which might lead to a potential price drop to the take profit.
Sell entry is at 42,043.92, which is a swing high resistance.
Stop loss is at 42,794.15, which aligns with the 127.2% Fibonacci extension and the 100% Fibonacci projection.
Take profit is at 41,269.97, which is a pullback support.
High Risk Investment Warning
Trading Forex/CFDs on margin carries a high level of risk and may not be suitable for all investors. Leverage can work against you.
Stratos Markets Limited (tradu.com ):
CFDs are complex instruments and come with a high risk of losing money rapidly due to leverage. 65% of retail investor accounts lose money when trading CFDs with this provider. You should consider whether you understand how CFDs work and whether you can afford to take the high risk of losing your money.
Stratos Europe Ltd (tradu.com ):
CFDs are complex instruments and come with a high risk of losing money rapidly due to leverage. 66% of retail investor accounts lose money when trading CFDs with this provider. You should consider whether you understand how CFDs work and whether you can afford to take the high risk of losing your money.
Stratos Global LLC (tradu.com ):
Losses can exceed deposits.
Please be advised that the information presented on TradingView is provided to Tradu (‘Company’, ‘we’) by a third-party provider (‘TFA Global Pte Ltd’). Please be reminded that you are solely responsible for the trading decisions on your account. There is a very high degree of risk involved in trading. Any information and/or content is intended entirely for research, educational and informational purposes only and does not constitute investment or consultation advice or investment strategy. The information is not tailored to the investment needs of any specific person and therefore does not involve a consideration of any of the investment objectives, financial situation or needs of any viewer that may receive it. Kindly also note that past performance is not a reliable indicator of future results. Actual results may differ materially from those anticipated in forward-looking or past performance statements. We assume no liability as to the accuracy or completeness of any of the information and/or content provided herein and the Company cannot be held responsible for any omission, mistake nor for any loss or damage including without limitation to any loss of profit which may arise from reliance on any information supplied by TFA Global Pte Ltd.
The speaker(s) is neither an employee, agent nor representative of Tradu and is therefore acting independently. The opinions given are their own, constitute general market commentary, and do not constitute the opinion or advice of Tradu or any form of personal or investment advice. Tradu neither endorses nor guarantees offerings of third-party speakers, nor is Tradu responsible for the content, veracity or opinions of third-party speakers, presenters or participants.

DOW JONES Channel Up on its strongest Support.Dow Jones (DJI) has been trading within a Channel Up since the April 25 Low and right now it is consolidating straight after a direct contact and bounce on the 1D MA50 (blue trend-line).
Given that this also took place at the bottom of the Channel Up, it is a technical Higher Low formation, thus the strongest Support level possible.
With the 1D RSI also rebounding around the same level as the previous Higher Low, we expect the next technical Bullish Leg of the Channel Up to begin. The previous two rose by at least +7.00%, so the minimum Target we are looking for on the short-term is 46350.
-------------------------------------------------------------------------------
** Please LIKE 👍, FOLLOW ✅, SHARE 🙌 and COMMENT ✍ if you enjoy this idea! Also share your ideas and charts in the comments section below! This is best way to keep it relevant, support us, keep the content here free and allow the idea to reach as many people as possible. **
-------------------------------------------------------------------------------
Disclosure: I am part of Trade Nation's Influencer program and receive a monthly fee for using their TradingView charts in my analysis.
💸💸💸💸💸💸
👇 👇 👇 👇 👇 👇

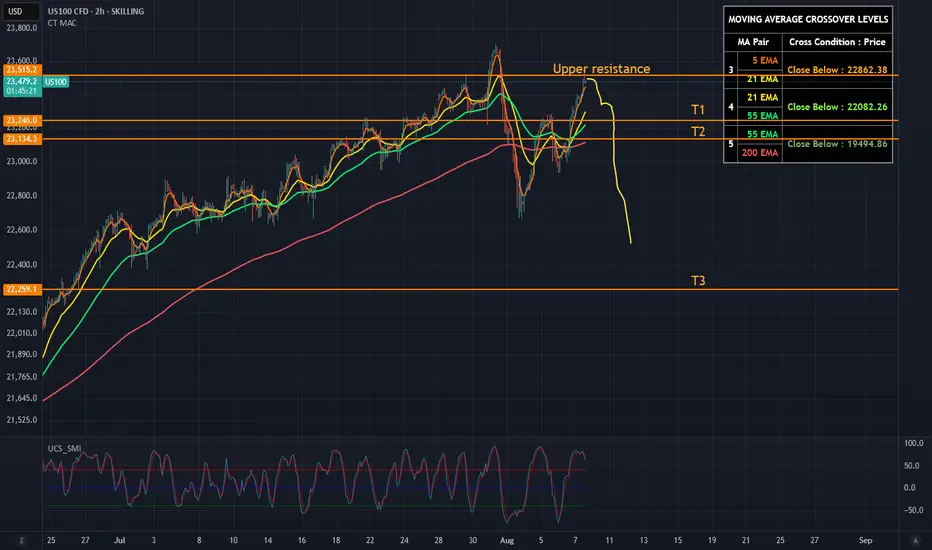
US100: Near All Time Highs, Weak FoundationThe Nasdaq 100 (US100) is hovering near all-time highs (~23,500), but signs of exhaustion are mounting. Momentum is fading, RSI is overstretched, and volume has been declining - all classic symptoms of a tired rally.
From a technical perspective, the index is pressing against upper trendline resistance after an aggressive multi-week run. Price action shows weakening follow-through on each new high, hinting at buyer fatigue. Best example was the huge sell-out last week.
Fundamentally, the rally is losing its foundation:
- Earnings surprises from Big Tech (Apple, Shopify) are already priced in.
- AI hype is cooling off, and valuation multiples remain extreme.
- Macro data (ISM Services, jobs) suggest economic softness.
- Fed rate cut hopes are baked in — any disappointment could trigger a sharp repricing.
Conclusion for me:
The Nasdaq looks ripe for a pullback.
We may possibly see a short spike above my drawn "upper resistance line" but I'm pretty convinced we won't see new ATH, - in my opinion it would be just a stop hunt.
If 23,000 then breaks, watch for acceleration toward 22,500 and beyond. The air is thin up here.
T1: 23250
T2: 23100
And if we get the break - I see T3 - 22250
One unpredictable variable, though? The world’s leaders.
Their "creative" decision-making has the power to nuke any technical setup.
Markets may follow charts and earnings - until a politician wakes up and chooses chaos.
No trading advice, just my ideas. :)
US2000 Bearish Alert: Institutional Shorts Spike 300%, TechnicalInstitutional Sentiment Shift
Net short interest exploded from –30K in early July to –90K by early August—a 300% jump in bearish conviction.
Daily Chart:
On August 1, US2000 closed below key support, carving a lower low—the first technical indication of a bearish reversal.
Weekly Chart:
A clear bearish engulfing candlestick reinforces the likelihood of further downside.
Macro & Market Backdrop:
• The Fed remains hawkish, quashing near-term rate cut expectations.
Reuters
• Small-caps continue to underperform—Russell trades rich but offers less structural strength compared to large-caps.
MarketWatch
• With stagflation risks rising, small/mid-cap companies could face underperformance and tighter financing conditions.
MarketWatch
Bottom Line:
With institutional short positioning intensifying, market structure turning bearish, and macroeconomic challenges mounting, the US2000 is poised for further pressure. Traders—watch for follow-through declines.

SP500 | Short | 3hrsThis technical analysis is for informational and educational purposes only. It does not constitute financial advice. Remember to always research and consult with a professional before making investment decisions. Good luck! 📈💼🚀
Strong sell NAS100We are looking for a drop on H1 time frame
H1 , H30 ,h4 already overbought pair
Selling area looking strong enough to change the trend shortly

Watching July 31 High and August 1 Low - Key LevelsUS Inflation Next Week (CPI and PPI)
Will August re-test highs with momentum? Or test and fade?
MAGS back to highs.
AAPL has one of the best weeks since 2020's post covid crash recovery (WILD).
I still like long assets, but playing the game with discipline and patience.
Enjoy the weekend. Looking forward to the grind next week.
Thanks for watching!!!
-Chris

DXY Trend AnalysisTechnicals:
The DXY is sitting near its pivot, with technical momentum remaining mildly bearish, but oversold conditions suggest a potential for a bullish bounce. If the 97.55 support is broken decisively, further downside is likely. Upside is capped by resistance at 98.64; a break above this may confirm a short-term reversal to the upside.
Key Levels to Watch
Pivot Level: 98.12
Key Support: 97.55
Key Resistance: 98.64
Fundamentals:
- Persistent US twin deficits, reduced safe-haven flows, and a global trend of diversifying away from dollar assets all present headwinds.
- The spread between US yields and foreign peers is at historic highs, but with the Fed expected to ease and global growth forecasts improving, the dollar's advantage is eroding.
- Safe-haven demand could temporarily support the dollar in response to global shocks, but is not expected to reverse the broader downtrend this year.
Analysis by Terence Hove Senior Financial Markets Strategist at Exness

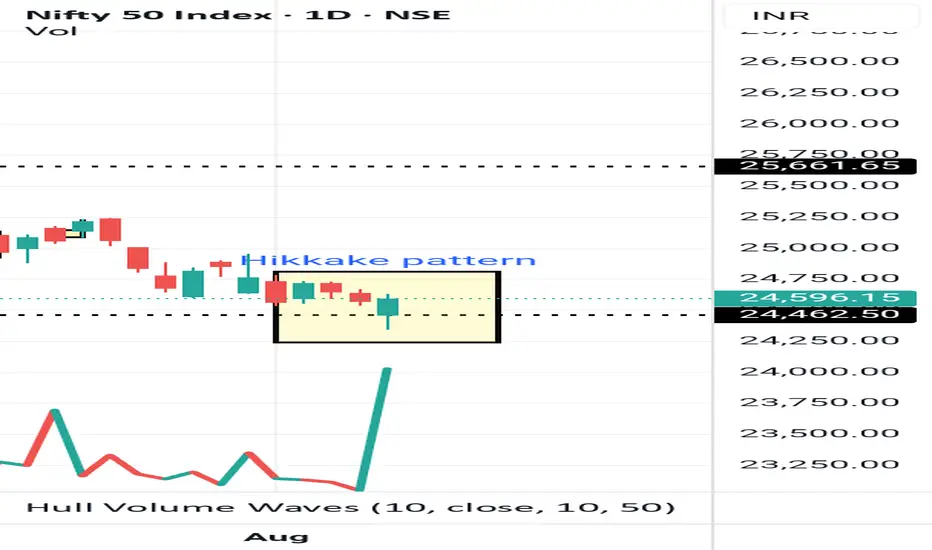
Nifty hikkake pattern.Nifty 24596 has given an excellent example for hikkake pattern to trap call writers.
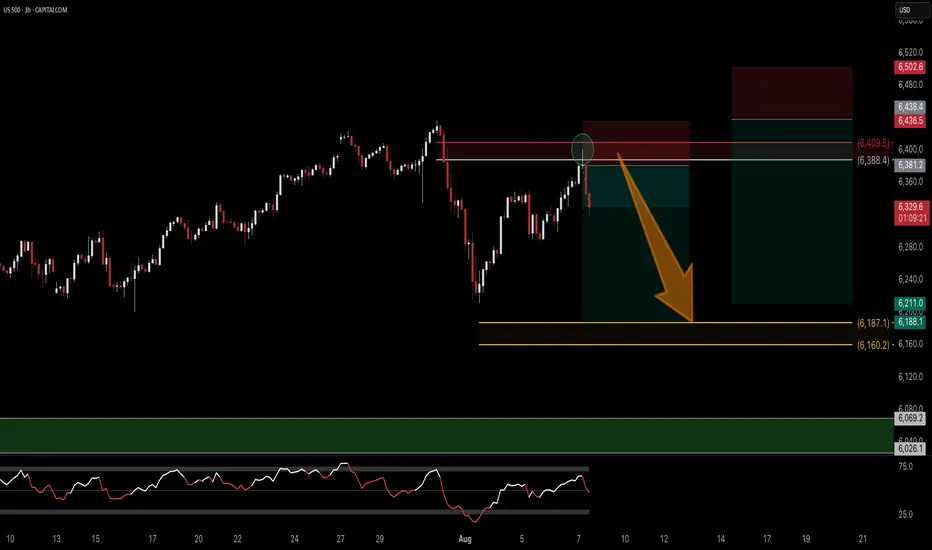
SPX500 at Key Pivot – Bearish Below 6365, Bullish AboveSPX500 – Market Overview
U.S. stock index futures rose on Friday after President Donald Trump’s temporary pick for a Federal Reserve governor boosted expectations for a more dovish central bank board.
Technical Outlook
Stability below 6365, we expect a move down toward 6341.
A 1H close below 6321 would likely extend the bearish trend toward 6301.
A 1H close above 6365 could trigger a push toward 6389.
A confirmed break above 6389 would shift the bias to bullish, targeting 6425 and 6453.
Pivot Line: 6365
Resistance: 6389 – 6425 – 6453
Support: 6341 – 6321 – 6301

