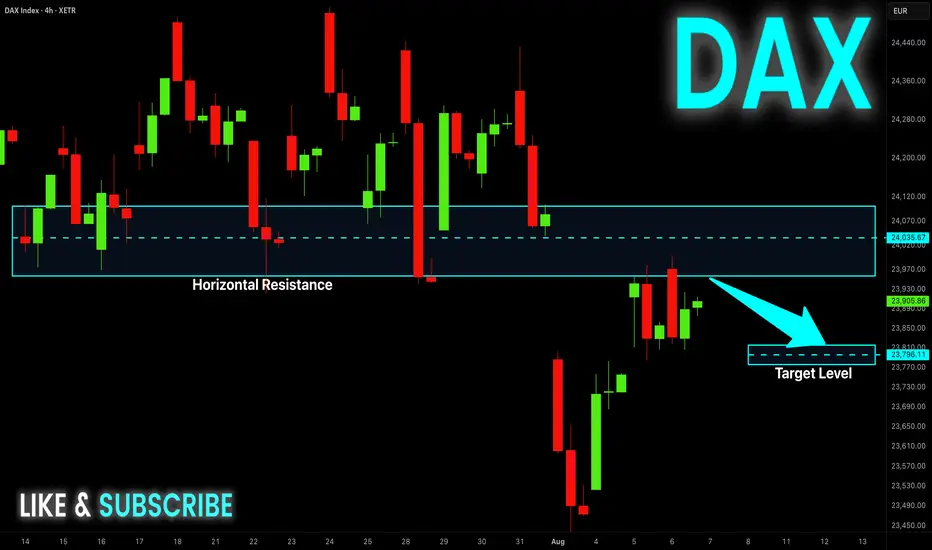
DAX Potential Short! Sell!
Hello,Traders!
DAX went up nicely
But is now about to hit
A horizontal resistance
Around 24,000 so after
The retest we will be
Expecting a local pullback
Sell!
Comment and subscribe to help us grow!
Check out other forecasts below too!
Disclosure: I am part of Trade Nation's Influencer program and receive a monthly fee for using their TradingView charts in my analysis.
Market indices
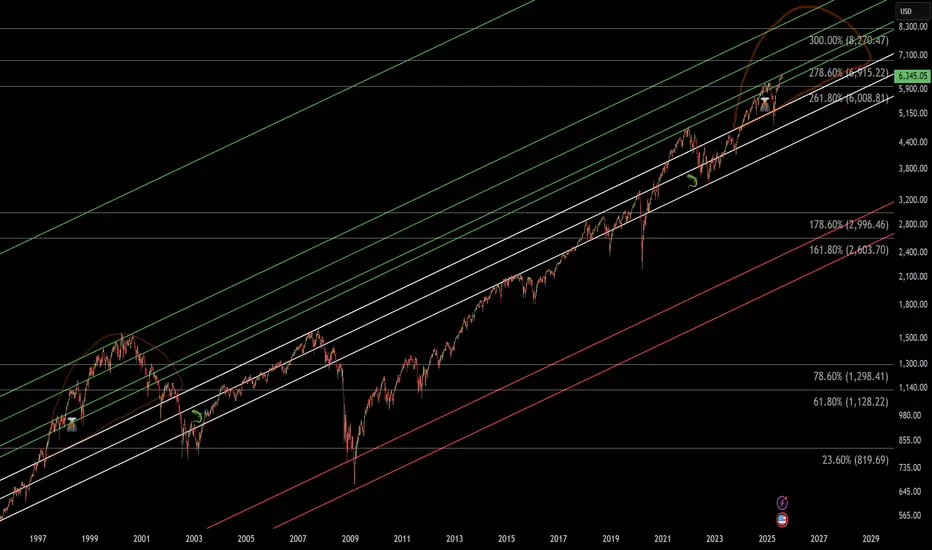
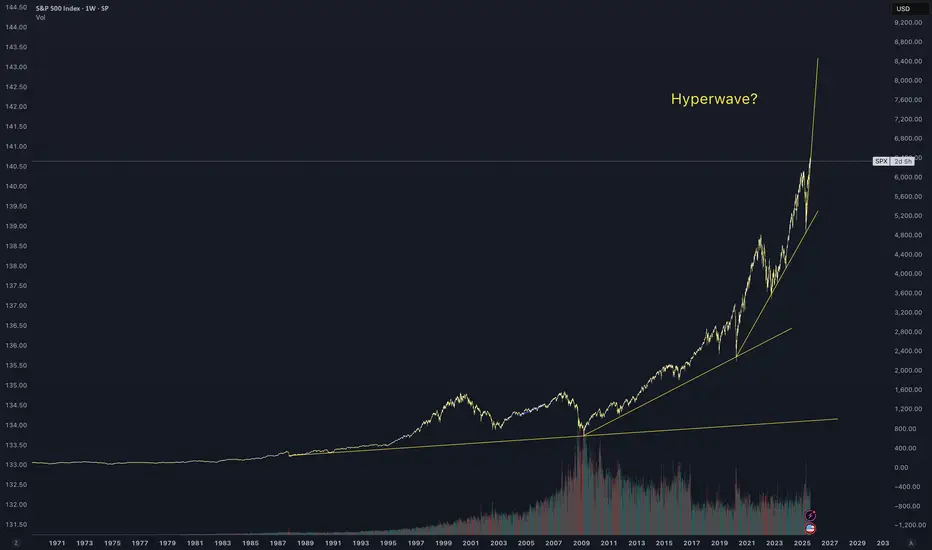
SPY - Final InningTo understand where you're headed you must understand where you came from
Marketwide history in the making
Nikkei primary trend remains bullish.NIK225 - 24h expiry
Price action continues to trade around significant highs.
The primary trend remains bullish.
20 1day EMA is at 40385.
We look for a temporary move lower.
Dip buying offers good risk/reward.
We look to Buy at 40405 (stop at 40105)
Our profit targets will be 41305 and 41455
Resistance: 40895 / 41043 / 41315
Support: 40635 / 40375 / 40000
Risk Disclaimer
The trade ideas beyond this page are for informational purposes only and do not constitute investment advice or a solicitation to trade. This information is provided by Signal Centre, a third-party unaffiliated with OANDA, and is intended for general circulation only. OANDA does not guarantee the accuracy of this information and assumes no responsibilities for the information provided by the third party. The information does not take into account the specific investment objectives, financial situation, or particular needs of any particular person. You should take into account your specific investment objectives, financial situation, and particular needs before making a commitment to trade, including seeking, under a separate engagement, as you deem fit.
You accept that you assume all risks in independently viewing the contents and selecting a chosen strategy.
Where the research is distributed in Singapore to a person who is not an Accredited Investor, Expert Investor or an Institutional Investor, Oanda Asia Pacific Pte Ltd (“OAP“) accepts legal responsibility for the contents of the report to such persons only to the extent required by law. Singapore customers should contact OAP at 6579 8289 for matters arising from, or in connection with, the information/research distributed.


Us30S30 is currently respecting a key support zone, showing strong buyer interest. As long as this level holds, the bias remains bullish, with potential for price to push higher toward the next resistance levels.
NAS100 at mjaor resistance area Fib 0.5Price has reached the 0.5–0.382 Fibonacci retracement zone of the recent swing. If the bears are strong, we may see a rejection toward the trendline support. However, if this resistance is broken, a bullish continuation is also possible. Let's see how it plays out.

NAS100 - Higher Right FootDear Friends in Trading,
How I see it,
Outcome = "VERY STRONG BULLISH STRUCTURE"
Price retraced back into discount and formed a higher right foot.
Keynote:
1)This means if the current resistance area is breached decisively,
The potential for new HH's and/or new ATH's in this case is very high
2) If resistance offer multiple higher TF rejections the structure can fail.
In this case I feel it is the less likely outcome
I sincerely hope my point of view offers a valued insight
Thank you for taking the time study my analysis.

Nasdaq Pumping High, We Might Ride The WavePrice today(Wed) is recovering from yesterday's (Tue) dumping. Our bullish direction is still intact.
Entries should be taken once, price has entered within our Area of Opportunity.
Targets with their success rate have been outlined on the charts.

DXY ANALYSIS Levels outlined at the start of the week have been reached. Let's see how price reacts here

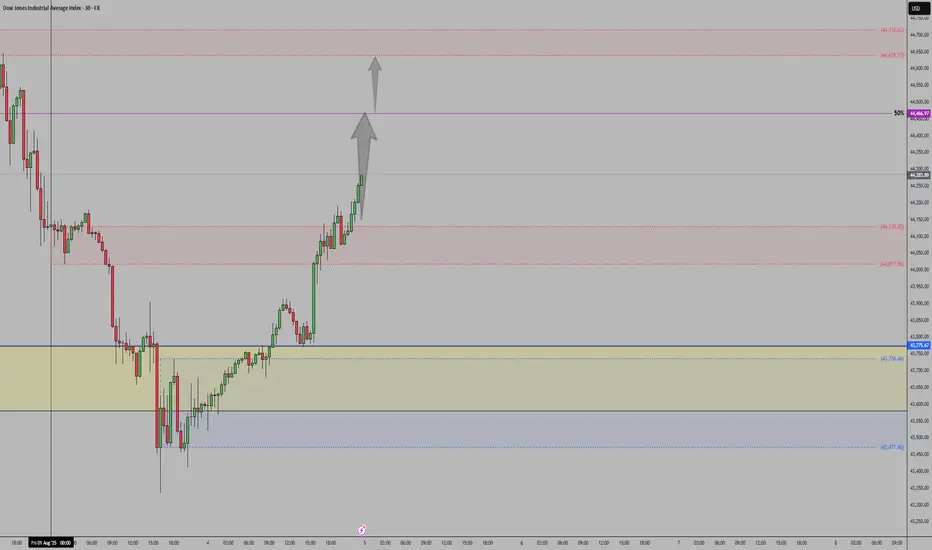
US30: Bulls Are Winning! Long!
My dear friends,
Today we will analyse US30 together☺️
The market is at an inflection zone and price has now reached an area around 44,197.65 where previous reversals or breakouts have occurred.And a price reaction that we are seeing on multiple timeframes here could signal the next move up so we can enter on confirmation, and target the next key level of 44,301.05.Stop-loss is recommended beyond the inflection zone.
❤️Sending you lots of Love and Hugs❤️

Behold the grand NAS100 short expeditionBehold the grand NAS100 short expedition, unleashed by my top-secret pyramidal formula (concealed in golden tombs and guarded by laser-eyed sphinxes):
Pharaoh’s Pivot Points
– We superimpose recent NAS100 peaks onto the Great Pyramid’s four secret chambers. When price breaches the “Upper Antechamber Zone” near 23,300, the ibis-headed guardian squawks—our signal to draw the short sword.
Oracular Sphinx Sentiment
– We feed Fed minutes hieroglyphs and mega-cap earnings scrolls into the Sphinx’s riddle engine. If the answer murmurs “overheating” or “tech fatigue,” it confirms our bearish quest.
Ra’s Wall-Street Candle Filter
– Only candles closing between 09:30–16:00 ET count as true “New York sun-blessed bars.” Any rogue moves in the witching hour? Mirage dust—ignored.
Anubis’ Volume Veil
– Volume spikes are weighed in pharaoh-ounces of pure gold. When daily turnover eclipses 30,000 pharaoh-ounces, the Underworld Flush ritual begins—time to tighten our longs… er, shorts.
Tomb-Run Trend Confirmation
– Trendlines aren’t drawn from ordinary swing highs; we connect the three sacred glyph-points carved into the sarcophagus walls. Once that “Tomb-Run Downtrend” appears, we descend into the dark.

Dollar dropWith the break of the ascending channel's bottom, the price is expected to reach the bottom of the range.
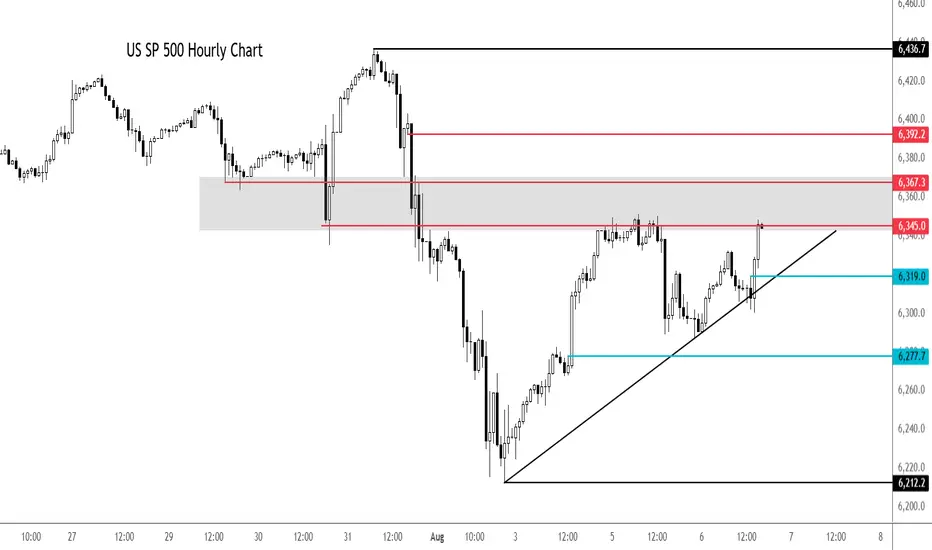
S&P 500 extends rally despite macro concernsThe 5% Apple rally aside, it is all about rate cut bets vs. strong earnings. So far, the latter has helped to keep US markets supported near all-time highs. But if macro concerns increase further, investors' perception about future earnings growth will weaken. And with that, we could see some cracks in expensive stocks.
Looking at the hourly chart of the SPX500, the US benchmark was testing a potential resistance zone in the shaded region between 6345 to 6367, an area which was previously support. Above this zone, 6392 is the next level of potential resistance and then the all-time high of 6436 comes into focus next.
earlier, the index bounced after a failed breakdown below the trend line shown on the chart. Another potential test of the trendline could see the index break lower. Short-term support is seen around 6319 then 6277.
By Fawad Razaqzada, market analyst with FOREX.com
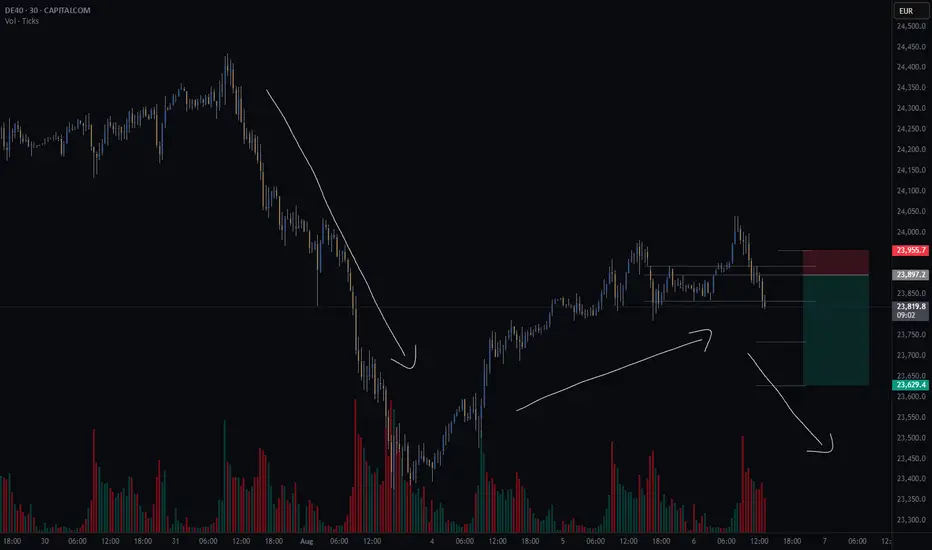
GER40CASH (DE40) - potential short - HSThere is a potential head and shoulders continuation pattern.
What I like about this setup is the GER40 is potentially creating a bear flag.
Finding a continuation pattern within the bear flag, like the head and shoulders, is a great entry point for the second part of the downward move.
Still waiting for my system to confirm some variables before I take the trade.
Risk/reward = 4.3
Entry price = 23 905.3
Stop loss price = 23 955.4
Take profit level 1 (50%) = 23 733
Take profit level 2 (50%) = 23 628
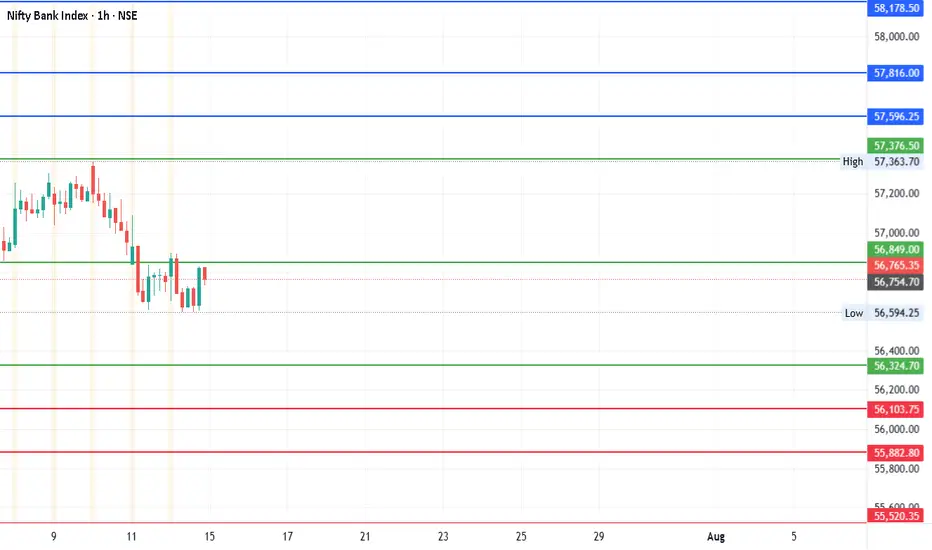
#BankNifty Weekly: Major Levels & Targets You Need to KnowDate: 14-07-2025
#Nifty Bank Technical Levels
Current Price: ₹56,765.35
Pivot Point: ₹56,849.40
Upside Targets (if price moves above Pivot)
| Target | Price |
| ----------- | ---------- |
| 🎯 Target 1 | ₹57,596.25 |
| 🎯 Target 2 | ₹57,816.00 |
| 🎯 Target 3 | ₹58,178.48 |
| 🎯 Target 4 | ₹58,540.95 |
🔽 Downside Targets (if price drops below Pivot)
| Target | Price |
| ----------- | ---------- |
| 🎯 Target 1 | ₹56,103.76 |
| 🎯 Target 2 | ₹55,882.80 |
| 🎯 Target 3 | ₹55,520.33 |
| 🎯 Target 4 | ₹55,157.85 |
🛑 Support & Resistance Levels
Support: ₹56,324.71
Resistance: ₹57,376.51
Observations:
Since the current price is below the pivot (₹56,849.40), immediate bearish bias could be assumed unless a strong reversal happens.
A break below ₹56,324.71 (Support) could trigger the downside targets.
Conversely, crossing back above the pivot may shift bias to bullish, targeting the resistance and beyond.
#TradingView #Stocks #Equities #StockMarket #Investing #Trading #Nifty
#TechnicalAnalysis #StockCharts #Finance #BankNifty #NiftyBank #WeeklyAnalysis
US500 Market Insight US500 Market Insight
The US500 continues to demonstrate resilience amid a complex macroeconomic backdrop, trading around 6,388 at mid-session today. This represents a modest 0.40% recovery from the previous close of 6,299, signaling improving investor sentiment despite ongoing market headwinds.
Fundamental Outlook: Market Resilience Amid Volatility
After a stretch of choppy trading sessions driven by mixed U.S. economic data and escalating tariff concerns, the index has regained its footing above the psychologically important 6,300 support level. This bounce reflects investor confidence in the broader market’s fundamentals, particularly in the face of global policy uncertainties.
Strong Corporate Earnings as a Key Driver
Earnings season has delivered notable upside surprises, particularly in the technology, consumer discretionary, and financial sectors. Positive forward guidance and robust profit margins have underpinned the index’s strength, helping offset negative sentiment from trade related headlines and slowing global demand in select sectors.
Dovish Federal Reserve Expectations
Markets are increasingly pricing in a more accommodative stance from the Federal Reserve, even as policymakers continue to stress a data dependent approach. With inflation surprising on the upside and NFP data coming out softer, this is reinforcing expectations for possible rate cuts later in 2025. This has eased pressure on equities and boosted appetite for risk assets.
Technical Outlook: Bullish Continuation
From a technical perspective, the US500 remains in a well defined long-term uptrend. Maintaining price action above 6,300 strengthens the case for further gains, with 6,400–6,500 seen as the next potential resistance zone. Keep watching for consolidation above 6,300 to confirm breakout momentum.
Key Risks and Market Sensitivities
Despite the positive bias, risks remain. The index remains highly sensitive to global trade developments, particularly US-China and US-EU tariff disputes. In addition, any shift in Fed tone or unexpected inflation data could trigger renewed volatility.
Conclusion
The US500’s current recovery reflects a careful balance of strong earnings, improving rate outlook, and technical support. While bullish sentiment persists, the path forward will likely remain data driven and headline sensitive, requiring traders to remain nimble. A sustained break above 6,400 could open the door to new highs later this quarter, but near-term volatility should not be discounted.
Analysis by Terence Hove, Senior Financial Markets Strategist at Exness
Nasdaq 100: Institutional Move Toward 22,680 Unfolding📊 Nasdaq 100 Smart Money Breakdown
Current Price: 22,103
Target Price: 22,680
🔼 Upside Potential: +577 points
The market is currently positioned for a premium retracement move after a recent liquidity sweep below short-term equal lows, which likely triggered sell-side liquidity. This setup hints at Smart Money Accumulation, with institutions entering long positions at discount pricing.
We're now seeing:
✅ Break of Structure (BOS) to the Downside
✅ Internal liquidity sweep
✅ Price reacting from a discounted OB (Order Block)
✅ Potential drive toward the next liquidity pool sitting above the 22,680 level.
This move aligns with a bullish market structure shift, suggesting Smart Money is engineering price higher to target buy-side liquidity above recent highs.
🎯 Target: 22,680 – a key liquidity area where Smart Money may look to offload positions.

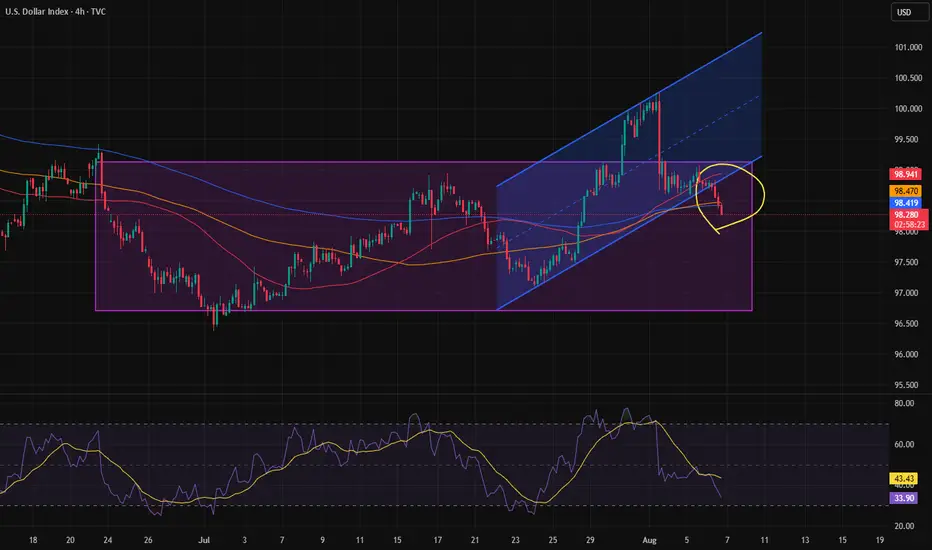
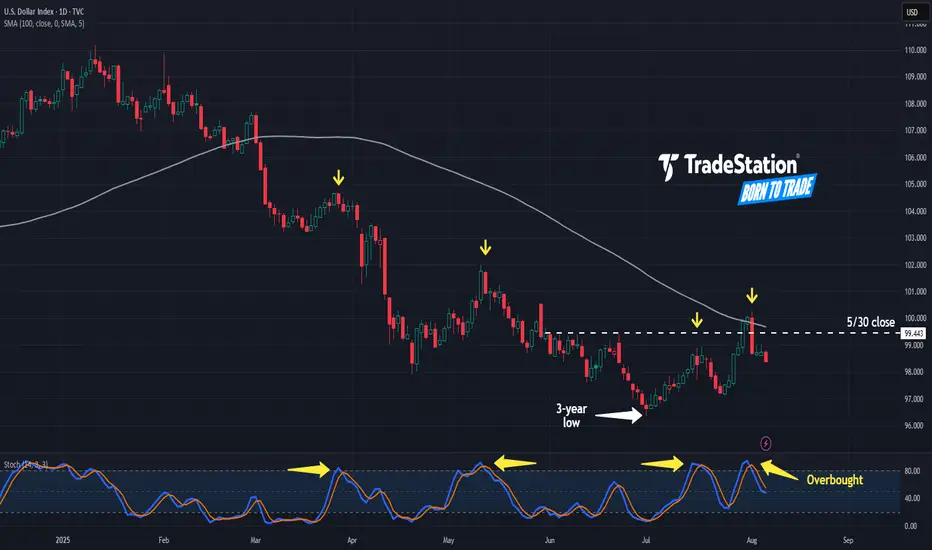
More Downside in the Greenback?The U.S. Dollar Index began 2025 with a dramatic slide. Now, after a period of consolidation, some traders may see further downside risk.
The first pattern on today’s chart is 99.443, the closing price for both a week and the entire month of May. DXY tested above the level between July 30 and August 1. It got rejected after the Labor Department revised payroll data lower. Has resistance been confirmed?
Second, the reversal occurred at the falling 100-day simple moving average. That may reflect bearishness over the longer term.
Third, stochastics have dropped from an overbought condition. Notice how those turns have occurred at other short-term peaks (marked in yellow).
Finally, traders may focus on news flow and catalysts with the White House expected to announce a replacement for Federal Reserve Governor Adriana Kugler this week.
TradeStation has, for decades, advanced the trading industry, providing access to stocks, options and futures. If you're born to trade, we could be for you. See our Overview for more.
Past performance, whether actual or indicated by historical tests of strategies, is no guarantee of future performance or success. There is a possibility that you may sustain a loss equal to or greater than your entire investment regardless of which asset class you trade (equities, options or futures); therefore, you should not invest or risk money that you cannot afford to lose. Online trading is not suitable for all investors. View the document titled Characteristics and Risks of Standardized Options at www.TradeStation.com . Before trading any asset class, customers must read the relevant risk disclosure statements on www.TradeStation.com . System access and trade placement and execution may be delayed or fail due to market volatility and volume, quote delays, system and software errors, Internet traffic, outages and other factors.
Securities and futures trading is offered to self-directed customers by TradeStation Securities, Inc., a broker-dealer registered with the Securities and Exchange Commission and a futures commission merchant licensed with the Commodity Futures Trading Commission). TradeStation Securities is a member of the Financial Industry Regulatory Authority, the National Futures Association, and a number of exchanges.
TradeStation Securities, Inc. and TradeStation Technologies, Inc. are each wholly owned subsidiaries of TradeStation Group, Inc., both operating, and providing products and services, under the TradeStation brand and trademark. When applying for, or purchasing, accounts, subscriptions, products and services, it is important that you know which company you will be dealing with. Visit www.TradeStation.com for further important information explaining what this means.
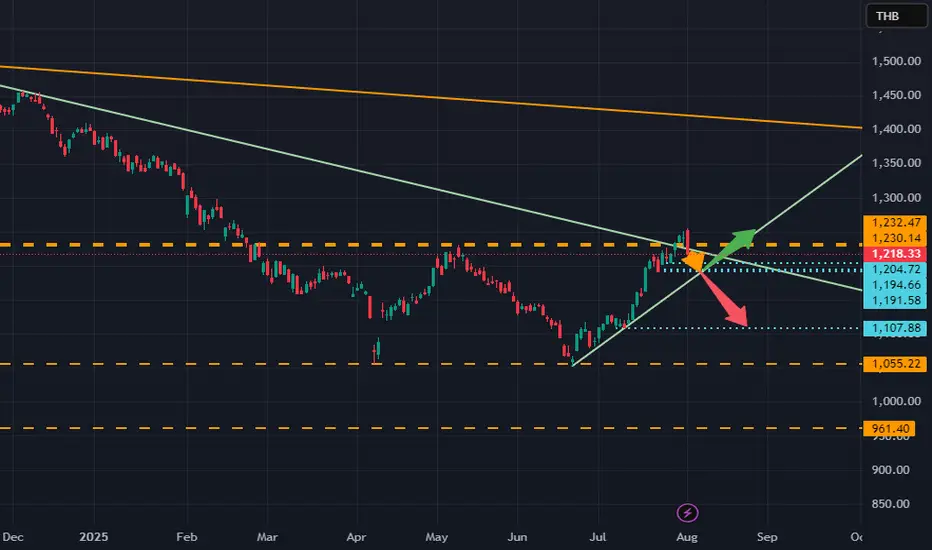
Analysis on SET INDEX: After the target hit, what comes nextDear All
Currently, SET INDEX has reached 1245- 1250 and on the first day, it can hold at this level.
However, once the tax news released, not only it fail to make new high, it fell drastically.
As a result, it can be concluded that the upward momentum is now ceased.
Also, with the big red, the set is entering the new stage.
the case is as followed,
1. most likely went down to around 1190-1200.
After which it should either
1.1 can hold at 1190-1200 and go back to retest the high 1250 once more
1.2 can not hold at 1190, it should be expected to 1110.
Best of luck
Not a trading advise.
Trader PP
SPX BUY SPOT 8/61h had a unicorn setup I seen forming yesterday. Today I got on just after 7:30 am and saw price inside POI/IPA. All it did was WICK that gap, not fill it. I went against the 4h and 1h candles both being bearish because price reacted to the OPEN of the FVG. This makes it risky because we could still fill and sweep below that wick. Just had a little FOMO this morning once the reaction happened. No major news until tomorrow. I love the sweet spot where price is. Perfect HL area on 1 hour even tho we can sweep lower again, we shall see!


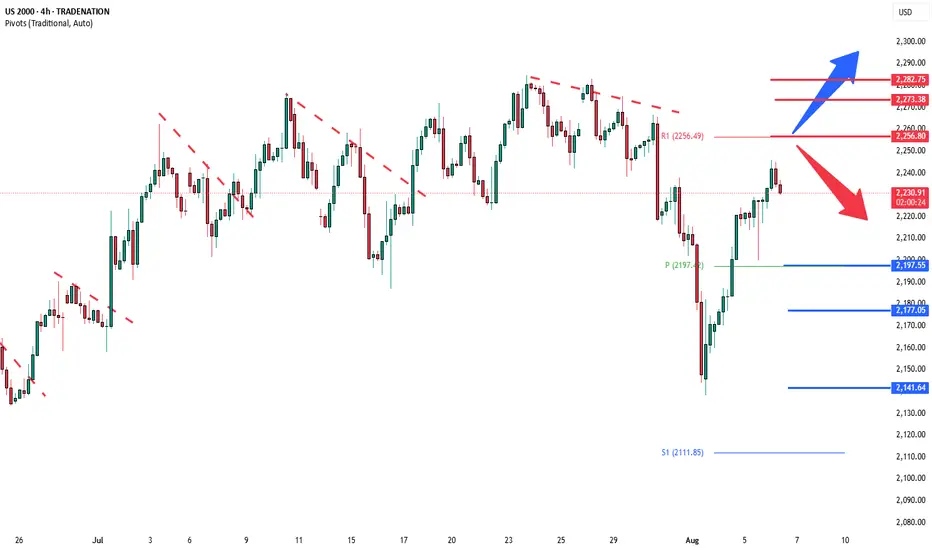
Russell2000 Key Trading LevelsKey Support and Resistance Levels
Resistance Level 1: 2256
Resistance Level 2: 2273
Resistance Level 3: 2282
Support Level 1: 2200
Support Level 2: 2177
Support Level 3: 2140
This communication is for informational purposes only and should not be viewed as any form of recommendation as to a particular course of action or as investment advice. It is not intended as an offer or solicitation for the purchase or sale of any financial instrument or as an official confirmation of any transaction. Opinions, estimates and assumptions expressed herein are made as of the date of this communication and are subject to change without notice. This communication has been prepared based upon information, including market prices, data and other information, believed to be reliable; however, Trade Nation does not warrant its completeness or accuracy. All market prices and market data contained in or attached to this communication are indicative and subject to change without notice.