Market indices

FR40 Bullish Structure | Smart Pullbacks in Control🔷 FR40 / CAC40 — FRANCE 40
📊 Index Market Capital Flow Blueprint (Swing Trade)
🧭 Market Bias
🟢 Bullish Structure Confirmed
Price continues to respect the Triangular Moving Average (TMA) with multiple clean pullbacks, signaling sustained institutional accumulation and healthy trend continuation.
🧠 Trade Plan Logic
📐 Triangular Moving Average = Dynamic Support
Multiple pullback reactions 🧲
Higher-timeframe trend intact 📈
Momentum maintained above structure 🏗️
This behavior typically reflects smart-money re-entries, not retail chasing.
🎯 Entry Strategy (Layered Execution)
🔹 Entry Style: Any price level (Layered accumulation approach)
🧱 Buy Limit Layers (Example):
8070
8100
8125
8150
📌 You may increase or adjust layers based on your own execution model.
🛑 Risk Management
🔻 Stop Loss: 8000
⚠️ This is a reference level, not a mandate.
Always align risk with your capital, timeframe, and psychology.
🎯 Target Zone
🚨 8300 Area
Strong resistance cluster 🧱
Overbought conditions ⚠️
Trap & correction probability increases 📉
💡 Recommendation: Scale out profits — do not overstay.
📝 Important Note
🔔 This plan is not financial advice.
Every trader must manage entries, SL, and TP independently based on their own risk framework.
🔍 Related Markets to Watch (Correlation Guide)
🇺🇸 US30 ( TVC:DJI )
Strong positive correlation with FR40
Risk-on flows into US equities often spill into European indices
🇩🇪 GER40 ( XETR:DAX )
Closest structural correlation
German industrial strength frequently leads CAC40 direction
🇺🇸 SPX500 ( SP:SPX )
Global risk sentiment benchmark
Sustained SPX strength supports European index continuation
🇺🇸 EUR/USD ( FX:EURUSD )
Rising EUR can cap upside in FR40 due to exporter pressure
Weak EUR often supports French equities
🧠 Key Takeaway
📌 Trend is bullish until structure breaks.
Respect the moving average, manage risk, and let the market pay you — not emotions.
👍 If this analysis adds value, LIKE • COMMENT • FOLLOW for more institutional-style setups.

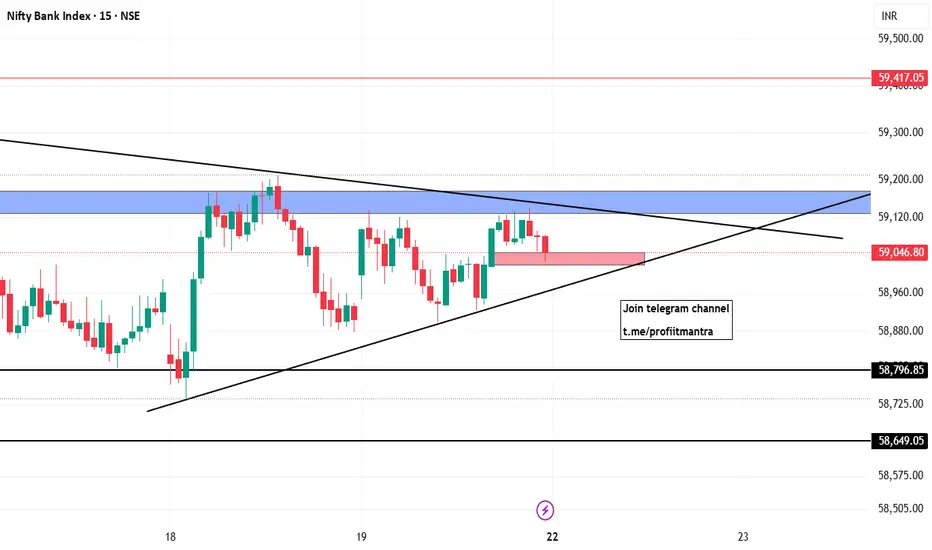
BankNifty Index Chart Analysis for MondayThis chart analysis for Monday 22 December 2025
here 15 minutes time frame chart analysis that is also help in 5 minutes time frame
Imortant Note: Lines/Boxes for Support & Resistance.
Thank You for support with Boost/Follow
Regards
PROFIT MANTRA
Nifty 50 Chart Ananlysis for MondayThis chart analysis for Monday 22 December 2025
here 15 minutes time frame chart analysis that is also help in 5 minutes time frame
Imortant Note: Lines/Boxes for Support & Resistance.
Thank You for support with Boost/Follow
Regards
PROFIT MANTRA

DJI SELLGiven the divergence and price patterns and price support, you would expect the price to make this move.

Germany 40 Bullish Bias | Buy the Dip Strategy📌 GER40 / DAX40 — Germany 40 Bullish Swing Trade Playbook
🇩🇪 ASSET OVERVIEW
📊 GER40 / DAX40 (Germany 40 Index)
🕰️ Trade Type: Swing Trade
💼 Market: European Equity Index CFD
🔍 The DAX40 represents Germany’s top 40 blue-chip companies, making it highly sensitive to:
🇪🇺 Eurozone economic sentiment
🏭 Industrial & export demand
🇺🇸 US equity market direction
🧠 MARKET STRUCTURE ANALYSIS
🟢 Overall Bias: BULLISH
📈 Why Bullish?
✅ Higher highs & higher lows intact
✅ Price holding above key dynamic support
✅ Buyers stepping in on every dip
📌 This confirms trend continuation, not reversal.
📉 TECHNICAL CONFIRMATION
📐 Indicator Used: HULL Moving Average (HMA)
🔑 Why HULL MA matters?
⚡ Faster than EMA & SMA
📊 Reduces lag during strong trends
🔁 Excellent for pullback entries
🟢 Current Condition:
✔️ Price has pulled back into the HULL MA
✔️ No structure break
✔️ Indicates healthy correction, not weakness
🎯 ENTRY STRATEGY (DETAILED)
📌 Entry Method: Any Price Level (Layering Allowed)
🧩 Thief Strategy – Layered Buy Orders
This strategy spreads risk and improves average entry.
🟢 Buy Limit Layers
🟩 23900
🟩 24000
🟩 24100
🟩 24200
📌 Why Layering Works?
🧠 Reduces emotional entries
📉 Handles volatility smoothly
📊 Improves risk-to-reward ratio
⚠️ You may add or reduce layers depending on capital size and risk rules.
🛑 STOP LOSS LOGIC
🔴 Reference Stop Loss: 23700
🧠 Why this level?
📉 Below recent swing structure
❌ Break below = bullish structure invalid
🛡️ Protects capital if trend fails
⚠️ Important Reminder
❗ This SL is not mandatory
❗ Adjust SL based on:
Account size
Risk percentage
Personal strategy
🏁 TARGET & EXIT ZONE
🎯 Primary Target: 24700
🚨 Why Take Profits Here?
🚓 “Police Force Zone” → Strong historical resistance
📊 Overbought conditions expected
High probability of bull trap / profit booking
📌 Smart traders exit into strength, not greed.
🔗 RELATED MARKETS & CORRELATION ($ WATCHLIST)
🇺🇸 US30 / Dow Jones
🔗 Strong Positive Correlation
Both driven by industrial & manufacturing sectors
Dow strength = confidence for DAX upside
🇺🇸 NAS100
⚡ Risk-On Indicator
Tech rallies improve global risk sentiment
Supports European indices indirectly
🇫🇷 FRA40
🌍 Regional Confirmation
Confirms broader Eurozone equity strength
Weak FRA40 = caution for DAX longs
💶 EUR/USD
💱 Inverse Sensitivity
📈 Strong EUR → pressure on German exporters
📉 Weak EUR → boosts DAX upside
📌 Always monitor EUR moves before major DAX pushes.
⚠️ RISK DISCLOSURE
❗ This idea is educational, not financial advice
❗ SL & TP are reference levels only
❗ You control your own risk & execution
👍 ENGAGEMENT CALL
💙 Like if this helps
💬 Comment your bias
⭐ Save for later
🔔 Follow for structured index setups

US30 Price consolidation bearish momentumUS30 Dow Jones price action within a rising channel structure. The index has respected the ascending trendline multiple times, confirming an overall bullish trend in recent weeks.
After reaching a local high near the upper boundary of the channel, price began to show signs of weakness and consolidation. The current movement suggests a potential corrective pullback, with price struggling to hold above key resistance zones around 48,200–48,500.
Technically price, possibly forming a lower high before a stronger bearish continuation. Key downside targets are 47,500 to 47,000 Current trend exhaustion phase, with increasing probability of a corrective move toward lower support levels before any potential trend continuation.
You may find more details in the chart,
Trade wisely best of luck Buddies.
Ps; Support with like and comments for better analysis thanks for supporting.

JP225 - Long I know what happend to Turkeys stockmarket. I think the same thing will happen this time with Japan.

USNAS100 looking bearish await for reversal trend lineUS100 trading within a broader consolidation range after a strong prior uptrend. Price previously respected an ascending trendline, but the recent breakdown below this structure signals weakening bullish momentum.
Currently, price is attempting a minor rebound, but remains capped below the former trendline area, which now acts as dynamic resistance. This suggests the rebound may be corrective rather than the start of a new uptrend.
If price fails to reclaim the consolidation zone, a bearish continuation toward the highlighted support levels becomes increasingly likely. A decisive break below 24,403 could accelerate downside pressure toward 24,000.
You may find more details in the chart,
Trade wisely best of luck buddies.
Ps; Support with like and comments for better analysis thanks for supporting.

Short Opportunity On US30 Dow According to Fibonacci retracement
According to Divergence on chart with CCI
According to uptrendline channel
According to Price Action

DowJones Key trading levelsKey Support and Resistance Levels
Resistance Level 1: 48710
Resistance Level 2: 48880
Resistance Level 3: 49100
Support Level 1: 47680
Support Level 2: 47480
Support Level 3: 47280
This communication is for informational purposes only and should not be viewed as any form of recommendation as to a particular course of action or as investment advice. It is not intended as an offer or solicitation for the purchase or sale of any financial instrument or as an official confirmation of any transaction. Opinions, estimates and assumptions expressed herein are made as of the date of this communication and are subject to change without notice. This communication has been prepared based upon information, including market prices, data and other information, believed to be reliable; however, Trade Nation does not warrant its completeness or accuracy. All market prices and market data contained in or attached to this communication are indicative and subject to change without notice.

NSDQ100 Resistance retest at 25370Key Support and Resistance Levels
Resistance Level 1: 25370
Resistance Level 2: 25660
Resistance Level 3: 25866
Support Level 1: 24820
Support Level 2: 24640
Support Level 3: 24430
This communication is for informational purposes only and should not be viewed as any form of recommendation as to a particular course of action or as investment advice. It is not intended as an offer or solicitation for the purchase or sale of any financial instrument or as an official confirmation of any transaction. Opinions, estimates and assumptions expressed herein are made as of the date of this communication and are subject to change without notice. This communication has been prepared based upon information, including market prices, data and other information, believed to be reliable; however, Trade Nation does not warrant its completeness or accuracy. All market prices and market data contained in or attached to this communication are indicative and subject to change without notice.

Mini Trend Breakout for Nifty. With a resistance nearyby. Nifty gave a strong comeback candle on Friday with FII and DIIs both turning buyers for second straingt day and close at 25966. There is a resistance nearby if that is crossed we can have an upside. The resistnace nearby for Nifty is at 25980. If we get a closing above it next week, Nifty can sail towards next resistances 26120, 26223, 26339, 26533 and finally the trend top resistnace which is near 26651. Supports for Nifty remain near 26774 (Major mother line support), 25701, 25363, 25115 and finally Father line support is near 24992.
There is a mini trend break put as well within an overall bullish trend. Broader market may also catch up soon as many stocks are near their support or are crossing near to cross Mother father line resistances. Shadow of the candle as of now is positive.
Disclaimer: The above information is provided for educational purpose, analysis and paper trading only. Please don't treat this as a buy or sell recommendation for the stock or index. The Techno-Funda analysis is based on data that is more than 3 months old. Supports and Resistances are determined by historic past peaks and Valley in the chart. Many other indicators and patterns like EMA, RSI, MACD, Volumes, Fibonacci, parallel channel etc. use historic data which is 3 months or older cyclical points. There is no guarantee they will work in future as markets are highly volatile and swings in prices are also due to macro and micro factors based on actions taken by the company as well as region and global events. Equity investment is subject to risks. I or my clients or family members might have positions in the stocks that we mention in our educational posts. We will not be responsible for any Profit or loss that may occur due to any financial decision taken based on any data provided in this message. Do consult your investment advisor before taking any financial decisions. Stop losses should be an important part of any investment in equity.

Spx lowerI'm in the hospital and using the app to trade. Hopefully I'll be out of here today or tomorrow.
I think it's a short from here 10:05 Eastern. If they continue rallying the rest of today, I'm wrong. From here we should test and possible break the lows.
Good luck 🤞

NAS100 BULLISH PRICE DELIVERYNas100 has shown Bullish momentum and right we have a lot of Buyside Liquidity lying around 25843 level.
That is our significant potential draw for the coming week or so.
Waridi GhostPips

The SPX500 and Bitcoin are going to crash.Why?
This is a messy chart, but the economy is simple.
Japan's interest rate hike and the U.S. interest rate drop mean a decline is inevitable,
especially with high margin debt in equities.
Everything is on the verge of a major mid-term crash. This is not financial advice.

NAS100 Trade Set Up Dec 19 2025Price is making HL on the 1h so if price first sweeps London highs/PDH then comes to sweep SSL/London lows or Asia Lows i will then look for internal 1m-5m IFVG/CISD to take buys higher to higher BSL and supply


US30 Trade Set Up Dec 19 2025Price is making HL on the 1h and has broken out of Asia highs so i will want to see a pull back to sweep London lows and tap into 1h FVG to then form 1-5m IFVG/CISD to go higher to PDH and supply

(NIFTY 50 – 2H timeframe)...Based on the chart my shared (NIFTY 50 – 2H timeframe):
📉 Bearish Targets
Target 1: 25,400 – 25,350
Target 2: 24,650 – 24,600
🔎 Reasoning
Price has broken the rising trendline
Trading below the cloud / resistance zone
Structure shows lower highs → bearish continuation
🛑 Invalidation / SL
If price sustains above 26,100, bearish view weakens

CREDIT CRISISWe are beginning to see evidence of a credit crisis starting. low demand for US bonds can trigger a currency crisis for the USD, higher rates will lead to refinancing company problems (especially with all the zombie companies that should have blown up over a decade ago.) and major economic depression-style job losses.
Currently, we are very early stages but things are moving at lightning speed on a macroeconomic level.
I know this is likely gibberish to most here pon trading view but it is of MASSIVE importance to your trading and investing.
CAUTION IS IN ORDER!!
Click boost, follow, and subscribe! I can help you navigate these crazy times.


FTSE Bullish sideways consolidation supported at 9750The FTSE remains in a bullish trend, with recent price action showing signs of a breakout within the broader uptrend.
Support Zone: 9750 – a key level from previous consolidation. Price is currently testing or approaching this level.
A bullish rebound from 9750 would confirm ongoing upside momentum, with potential targets at:
9900 – initial resistance
9930 – psychological and structural level
9960 – extended resistance on the longer-term chart
Bearish Scenario:
A confirmed break and daily close below 9750 would weaken the bullish outlook and suggest deeper downside risk toward:
9713 – minor support
9680 – stronger support and potential demand zone
Outlook:
Bullish bias remains intact while the FTSE holds above 9750. A sustained break below this level could shift momentum to the downside in the short term.
This communication is for informational purposes only and should not be viewed as any form of recommendation as to a particular course of action or as investment advice. It is not intended as an offer or solicitation for the purchase or sale of any financial instrument or as an official confirmation of any transaction. Opinions, estimates and assumptions expressed herein are made as of the date of this communication and are subject to change without notice. This communication has been prepared based upon information, including market prices, data and other information, believed to be reliable; however, Trade Nation does not warrant its completeness or accuracy. All market prices and market data contained in or attached to this communication are indicative and subject to change without notice.
