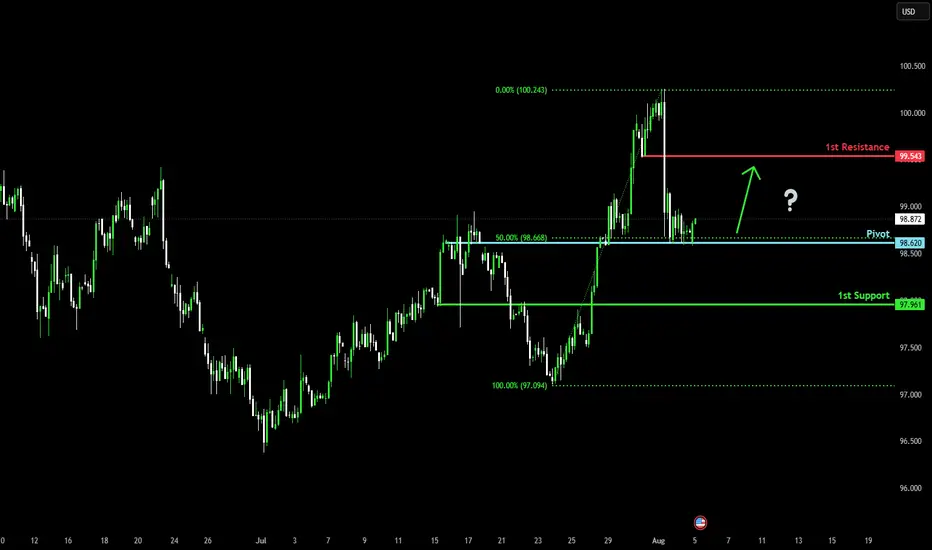
Bullish bounce off 50% Fibonacci support?US Dollar Index (DXY) is reacting off the pivot, which acts as a pullback support and could bounce to the 1st resistance.
Pivot: 98.62
1st Support: 97.96
1st Resistance: 99.54
Risk Warning:
Trading Forex and CFDs carries a high level of risk to your capital and you should only trade with money you can afford to lose. Trading Forex and CFDs may not be suitable for all investors, so please ensure that you fully understand the risks involved and seek independent advice if necessary.
Disclaimer:
The above opinions given constitute general market commentary, and do not constitute the opinion or advice of IC Markets or any form of personal or investment advice.
Any opinions, news, research, analyses, prices, other information, or links to third-party sites contained on this website are provided on an "as-is" basis, are intended only to be informative, is not an advice nor a recommendation, nor research, or a record of our trading prices, or an offer of, or solicitation for a transaction in any financial instrument and thus should not be treated as such. The information provided does not involve any specific investment objectives, financial situation and needs of any specific person who may receive it. Please be aware, that past performance is not a reliable indicator of future performance and/or results. Past Performance or Forward-looking scenarios based upon the reasonable beliefs of the third-party provider are not a guarantee of future performance. Actual results may differ materially from those anticipated in forward-looking or past performance statements. IC Markets makes no representation or warranty and assumes no liability as to the accuracy or completeness of the information provided, nor any loss arising from any investment based on a recommendation, forecast or any information supplied by any third-party.
Market indices
US Dollar Bottom: Don’t Rush InSince the beginning of the year, the US dollar (DXY) has been the weakest currency in the floating exchange market (FX). However, since mid-July, a technical rebound has begun, fueled by several fundamental factors, notably the Federal Reserve’s monetary hawkishness. But can this upward move be interpreted as a true annual bottom?
Or is it merely a temporary short squeeze before a return to the lows? As high finance fundamentals swing back and forth, let’s assess the technical outlook for the US dollar (DXY).
1) Rate cut expected on Wednesday, September 17 – fundamentals in flux
The recent rebound in the US dollar coincides with the Federal Reserve's firm stance in refusing, for now, to resume rate cuts, which have been on hold since late 2024. In its latest monetary policy decision on July 30, the Fed reaffirmed that no tangible factors justify a rapid rate cut. Disinflation appears paused, and the institution prefers to wait until fall to assess the impact of tariff measures on the core PCE index (inflation excluding food and energy).
However, a major red flag emerged with the release of a very poor Non-Farm Payrolls (NFP) report on August 1, reflecting a significant weakening in the labor market — a fundamental red alert!
The Fed has made it clear that the evolution of employment will be a key factor in its September decision. A weaker labor market could accelerate a monetary policy shift, renewing downward pressure on the US dollar.
2) Technical analysis of the US dollar (DXY): short-term rebound... but no medium-term trend reversal yet
From a technical standpoint, July's rebound is based on medium/long-term support levels that have so far acted as potential reversal bases. Can we legitimately speak of an annual low for the DXY? Has a major resistance been broken? The answer remains NO for now.
Weekly and monthly charts do not yet show a clear bullish reversal pattern. Some bullish divergence signals are emerging, notably on the RSI and LMACD, but they remain insufficient to confirm a lasting regime shift. A comparison with the 2018 and 2021 lows is telling: at those times, technical divergences were far more pronounced and bullish reversal structures had been confirmed.
The Elliott wave approach suggests a rebound is plausible within a corrective structure, but it does not yet guarantee a major trend reversal.
Data from the CFTC’s Commitments of Traders (COT) report and ETF flows tied to the dollar indicate some hesitation among institutional investors. While short positions have declined, there’s no clear evidence of large-scale buying.
In summary, the US dollar rebound since mid-July is real but fragile. As long as technical signals remain unclear and the labor market is flashing red, betting on a sustainable trend reversal remains risky. The annual low may be in place, but it is not yet confirmed from a technical, macroeconomic, or behavioral standpoint.
DISCLAIMER:
This content is intended for individuals who are familiar with financial markets and instruments and is for information purposes only. The presented idea (including market commentary, market data and observations) is not a work product of any research department of Swissquote or its affiliates. This material is intended to highlight market action and does not constitute investment, legal or tax advice. If you are a retail investor or lack experience in trading complex financial products, it is advisable to seek professional advice from licensed advisor before making any financial decisions.
This content is not intended to manipulate the market or encourage any specific financial behavior.
Swissquote makes no representation or warranty as to the quality, completeness, accuracy, comprehensiveness or non-infringement of such content. The views expressed are those of the consultant and are provided for educational purposes only. Any information provided relating to a product or market should not be construed as recommending an investment strategy or transaction. Past performance is not a guarantee of future results.
Swissquote and its employees and representatives shall in no event be held liable for any damages or losses arising directly or indirectly from decisions made on the basis of this content.
The use of any third-party brands or trademarks is for information only and does not imply endorsement by Swissquote, or that the trademark owner has authorised Swissquote to promote its products or services.
Swissquote is the marketing brand for the activities of Swissquote Bank Ltd (Switzerland) regulated by FINMA, Swissquote Capital Markets Limited regulated by CySEC (Cyprus), Swissquote Bank Europe SA (Luxembourg) regulated by the CSSF, Swissquote Ltd (UK) regulated by the FCA, Swissquote Financial Services (Malta) Ltd regulated by the Malta Financial Services Authority, Swissquote MEA Ltd. (UAE) regulated by the Dubai Financial Services Authority, Swissquote Pte Ltd (Singapore) regulated by the Monetary Authority of Singapore, Swissquote Asia Limited (Hong Kong) licensed by the Hong Kong Securities and Futures Commission (SFC) and Swissquote South Africa (Pty) Ltd supervised by the FSCA.
Products and services of Swissquote are only intended for those permitted to receive them under local law.
All investments carry a degree of risk. The risk of loss in trading or holding financial instruments can be substantial. The value of financial instruments, including but not limited to stocks, bonds, cryptocurrencies, and other assets, can fluctuate both upwards and downwards. There is a significant risk of financial loss when buying, selling, holding, staking, or investing in these instruments. SQBE makes no recommendations regarding any specific investment, transaction, or the use of any particular investment strategy.
CFDs are complex instruments and come with a high risk of losing money rapidly due to leverage. The vast majority of retail client accounts suffer capital losses when trading in CFDs. You should consider whether you understand how CFDs work and whether you can afford to take the high risk of losing your money.
Digital Assets are unregulated in most countries and consumer protection rules may not apply. As highly volatile speculative investments, Digital Assets are not suitable for investors without a high-risk tolerance. Make sure you understand each Digital Asset before you trade.
Cryptocurrencies are not considered legal tender in some jurisdictions and are subject to regulatory uncertainties.
The use of Internet-based systems can involve high risks, including, but not limited to, fraud, cyber-attacks, network and communication failures, as well as identity theft and phishing attacks related to crypto-assets.
NAS100 - IMPORTANT UPDATEDear Friends in Trading,
How I see it,
Investors imposed a very strong recovery attempt.
Daily tweezer close.
As it stands, potential for a "BEARISH" sentiment is wavering.
1) Will price come all the way back to main demand for a second leg?
2) Will price only retrace back into discount for a higher right foot?
Keynote:
Investors show confidence/hopeful for a near term rate cut...
I sincerely hope my point of view offers a valued insight
Thank you for taking the time study my analysis.

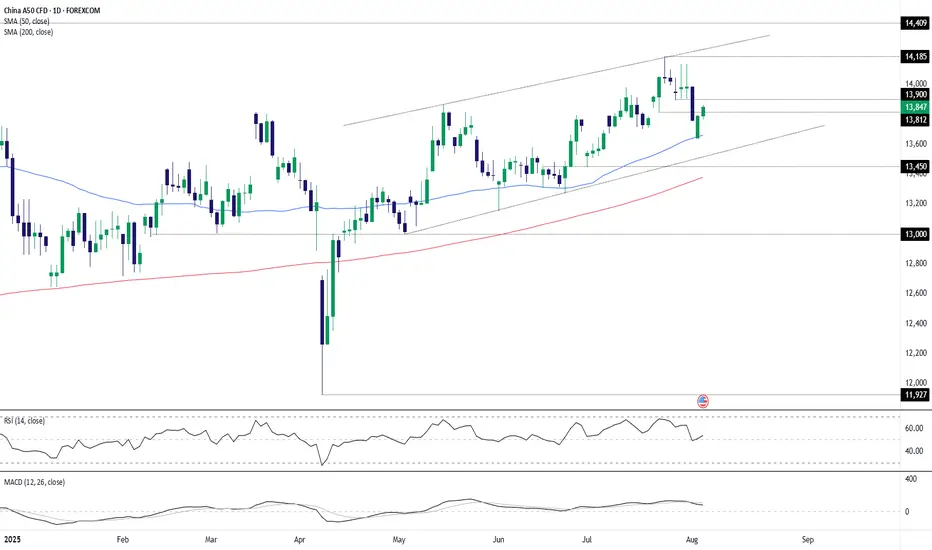
China A50 bullish setupChina A50 remains in an uptrend, marked by higher lows since April and repeated bounces from the 50-day moving average. With both 50 and 200-day averages pointing higher, the bias favours playing from the long side.
A break and hold above 13812 would generate a bullish setup, opening the door for longs with stop beneath for protection. 13900 is the first hurdle, followed by 14000, with 14185 as a potential target. A clean break there would put 14409 in play. If the index can’t hold 13812, the focus flips back to the 50-day moving average as near-term support.
Good luck!
DS
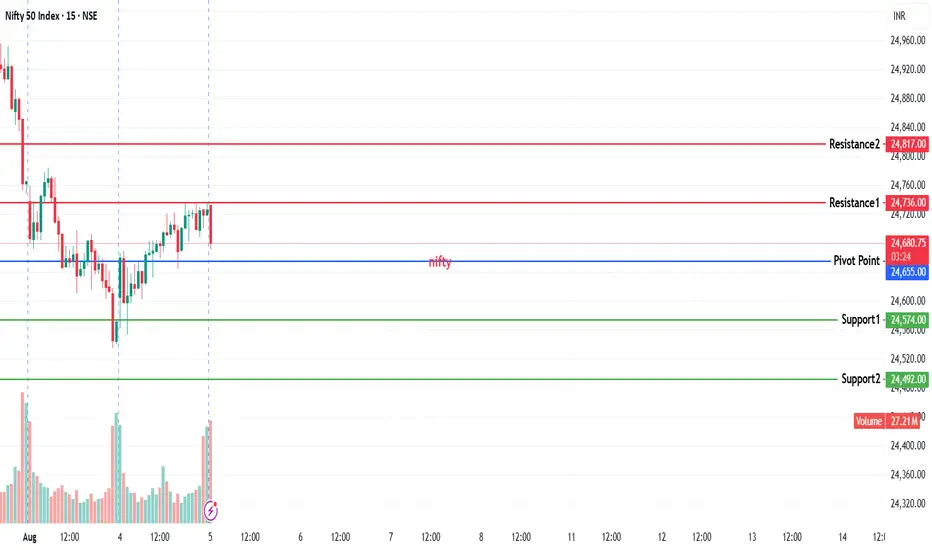
NIFTY KEY LEVELS FOR 05.08.2025NIFTY KEY LEVELS FOR 05.08.2025
If the candle stays above the pivot point, it is considered a bullish bias; if it remains below, it indicates a bearish bias. Price may reverse near Resistance 1 or Support 1. If it moves further, the next potential reversal zone is near Resistance 2 or Support 2. If these levels are also broken, we can expect the trend.
If the range(R2-S2) is narrow, the market may become volatile or trend strongly. If the range is wide, the market is more likely to remain sideways
📢 Disclaimer
I am not a SEBI-registered financial adviser.
The information, views, and ideas shared here are purely for educational and informational purposes only. They are not intended as investment advice or a recommendation to buy, sell, or hold any financial instruments.
Please consult with your SEBI-registered financial advisor before making any trading or investment decisions.
Trading and investing in the stock market involves risk, and you should do your own research and analysis. You are solely responsible for any decisions made based on this research.
KLCI BULLISH
This is just a continuation from my previous thesis of KLCI
*Refer to the link
Trading Range, forming the Schematic #2 of Accumulation
Need to refer other source for volume as TV doesnt provide it

US500 Bearish Idea: Waiting for Structure Break ConfirmationWatching the SPX US500 right now 📈 — it’s rallied hard with strong momentum and is pushing into a key resistance level ⚠️. Since price is overextended, I’m expecting a pullback towards equilibrium on the current move 🔄. My bias is bearish from this level 🔻, with entry dependent on a break in structure on the 30-min timeframe ⏳.
All is explained in the video 🎥 (not financial advice).

NAS100 Trade Idea: Liquidity Sweep & Bullish Reversal Potential📊 NASDAQ 100 (NAS100) Trade Outlook 📈
The NASDAQ 100 is holding a strong bullish trend on the higher timeframes 🟢. However, we’re currently seeing a notable pullback into a key support zone ⚠️ — price has dipped beneath previous lows, tapping into what appears to be an institutional accumulation range 🏦.
This move is likely targeting the liquidity resting below those lows 💧, where sell stops are positioned. Price is also reacting off a significant bullish order block 🧱 — a confluence area that could produce a strong reversal.
🎯 What to look for next:
Wait for a bullish break in market structure 🔁 to confirm a potential entry. If that occurs, consider a long setup with your stop loss below the swing low 🛑 and a 1:2 risk-to-reward target 🎯.
🚫 This is for educational purposes only and not financial advice.

FTSE SHORTThere is an ABCD pattern on M30
All timeframes are overbought on RSI
There are multiple tops on all timeframes with divergence
Great resistance at this level
Stoploss above 9200

Nifty trend directionNifty 24722 is showing inside bar pattern .resistance at 767 and 844. If high goes greater than yesterday high if 736 , wait for candle to reverse and fall below 736 for shorting opportunities with sl around near mentioned resistance.

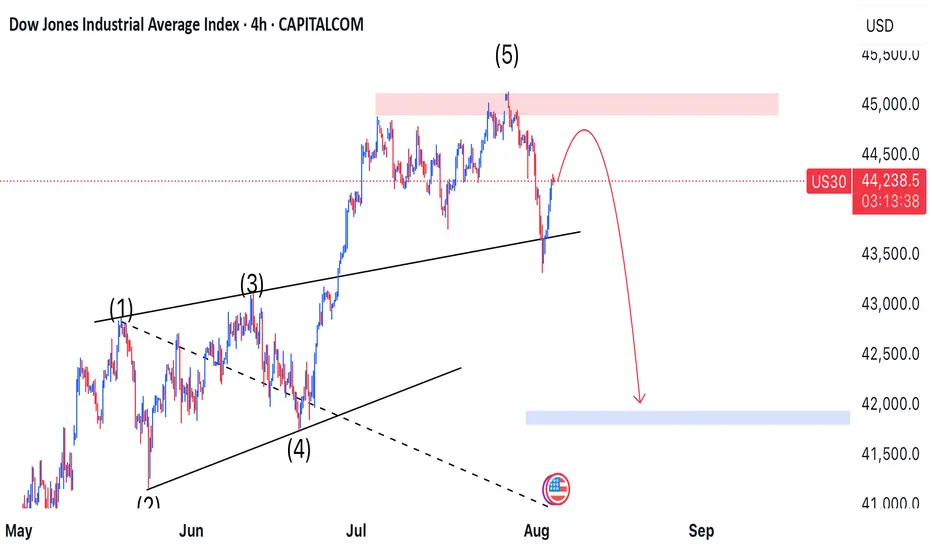
*US30: Fifth Wolfe Wave in Play—Correction Offers Prime Shorting📉 *
The US30 index has completed its **fifth Wolfe Wave**, initiating the expected downward move. While price is currently undergoing a corrective bounce, this retracement is shaping up to be a golden opportunity for sellers.
🔍 **Technical Breakdown**
- ✅ Wolfe Wave structure is confirmed, with wave 5 marking the turning point.
- 🔄 Current price action shows a **corrective pullback**, typical after the initial drop.
- 📌 Any upward movement is viewed as a **strategic entry point for short positions**.
🎯 **Target Zone**
We’re eyeing a descent toward the **41,700 level**, which aligns with the equilibrium line drawn between **waves 1 and 4**—a classic Wolfe Wave target.
⚠️ **Trade Insight**
This setup blends harmonic precision with tactical timing. As long as price remains below the wave 5 peak, the bearish bias holds strong. Sellers are watching for signs of exhaustion in the correction to strike.
---
Intraday Setup for Tuesday 05 August Market Structure Over Sentiment
The market is currently trading in a confusing zone, especially with negative global sentiment in the backdrop. But remember — that sentiment only matters if the Friday hourly low breaks. Until then, stay technical, stay objective
🧭 Market Structure Overview:
Daily Trend: Continues to form lower lows, indicating weakness in the broader trend.
Hourly Timeframe: Trading near key support, forming a triple bottom at 24,500 – an important level to watch for breakdown or bounce.
5-Minute Chart (Intraday): Showing signs of higher highs, suggesting short-term buying interest.
Key Intraday Levels (Nifty):
24,800 – Critical Resistance Zone
➤ Watch Price Action Closely Here
If reversal comes from this level, it may offer a high-probability shorting opportunity.
A breakout above 24,800 is tricky – may trigger false moves, so wait for confirmation.
24,640 – Scalp Short Opportunity
➤ A good level for a quick short, provided the momentum supports it.
Ideal for scalpers looking for small, sharp moves.
Final Note:
Don’t get influenced by noise. Let the structure guide your trades. As long as Friday’s hourly low holds, bulls have a reason to defend. Below that — bears take the lead.

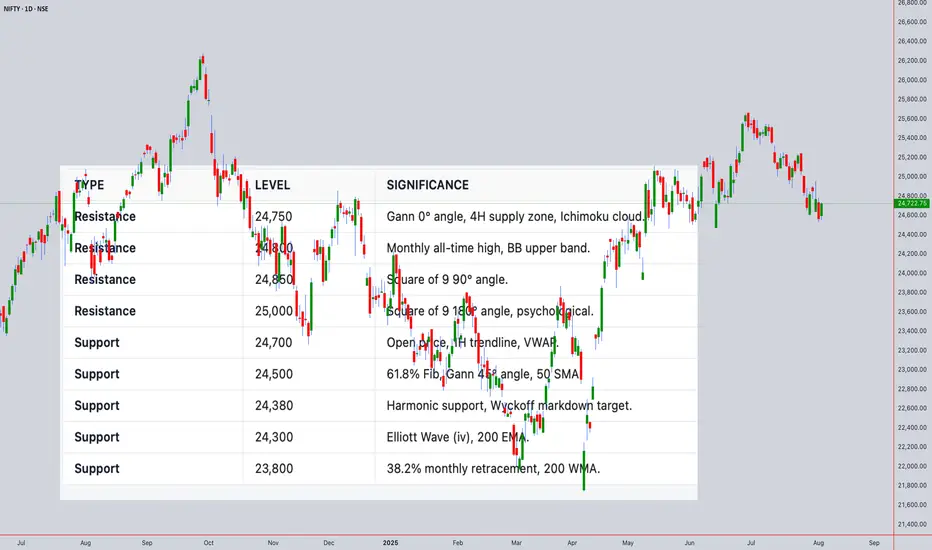
NIFTY50 Closing Price: ₹24,722.75 (4th Aug 2025, 02:00PM UTC+4)Comprehensive Technical Analysis for NIFTY50
world wide web shunya trade
Closing Price: ₹24,722.75 (4th Aug 2025, 02:00PM UTC+4)
Time Frames:
Intraday: 5M, 15M, 30M, 1H, 4H
Swing: 4H, Daily, Weekly, Monthly
1. Japanese Candlestick Analysis
Intraday (5M-4H)
4H: Bearish Engulfing at 24,722.75 signals rejection of highs.
1H: Dark Cloud Cover below 24,750 confirms weakness.
30M/15M: Shooting Stars at 24,720 indicate exhaustion.
5M: Three Black Crows pattern suggests strong bearish momentum.
Outlook: Bearish reversal likely if 24,700 breaks.
Swing (4H-Monthly)
Daily: Gravestone Doji at 24,722.75 warns of trend exhaustion.
Weekly: Bearish Harami after 3-week rally signals distribution.
Monthly: Long-legged Doji at all-time highs (24,800) indicates indecision.
2. Harmonic Patterns
Intraday
4H/1H: Bearish Butterfly completing at 24,722.75 (D-point).
PRZ: 24,700–24,750 (127.2% XA + 161.8% BC).
30M: Bullish Crab forming at 24,600 (secondary setup).
Swing
Daily: Bearish Gartley near 24,750 (78.6% XA retracement).
Weekly: Potential Bullish Bat at 24,500 if correction extends.
3. Elliott Wave Theory
Intraday
4H: Wave 5 of impulse cycle peaked at 24,722.75.
Structure: Completed 5-wave sequence from 24,200 → 24,722.75.
Corrective Phase: ABC pullback targeting 24,500 (Wave A).
1H: Sub-wave (v) ending with RSI divergence.
Swing
Daily: Wave 3 of primary bull cycle nearing completion at 24,750.
Weekly: Wave (iii) of larger impulse, expecting Wave (iv) correction to 24,300.
Monthly: Wave V of multi-year bull run, nearing major resistance at 24,800.
4. Wyckoff Theory
Intraday
Phase: Distribution (after markup from 24,200 → 24,722.75).
Signs: High volume at 24,722.75 (supply), failed upthrust above 24,750.
Schematic: Phase C (markdown) initiating.
Swing
Daily: Late Markup → Distribution at 24,750.
Weekly: Accumulation completed at 23,500; now in Markup but showing signs of exhaustion.
5. W.D. Gann Theory
Time Theory
Intraday: Key reversal windows:
UTC+4: 10:00–12:00 (resistance test), 14:00–16:00 (trend reversal).
Swing:
Daily: 8th Aug (4 days from close) for time squaring.
Weekly: 12th Aug (1 week) for cycle turn.
Square of 9
24,722.75 → Resistance Angles:
0° (24,750), 90° (24,850), 180° (25,000).
Support: 45° (24,500), 315° (24,250).
Angle Theory
4H Chart: 1x1 Gann Angle (45°) from 24,200 low at 24,500. Price overextended.
Daily Chart: 2x1 Angle (63.75°) at 24,722.75 acting as resistance.
Squaring of Price & Time
Price Range: 24,200 → 24,722.75 (522.75 points).
Time Squaring: 522.75 hours from 24,200 low → 24,750 resistance.
Ranges in Harmony
Primary Range: 24,000–25,000 (1,000 points).
50% Retracement: 24,500 (critical support).
61.8% Retracement: 24,380.
Secondary Range: 24,500–24,750 (250 points).
Price & Time Forecasting
Intraday Targets:
Short-Term: 24,500 (61.8% Fib).
Extension: 24,380 (Gann 45° angle).
Swing Targets:
Weekly: 24,300 (Wave (iv) target).
Monthly: 23,800 (38.2% retracement of entire bull run).
6. Ichimoku Kinko Hyo
Intraday (4H)
Cloud (Kumo): Price below Kumo (bearish).
Tenkan-sen: 24,700 (flat, resistance).
Kijun-sen: 24,650 (support).
Chikou Span: Below price (confirms bearish momentum).
Swing (Daily)
Cloud: Thick cloud resistance at 24,750–24,800.
Tenkan/Kijun: Bearish crossover at 24,700.
7. Indicators
Intraday
RSI (14): 68 (4H) → Overbought; divergence at highs.
Bollinger Bands: Price tagging upper band (24,750); contraction signals volatility.
VWAP: 24,680 (acting as dynamic resistance).
Moving Averages:
50 SMA: 24,600 (support).
200 EMA: 24,400 (major support).
Swing
Daily RSI: 72 (overbought, divergence).
Weekly BB: Upper band at 24,800 (resistance).
Monthly VWAP: 23,500 (major support).
200 WMA: 22,800 (long-term bull support).
Synthesized Forecast
Intraday (Next 24H)
Bearish Scenario (High Probability):
Trigger: Break below 24,700 (1H close).
Targets: 24,500 (T1), 24,380 (T2).
Timeline: 8–12 hours (UTC+4 22:00–02:00).
Bullish Scenario (Low Probability):
Trigger: Sustained close above 24,750.
Target: 24,850 (Gann 90° angle).
Swing (1–4 Weeks)
Bearish Scenario:
Targets: 24,300 (Wave (iv)), 23,800 (38.2% retracement).
Timeline: 5–10 trading days.
Bullish Scenario:
Trigger: Close above 24,800.
Target: 25,200 (Gann 180° angle).
For those interested in further developing their trading skills based on these types of analyses, consider exploring the mentoring program offered by Shunya Trade.(world wide web shunya trade)
I welcome your feedback on this analysis, as it will inform and enhance my future work.
Regards,
Shunya.Trade
world wide web shunya trade
⚠️ Disclaimer: This post is educational content and does not constitute investment advice, financial advice, or trading recommendations. The views expressed here are based on technical analysis and are shared solely for informational purposes. The stock market is subject to risks, including capital loss, and readers should exercise due diligence before investing. We do not take responsibility for decisions made based on this content. Consult a certified financial advisor for personalized guidance.
JP225 NIKKEI225JP225 (Nikkei 225) Iis down by few popints and This recent downturn has been driven by global concerns, especially U.S. tariff escalations, a weaker-than-expected U.S. jobs report, and caution ahead of Bank of Japan policy updates. Major Japanese sectors such as technology, financials, and industrials have seen notable declines.
Despite this short-term dip, the index remains up about 2.5% in the past month and nearly 29% over the past year, reflecting powerful momentum in Japanese equities for 2025. The most recent all-time high was near 42,438 (July 2024), and the index is still trading near historic highs.
Technical and Market Drivers
Recent Volatility: Linked to external (U.S. tariffs, global growth) and internal (BOJ policy, earnings) factors.
Sector Weakness: Tech stocks (e.g., Advantest), financials (Mitsubishi UFJ), and heavyweight exporters (Toyota, Hitachi) have led the latest decline.
Sentiment: Investors are awaiting key signals from the Bank of Japan and further clarity on global trade and monetary policy developments.
Future Outlook for Nikkei 225
Short-Term:
The near-term outlook remains cautious. Analysts and forecasters expect the JP225 could see continued volatility, potentially testing support near 39,000–40,000, especially if global risk sentiment remains weak or BOJ signals tighter policy. However, the underlying fundamental backdrop—strong Japanese corporate earnings, robust foreign investment inflows, and yen weakness supporting exporters—still lends medium-term support.
Medium- and Long-Term:
Forecasts for End-2025: Consensus among strategists suggests potential for new highs by year-end. Some projections see the index reaching 44,000–45,400 or higher, especially if global and regional macroeconomic conditions stabilize and earnings growth persists.
Risks and Catalysts:
Global risk: Further U.S. tariff escalation, slowing global growth, or a sharp downturn in tech could weigh heavily.
Domestic support: Positive corporate governance reforms, sustained share buybacks, tax cut proposals, and improved domestic consumption are likely to underpin strength.
BOJ Policy: Changes in Bank of Japan monetary settings are a key source of both risk and potential upside; continued loose policy would be bullish, while unexpected tightening could trigger corrections.
#jp225 #japan #stocks

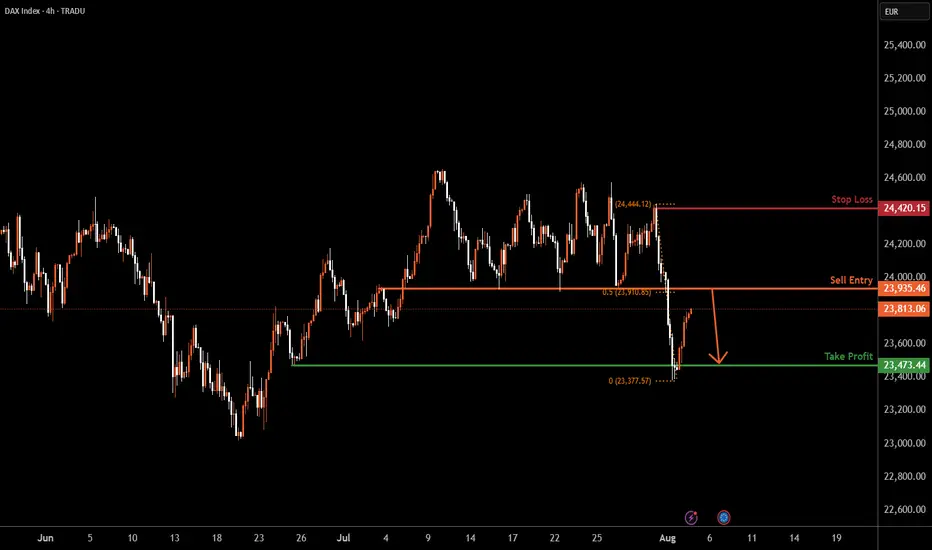
GER30 H4 | Bearish reversal off pullback resistanceBased on the H4 chart analysis, we can see that the price rises towards the sell entry, which acts as a pullback resistance that lines up with the 50% Fibonacci retracement and could potentially reverse to the downside from this level.
Sell entry is at 23,935.46, which is a pullback resistance that aligns with the 50% Fibonacci retracement.
Stop loss is at 24,420.15, which is a swing high resistance.
Take profit is at 23,473.44, which is a multi-swing low support.
High Risk Investment Warning
Trading Forex/CFDs on margin carries a high level of risk and may not be suitable for all investors. Leverage can work against you.
Stratos Markets Limited (tradu.com ):
CFDs are complex instruments and come with a high risk of losing money rapidly due to leverage. 65% of retail investor accounts lose money when trading CFDs with this provider. You should consider whether you understand how CFDs work and whether you can afford to take the high risk of losing your money.
Stratos Europe Ltd (tradu.com ):
CFDs are complex instruments and come with a high risk of losing money rapidly due to leverage. 66% of retail investor accounts lose money when trading CFDs with this provider. You should consider whether you understand how CFDs work and whether you can afford to take the high risk of losing your money.
Stratos Global LLC (tradu.com ):
Losses can exceed deposits.
Please be advised that the information presented on TradingView is provided to Tradu (‘Company’, ‘we’) by a third-party provider (‘TFA Global Pte Ltd’). Please be reminded that you are solely responsible for the trading decisions on your account. There is a very high degree of risk involved in trading. Any information and/or content is intended entirely for research, educational and informational purposes only and does not constitute investment or consultation advice or investment strategy. The information is not tailored to the investment needs of any specific person and therefore does not involve a consideration of any of the investment objectives, financial situation or needs of any viewer that may receive it. Kindly also note that past performance is not a reliable indicator of future results. Actual results may differ materially from those anticipated in forward-looking or past performance statements. We assume no liability as to the accuracy or completeness of any of the information and/or content provided herein and the Company cannot be held responsible for any omission, mistake nor for any loss or damage including without limitation to any loss of profit which may arise from reliance on any information supplied by TFA Global Pte Ltd.
The speaker(s) is neither an employee, agent nor representative of Tradu and is therefore acting independently. The opinions given are their own, constitute general market commentary, and do not constitute the opinion or advice of Tradu or any form of personal or investment advice. Tradu neither endorses nor guarantees offerings of third-party speakers, nor is Tradu responsible for the content, veracity or opinions of third-party speakers, presenters or participants.
Heading into 61.8% Fibonacci resistance?GER40 is rising towards the resistance level which is a pullback resistance that aligns with the 61.8% Fibonacci retracement and could reverse from this level to our take profit.
Entry: 24,006.71
Why we like it:
There is a pullback resistance level that lines up with the 61.8% Fibonacci retracement.
Stop loss: 24,405.92
Why we like it:
There is a swing high resistance.
Take profit: 23,498.13
Why we like it:
There is a multi swing low support.
Enjoying your TradingView experience? Review us!
Please be advised that the information presented on TradingView is provided to Vantage (‘Vantage Global Limited’, ‘we’) by a third-party provider (‘Everest Fortune Group’). Please be reminded that you are solely responsible for the trading decisions on your account. There is a very high degree of risk involved in trading. Any information and/or content is intended entirely for research, educational and informational purposes only and does not constitute investment or consultation advice or investment strategy. The information is not tailored to the investment needs of any specific person and therefore does not involve a consideration of any of the investment objectives, financial situation or needs of any viewer that may receive it. Kindly also note that past performance is not a reliable indicator of future results. Actual results may differ materially from those anticipated in forward-looking or past performance statements. We assume no liability as to the accuracy or completeness of any of the information and/or content provided herein and the Company cannot be held responsible for any omission, mistake nor for any loss or damage including without limitation to any loss of profit which may arise from reliance on any information supplied by Everest Fortune Group.

Nasdaq Bullish Order FlowNQ was pushing Low, having usual context. Also today we were looking price to continue low. But price respected old swing low.
Price reversed with a sharp turn (ST), hence respecting unusual context.
We have Targets outlined, with success rate for price to reach.

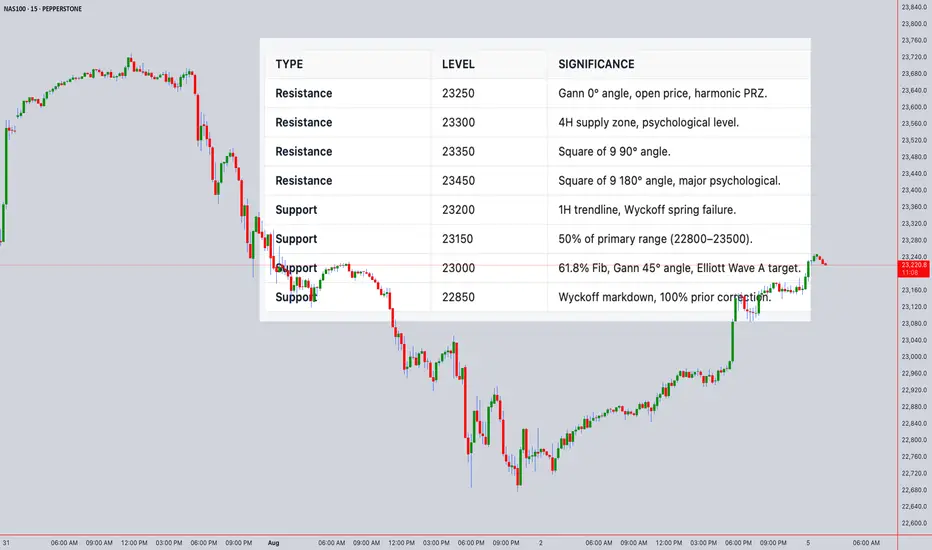
Technical Analysis Forecast for NAS100Open Price: 23242.3 (UTC+4)
1. Japanese Candlestick Analysis
4H/1H: Price opened at 23242.3 near resistance (23250–23300). Recent candles show bearish harami (4H) and dark cloud cover (1H), signaling rejection.
30M/15M: Gravestone doji at 23242.3 and three black crows indicate strong bearish momentum.
5M: Shooting star formation suggests exhaustion. Failure to close above 23250 confirms weakness.
Outlook: Bearish reversal likely if 23200 breaks.
2. Harmonic Patterns
4H/1H: Bearish Butterfly Pattern completing at 23242.3 (D-point).
PRZ: 23240–23250 (confluence of 127.2% XA and 161.8% BC).
Fibonacci Ratios: AB=CD symmetry (23240–23250).
30M: Bullish Crab forming at 23100, but secondary to larger bearish setup.
Outlook: High-probability short entry at 23240–23250 with target 23000.
3. Elliott Wave Theory
4H: Wave 5 of impulse cycle peaked at 23242.3.
Structure: Completed 5-wave sequence from 22800 → 23242.3.
Corrective Phase: ABC pullback targeting 23000 (Wave A) and 22850 (Wave C).
1H: Sub-wave (v) of 5 ending at 23242.3. RSI divergence confirms exhaustion.
Outlook: Bearish correction to 22850–23000 within 24 hours.
4. Wyckoff Theory
Phase: Distribution (after markup from 22800 → 23242.3).
Signs: High volume at 23242.3 (supply), upthrust above 23300 failed.
Schematic: Phase C (markdown) initiating.
1H/30M: Spring at 23200 failed to hold, indicating weak demand.
Outlook: Break below 23200 triggers markdown to 23000.
5. W.D. Gann Theory
Time Theory
24H Cycle: Key reversal windows:
UTC+4: 08:00–10:00 (resistance test), 14:00–16:00 (trend reversal).
Square of 9: 23242.3 aligns with 0° angle (resistance).
Square of 9
23242.3 → Resistance Angles:
0° (23250), 90° (23350), 180° (23450).
Support: 45° (23000), 315° (22850).
Price Forecast: Reversal at 23250 (0° angle).
Angle Theory
4H Chart: 1x1 Gann Angle (45°) from 22800 low at 23000. Price above angle = bullish, but overextended.
1H Chart: 2x1 Angle (63.75°) at 23242.3 acting as resistance.
Squaring of Price & Time
Price Range: 22800 → 23242.3 (442.3 points).
Time Squaring: 442.3 hours from 22800 low → 23250 resistance (442.3 points ≈ 442.3 hours).
Harmony: 23242.3 = Time Cycle Peak (24H from open).
Ranges in Harmony
Primary Range: 22800–23500 (700 points).
50% Retracement: 23150 (support).
61.8% Retracement: 23000 (critical support).
Secondary Range: 23000–23300 (300 points).
Key Levels: 23150 (50%), 23000 (61.8%).
Price & Time Forecasting
Price Targets:
Short-Term: 23000 (61.8% Fib, Gann 45° angle).
Extension: 22850 (100% of prior correction).
Time Targets:
First Reversal: 8–12 hours from open (UTC+4 12:00–16:00).
Second Reversal: 20–24 hours (UTC+4 00:00–04:00 next day).
Synthesized 24H Forecast
Bearish Scenario (High Probability)
Trigger: Break below 23200 (confirmed by 1H/30M close).
Targets:
T1: 23000 (61.8% Fib, Gann 45° angle).
T2: 22850 (Wyckoff markdown, Elliott Wave C).
Timeline:
8–12H: Drop to 23000 (UTC+4 12:00–16:00).
20–24H: Test 22850 (UTC+4 00:00–04:00 next day).
Confirmation: RSI <50 on 1H, volume spike >25% average.
Bullish Scenario (Low Probability)
Trigger: Sustained close above 23300 (Gann 0° angle).
Targets: 23350 (90° angle), 23450 (180° angle).
Timeline: 12–16 hours (if 23300 breaks).
Potential Shorts for NAS100After Last weeks NFP, price displaced very strongly to the downside. I would be considering shorts at the Daily CISD, which price is approaching rapidly.

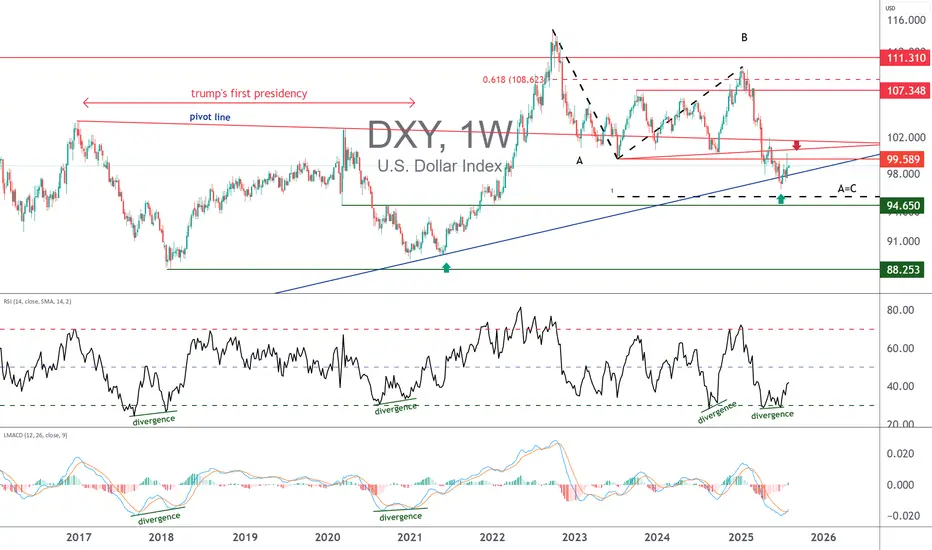
DXY: Weekly OutlookWeekly DXY Outlook
On the weekly chart, the US Dollar Index (DXY) has reached a critical zone that was last tested in February 2022.
While a rebound is not guaranteed, the fact that the DXY has declined nearly 12% over just six months—despite a resilient U.S. economy—suggests the potential for renewed strength in the dollar.
I think the index could begin a recovery toward key levels at 100.00, 101.97, and possibly 106.00/
It’s worth noting that the broader bearish trend began with the trade tensions initiated during the Trump administration, which strained relations with several major trading partners.
Given that this is a weekly chart, it should be used more as a reference point rather than a trading signal.
You may find more details in the chart!
Thank you and Good Luck!

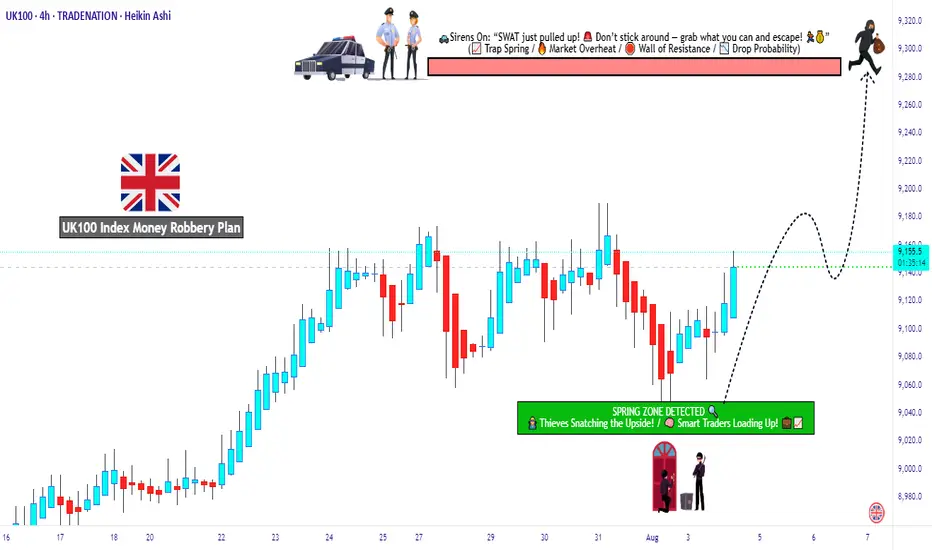
Is UK100 Setting Up the Cleanest Bull Robbery This Week?🏴☠️💹“UK100 Bullish Bank Job Heist 🧠💰” – Thief Trader Limit Order Operation 🚨📊
📢 Calling all stealthy traders, market pirates, and strategic looters! The vault is open, and the FTSE100 (UK100) index is now under our radar for a planned bullish extraction. This ain’t no regular trade — this is a Thief-Style Layered Entry Operation™.
🎯 Plan of Attack:
Asset: UK100 / FTSE100
Bias: Bullish
Entry: Any price level — we layer like legends (multiple limit orders across price zones)
Stop Loss: 9040.0 (vault protection level 🔐)
Target: 9280.0 (loot zone confirmed 🎯)
🧠 Thief Strategy Breakdown:
🔎 Why Bullish?
The setup is showing signs of accumulation + macro support, with strong risk-to-reward potential. Market exhaustion and liquidity traps are visible — it’s time to slip in quietly and stack long orders like a silent thief in the night.
📈 Execution Plan:
🔹 Use limit orders below current price (layer across price pockets)
🔹 DCA-style entries for better average and flexibility
🔹 Risk small, aim large
🔹 Always watch for market traps or surprise bear moves
🛡️ Stop-Loss Logic:
Below structure zones or 4H support – ~9040.0
Don't get greedy — protect the bag at all times.
🚪 Target the Escape:
Primary TP set at 9280.0
Optional: secure partials earlier using trailing SL once price breaks above 9200 zone.
📊 Trader Alerts:
⚠️ Avoid new positions during high-impact UK news
📅 Check for BOE surprises or global market shocks
🔁 Trail stops — don’t let profits vanish like a clumsy thief
📌 Notes from the Underground Vault:
🔐 This trade idea is based on market structure + liquidity flow
📌 Not financial advice — always rob with your own blueprint
💼 Trade light. Think sharp. Escape clean.
🔥 Join the Robbery Squad
Smash the idea boost 💥 if you're running this setup too.
💬 Drop a “HEIST LOADED” in the comments if you're in. Let’s loot this market the smart way — layered, patient, and untraceable. 🏴☠️💸
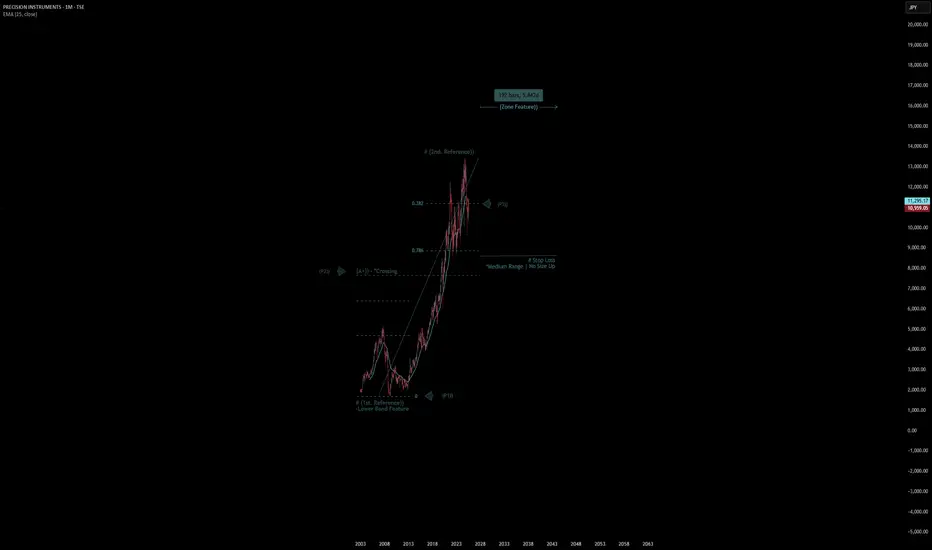
Precision Instruments - Quote | Chart & Forecast SummaryKey Indicators On Trade Set Up In General
1. Push Set Up
2. Range Set Up
3. Break & Retest Set Up
Notes On Session
# Precision Instruments - Quote
- Double Formation
* # (1st. Reference)) - *Lower Band Feature | Subdivision 1
* (A+)) - *Crossing | Completed Survey
* 192 bars, 5.842d | Date Range Method - *(Uptrend Argument))
- Triple Formation
* (P1)) / (P2)) & (P3)) | Subdivision 2
* Weekly Time Frame | Trend Settings Condition | Subdivision 3
- (Hypothesis On Entry Bias)) | Indexed To 100
* Stop Loss Feature Varies Regarding To Main Entry And Can Occur Unevenly
- Position On A 1.5RR
* Stop Loss At 425.00 JPY
* Entry At 540.00 JPY
* Take Profit At 700.00 JPY
* (Uptrend Argument)) & No Pattern Confirmation
- Continuation Pattern | Not Valid
- Reversal Pattern | Not Valid
* Ongoing Entry & (Neutral Area))
Active Sessions On Relevant Range & Elemented Probabilities;
European-Session(Upwards) - East Coast-Session(Downwards) - Asian-Session(Ranging)
Conclusion | Trade Plan Execution & Risk Management On Demand;
Overall Consensus | Buy
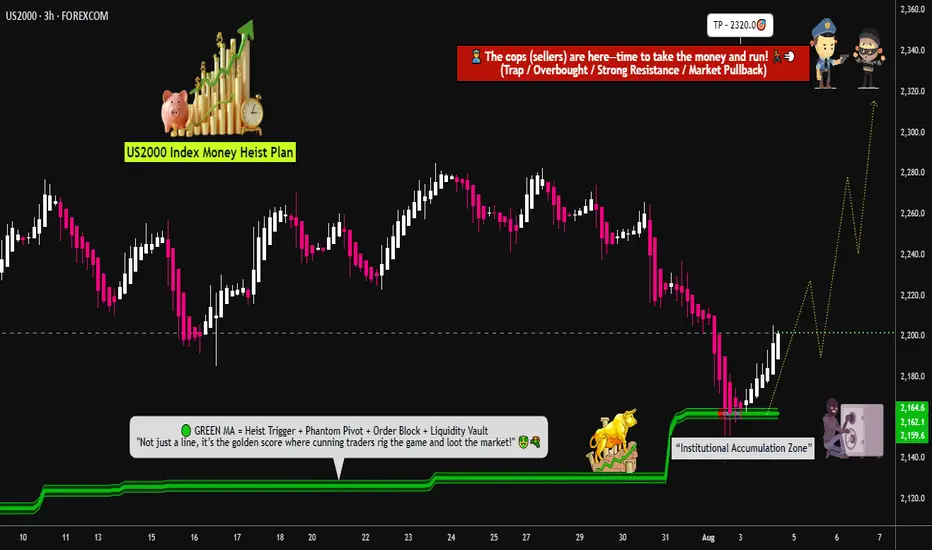
Russell 2000 Bullish Attack – Vault Break-In Loading🚨US2000 / Russell 2000 Heist Plan – Bullish Loot Incoming!🚨
🤑 Dear Robbers of the Market Vault,
The Russell 2000 is showing cracks in the bear walls—time for a bold bullish break-in! 🔓📈
The Thief has eyes everywhere, and right now, the loot sits between 2140.0 & 2320.0. Let's steal it!
📌 Asset: US2000 / Russell 2000
📍 Plan: Bullish (Heist Mode: ON)
🧲 Method: Layering entries like a smooth criminal 🎯💣
💵 Entry: Any price – the vault door’s open, rob at your timing!
🛡️ Stop Loss: 2140.0 (Guarded exit in case the heat gets too strong)
🎯 Target: 2320.0 (The gold bars are stacked here)
🧠 Robbery Blueprint (Strategy Notes):
Use multiple buy limit orders 🔄
Structure entries near swing lows in 15m/30m charts
Wait for dips, snatch the momentum—we rob during weakness!
Always place alerts to spot intraday cracks in the defense lines 📳📊
Don’t chase; we trap the trap!
💥Risk Alert & Protection Plan:
News events = 🔥 volatility bombs.
❌ No fresh trades during high-impact news
✅ Use trailing SL to lock in the loot
🔐 Protect your gains like the vault guards protect gold!
⚔️ Scalpers & Swing Thieves Note:
Scalp only on the long side
💸 Small capital = DCA entry + trail
💰 Big pockets = Straight breakout sniper shot
Stay light, stay fast, stay rich!
📢 Final Words from the Mastermind:
Boost this heist if you love the thrill of the steal 💥
Trade with precision, exit with profits, and never let the market catch you!
The next robbery plan drops soon... be ready, robbers 🐱👤🚨📈