Bullish reversalUS Dollar Index (DXY) has bounced off the pivot and could rise to the 1st resistance.
Pivot: 98.24
1st Support: 97.90
1st Resistance: 98.76
Disclaimer:
The opinions given above constitute general market commentary and do not constitute the opinion or advice of IC Markets or any form of personal or investment advice.
Any opinions, news, research, analyses, prices, other information, or links to third-party sites contained on this website are provided on an "as-is" basis, are intended to be informative only, and are not advice, a recommendation, research, a record of our trading prices, an offer of, or solicitation for, a transaction in any financial instrument and thus should not be treated as such. The information provided does not involve any specific investment objectives, financial situation, or needs of any specific person who may receive it. Please be aware that past performance is not a reliable indicator of future performance and/or results. Past performance or forward-looking scenarios based upon the reasonable beliefs of the third-party provider are not a guarantee of future performance. Actual results may differ materially from those anticipated in forward-looking or past performance statements. IC Markets makes no representation or warranty and assumes no liability as to the accuracy or completeness of the information provided, nor any loss arising from any investment based on a recommendation, forecast, or any information supplied by any third party
Market indices

#Banknifty Directions and Levels for December 18thWhat to Expect Today?
> Even though the market declined, the movements happened gradually. If this continues, expect minor pullbacks at every support level. If you spot a solid correction structure, hold the position; otherwise, stick to small trades only. (Current view)
> On the other hand, initially expect some consolidation around the previous day's low to the 38% Fib level. After that, if it breaks the 38% level, anticipate a minimum upside move of 50% to 78% in the current swing.
> This also applies to the market if it initially breaks the 38% Fib level.(Alternate view)

#Nifty Directions and Levels for December 18thGood morning, friends! 🌞
Market Directions and Levels for December 18th
> No major changes occurred in global or Indian markets overnight. The Dow Jones shows bullish sentiment, while the Indian market indicates a moderately bearish outlook.
> As usual today, the GIFT Nifty is expected to open with a neutral start.
What to Expect Today?
> Even though the market declined, the movements happened gradually. If this continues, expect minor pullbacks at every support level. If you spot a solid correction structure, hold the position; otherwise, stick to small trades only. (Current view)
> On the other hand, initially expect some consolidation around the previous day's low to the 38% Fib level. After that, if it breaks the 38% level, anticipate a minimum upside move of 50% to 78% in the current swing.
> This also applies to the market if it initially breaks the 38% Fib level.(Alternate view)

Nasdaq: To bleed or not to bleed?
STRUCTURE CONTEXT:
Strength Context: Sellers Dominating
RSI Divergence: Present
Control Variant: Sellers Have Full Control
EMA Confluence: 400EMA Reversion
Balance Context: Bearish
Psychology Levels: $24,000 and $25,000
STRUCTURE ANALYSIS:
For the last 10 months we have seen a constant rise in price. Now interrupted in November and momentum now confirmed in December.
Price rejected 4 times when buyers attempted to reclaim price structure. Since then sellers have been dominating for 10 days with no signs of stopping.
With two retracements and an indecision in price on the Daily TF at $23,800, plus a crossover of the 9EMA and the 400EMA with reversion, and the lower lows and lower highs printed, we see great downwards confluence to claim open orders at $23,800 and most likely reverse to try and reclaim trend.
LONG SCENARIO:
- Price continues to retrace down to $23,800 where price was greatly rejected twice.
- Sellers then reach exhaustion and buyers reclaim price and attempt to push price to new highs.
SHORT SCENARIO:
- After price failing to make a new higher high sellers take control once more after exhausting buyers.
- Mitigating 50% of the imbalance in price we see a hard rejection to a new lower low using the strength of the 400 EMA reversion to the downside.

Bank Nifty Levels for 18th Dec 2025These levels were draw based on Money Zone level and previous week Support and Low levels. The market trends seems bearish to sideways.

Nifty Fiboacci levels ! 🟢 Plan ur TRADE in NIFTY ! Breakout ZONE + DIP ZONE and BREAK DOWN ZONEs all marked for u 🙏 ..

VIX Weekly: Bearish Engulfment Suggests Continued ComplacencyContext: The recent large Bearish Engulfment (highlighted in the orange box) followed by consecutive Bearish candles with shrinking bodies suggests that market participants expect continued low volatility in the near term. This price action reflects a period of increasing market complacency.
Expectation:
Low Volatility Case: If the VIX continues to hold below current resistance (gap line), expect the S&P 500 to maintain its bullish grind.
Volatility Spike Case: A move to Close the Gap line could signal a shift in sentiment. If the gap is filled, I would watch for a sharp increase in the VIX and a potential corrective phase in the equity markets.

NAS100 – Bias BearishThe daily bias for NAS100 today is bearish.
Yesterday’s daily candle formed a clear bearish signal:
✔️ Swept the previous day’s high (buy-side liquidity taken)
✔️ Closed bearish
✔️ Closed outside the previous day’s range (below the prior day’s low)
This price action shows rejection of premium levels and confirms a shift toward sell-side delivery for today’s session.
Bias Summary:
Daily Bias: Bearish
Narrative: Expansion lower after liquidity sweep
Expectation: Price may seek lower liquidity pools
Outlook: Any retracement into premium could offer short setups
Trade with the narrative, not against it. 🧠🔥

SPX Weekly: Bear Trap at 50% lvl or Expansion of Trading Range?Context: The market remains in a dominant tight bull upward trend. Having recently pulled back to test the weekly 20 EMA; The key question now is whether the bulls will aggressively step back in to drive price toward the Measured Move targets, or if the current trading range will resolve into a deeper pullback toward the Monthly 20 EMA.
Expectation: Given the strength of the prior bullish leg, I expect at least a second leg up to test the recent highs. Bulls are currently looking for a firm rejection off the 50% retracement level. Depending on how bearish this weekly bar closes, could potentially trap Double Top BRs.
Bull Case: If we reach the previous highs with strong momentum and follow-through, the trend likely resumes.
Bear Case: If volatility drops and price stalls at the highs, be wary of BRs stepping in leading to a bearish breakout to Monthly 20 EMA.

US2000 ATH idea Q1-early Q2 2026I applied the fractal from the last cycle when FX:US2000 put the peak, look how it repeats the structure with a false breakdown exactly like in 21 and what synchronization on the corrections in the current cycle.
if we look at the fractal, we can assume that ath will be put in the range of 3000-3400.

US500 (S&P 500) – Multi-Lens Market AnalysisMarket Snapshot
The US500 is marginally lower in the latest session, trading in the high-6,700s to low-6,800s, reflecting a mild risk-off tone on the day. This pullback follows an extended rally and appears corrective rather than trend-breaking.
Fundamental Analysis: Cooling Data, Still-Supportive Backdrop
From a fundamental perspective, the recent softness reflects macro digestion rather than deterioration.
US macro data has turned mixed, particularly on the labour front, where job growth and wage pressures show signs of gradual cooling. This reinforces expectations that the Fed is nearing the later stages of its tightening cycle and edging closer to easing.
Earnings fundamentals remain constructive. Corporate profitability has proven resilient, supported by productivity gains, cost discipline, and ongoing AI-related investment themes.
Monetary policy remains a tailwind, albeit with diminishing marginal impact. While the market continues to price eventual Fed cuts, policymakers remain cautious, keeping financial conditions from loosening too aggressively.
Bottom line: Fundamentals support the broader bull trend, but incremental upside now depends more on earnings delivery than macro relief.
Sentiment Analysis: Constructive, but No Longer Unquestioning
Market sentiment has shifted from outright bullish momentum to a more selective and tactical stance.
Risk appetite remains intact, but investors are increasingly sensitive to macro surprises after a strong run-up in valuations.
The pullback suggests profit-taking rather than fear, consistent with an environment where positioning is elevated and good news is already priced in.
Volatility remains contained, signalling no systemic risk-off move, but investors are demanding confirmation before extending exposure further.
Sentiment takeaway: Confidence remains high, but markets are less willing to chase highs without fresh catalysts.
Technical Analysis: Consolidation Within a Primary Uptrend
Technically, the index continues to exhibit bullish structure, despite near-term weakness.
Trend: Higher highs and higher lows remain intact on medium- and long-term charts.
Support levels:
Initial support near 6,650
Deeper support around 6,515 which would likely attract dip buyers if tested
Resistance:
Near-term resistance at 6,750
Next Resistance: 6,920 (recent highs)
Momentum: Indicators suggest mild overbought conditions have eased, which improves the sustainability of any next upside leg.
The current price action resembles healthy consolidation, allowing momentum to reset after an extended advance.
Overall Assessment
The US500’s latest pullback appears to be a pause within a broader uptrend, rather than a shift in market regime. Fundamentally, growth and earnings remain supportive; sentiment has cooled from exuberance to discipline; and technically, the index remains comfortably above key trend support.
Key risk: A sharper slowdown in US growth or a policy surprise that tightens financial conditions.
Base case: Sideways-to-higher consolidation, with renewed upside dependent on earnings confirmation and clarity on the Fed’s easing timeline.
Conclusion: The market is not breaking — it is recalibrating.
Analysis by Terence Hove, Senior Financial Markets Strategist at Exness

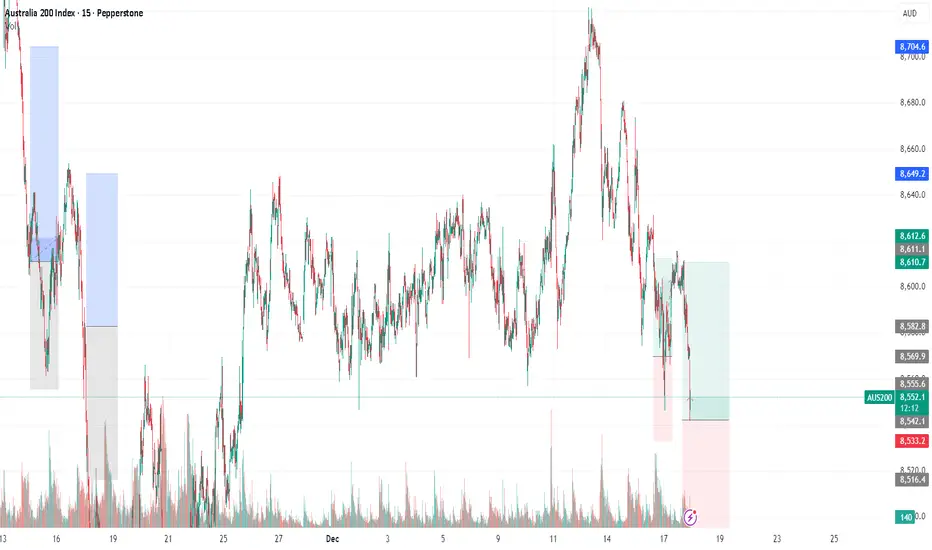
AUS200 ASX200 - LETS MAKE MILLIONTeam, time to buy AUS200 at 8530-45 ranges
STOP LOSS AT 8480
Target 1 - 8575-86
Target 2 - 8592-8605
Last night I predict the market will pull back
We short UK100 and both target hit
now we are going long on AUS200
lets go
US30 | Hourly Outlook | 2 ScenariosWe are overall bullish and we are approaching the hourly swing low. We have been internally making lower lows and lower highs. I will want to see price either go up from where its at currently and retest the interal supply to then go and take out the hourly low or go straight down from where its at and sweep the hourly low and tap into the hourly ob. Whatever scenario happens, I will be monitoring lower timeframe price action for confirmation at either zone.
Trade Safe -Remzy

Dow Jones Wave Analysis – 17 December 2025
- Dow Jones reversed from resistance level 49000.00
- Likely to fall to support level 47525.00
Dow Jones index recently reversed from the resistance area between the resistance level 49000.00 and the upper daily Bollinger Band.
The downward reversal from this resistance area stopped the previous minor impulse waves iii and 3.
Given the strength of the resistance level 49000.00 and the bearish divergence on the daily RSI indicator, Dow Jones index can be expected to fall further to the next support level 47525.00 (low of the previous correction ii).

Nasdaq100I'm biased for sell in Nasdaq100. Looking in the weekly TF look sell. Though for the entry I'm skeptical about it, I'm not sure if it will react to the entry area I marked which is the previous structure or it might break the previous structure first before it pushes the market for short. I'll be watching the market movement before I enter the market.

Head and shoulders Head and shoulders formed on SPX 3 and 6 MO charts. Confirmed preemptively by momentum

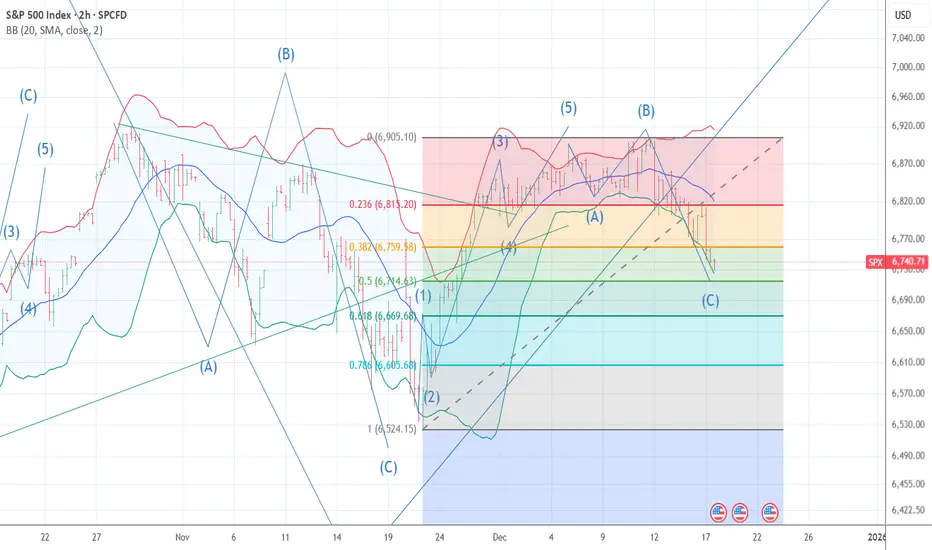
Only Bullish wave count Ax 2.618 = wave C for B or 2 The chart posted is the ONLY bullish wave count .I have taken a 15 % long here at 6734 best of trades WAVETIMER it is a HIGH risk trade
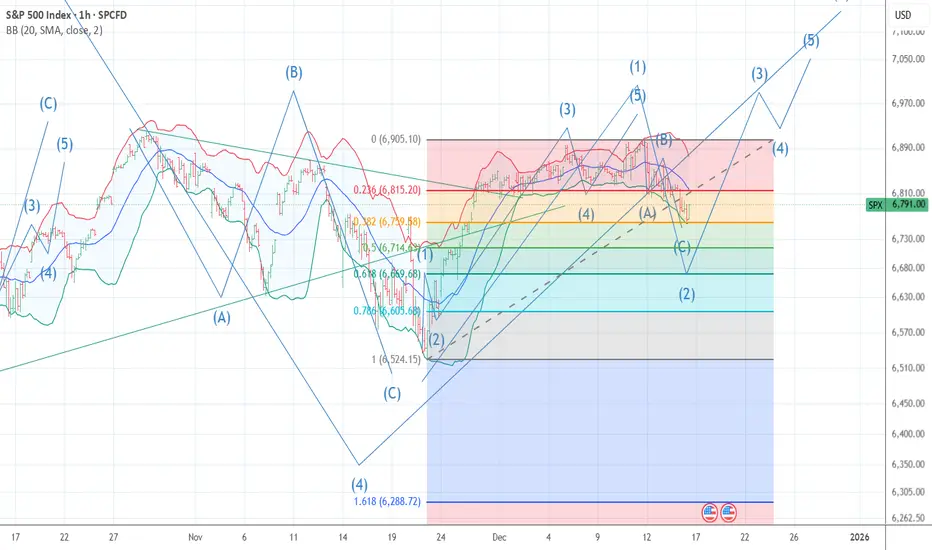
SP 500 abc decline has ENDED wave a=c to a .382 pullback 3 UPThe chart posted is the sp 500 I am calling the decline as Over and wave 3 up to start waves and c are equal and the drop was .382 > I now look for the santa rally to start in wave 3 up it should be .618 of wave 1 wave 3 should now see 6996 plus or minus 5. best of trades WAVETIMER I am NOW long calls at 75 %
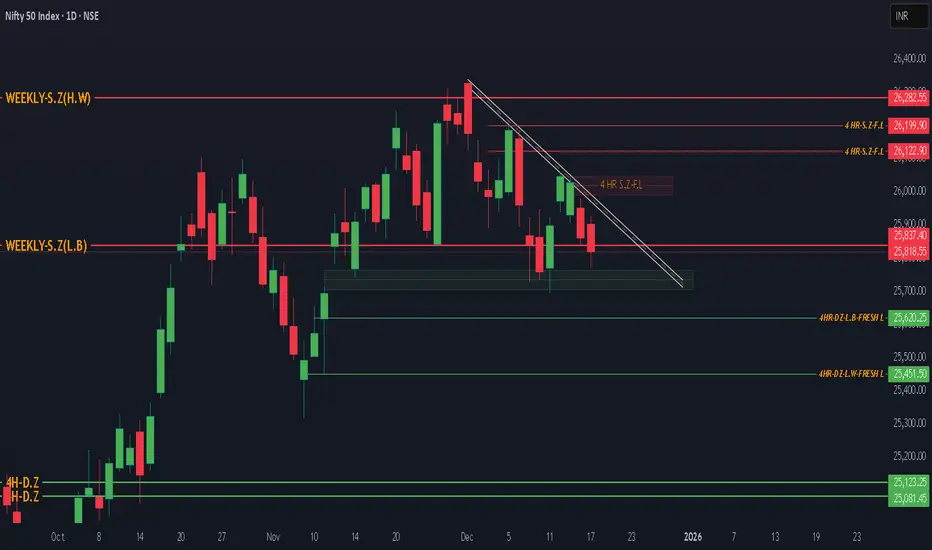
NIFTY FIFTY - Monthly , Weekly , and Daily Analysis > Previous Month (November) price has formed a Positive Base Candle.
* High- 26310 * Low - 25318 * Open - 25696 * Close - 26202
> On November 2 week price has given a Bullish Upside move after that continuesly 4 Week price has formed Base Candle No Upside or Downside Big Movementum.
> Current price of the market is 25693
> Previous week Low was 25693
Support Level in Higher Time Frame ( Minor Support Level)
1 . 25696 this level is the support of Monthly Time frame which nis the Open Price of the Previous Month Candle.
2 . 25500 this is the weekly support level.
Major Support Level
1 . 24734 to 24337 is the Major Support Level in Monthly Time Frame.
Reason-: This has 1 Drop candle 2 Base candle and A very Big Rally Candle which is the bullish pattern .
Now price has taken two times support from 25696. Now this level is week and upside two good supply zones are there in 4 hour time frame.
And Downside 25620 to 25451 is the next demand zone in 4 hour time frame which can give support to the price.
RSI Indigator is also showing downside diversion from 29th October 2025.

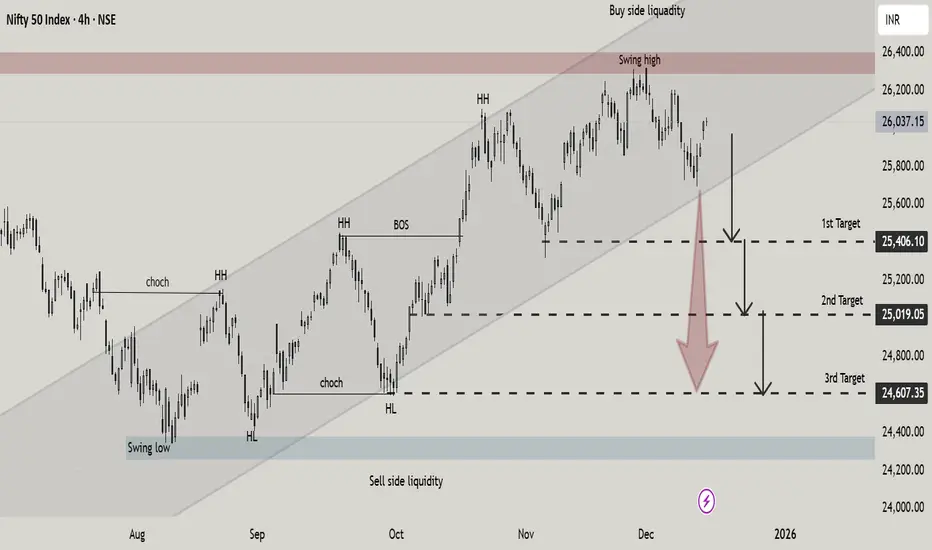
NIFTY 50 Rejection & Downside Targets in Focus NIFTY 50 on the 4H timeframe has reached a key buy side liquidity zone near the upper boundary of an ascending channel. After forming a swing high price shows signs of distribution and potential reversal. A downside move is anticipated toward sell-side liquidity with projected targets at 25,406, 25,019, and 24,607. Bias remains bearish below the recent highs.
Update at 1130amLooks like it's a sell unless buyers come in very soon and get the market above 6790
Good luck!

US500: Beware of a Possible DowntrendUS500: Beware of a Possible Downtrend
US500 found a strong resistance area near 6920, as we can see the price reacting quickly. There is a high possibility that we will have a strong resistance area near the top of the structure, which could push the price back down to the bottom of a larger corrective pattern, with support/target 6500 - 6550.
I don't like to sell indices in these extremely bullish conditions, but you can take this as a possible downside scenario that this move could happen, and it could help you in your trading.
If you want to sell indices, I would only advise you to buy PUT options, considering that the risk is more limited compared to CFD trading.
The price could fall to 6700 and 6500, created by year-end profits.
If the price moves above 6920, this analysis will be invalid.
You may find more details in the chart!
Thank you and Good Luck!
PS: Please support with a like or comment if you find this analysis useful for your trading day
