Longest Losing Streak Since 2020 Crash Puts Nifty Under Pressure● Nifty has logged its longest losing streak since the COVID-19 crash in 2020, marking six consecutive weeks of decline.
● After breaking below the key 24,500–24,400 support zone, the index now faces the risk of sliding towards 24,000.
● Options data suggests 24,500 will act as immediate resistance, while 24,000 remains a crucial support.
● Fresh bullish momentum is unlikely unless the index sustains above 25,000.
● With ongoing geopolitical tensions and persistent FII outflows, overall market sentiment is expected to stay weak.
● Traders should adopt a sell-on-rise approach with strict risk management, as the market enjoys catching traders off guard.
Market indices

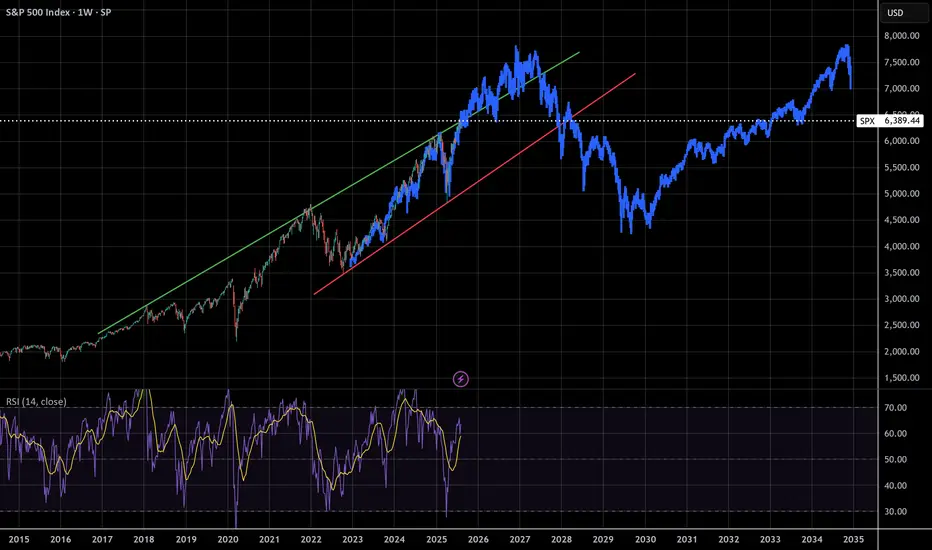
Dot Com Crash CorrelationThe following is a fractal of the lead up to the Dot Com crash, and the aftermath. It correlates extremely well with the current landscape. The TLDR is that if history repeats and we break the trendline, we'll form a blow off top in 2026 and crash spectacularly in 2027 (I'm guessing around May, a common dump month). If everyone is calling for the crash now, it means it's not over yet.
It's time to face the music. AI isn't profitable, it's an excuse to fire workers with high salaries. When there is no one left to fire and productivity/quality drops the answer will be clear: A program that is wrong 20% of the time is completely useless. The errors are a feature, not a bug, the AI can not work without hallucinating and hallucinating causes errors. Look it up if you don't believe me
Fundamentals:
-Rate cuts will keep this alive long enough to form a blow off top
-Extreme uncertainty from tariffs to manufacturing can account for that mid term drop
-AI Companies holding up the market make 0 net profit and have no realistic plans to make ROI
-The vast majority of AI companies have not made ROI
-Generative AI costs more to run than it makes. By their own very flawed estimate, OpenAI will take over 10 years to break even. In related news, snapchat just made ROI and they were founded in 2011, their stock is down 90%.
GER40 – Testing 24,300.00 Resistance ZoneGER40 has been pushing higher after reclaiming the 24,100.00 level, with price now consolidating just below the 24,300.00 resistance. Bulls are attempting to break through this zone to target the 24,652.29 high.
Support at: 24,100.00 🔽 | 23,950.00 | 23,800.00 | 23,400.00
Resistance at: 24,300.00 🔼 | 24,652.29 (ATH)
🔎 Bias:
🔼 Bullish: A breakout and close above 24,300.00 could trigger a rally toward the ATH at 24,652.29.
🔽 Bearish: Rejection at 24,300.00 with a drop below 24,100.00 may send price back toward 23,950.00.
📛 Disclaimer: This is not financial advice. Trade at your own risk.

US100 Local Long!
HI,Traders !
#US100 made a retest
Of the horizontal support
Level of 23266.0 from where
We are already seeing a
Local bullish rebound so
We will be expecting a
Further bullish move up !
Comment and subscribe to help us grow !

Learning#05 : Decoding Highs and Lows📚 Learning#05 : Decoding Highs and Lows
- A Trader’s Guide to Reading the Market - Simple Yet Important
If the market were a book, the trend would be its storyline — and as traders, our job is to read that story without skipping pages. Trading with the trend puts the odds in your favor because you’re flowing with the market’s natural momentum, not fighting it.
Whether it’s an uptrend, downtrend, or a sideways grind, spotting it early gives you a big edge in deciding when to enter, when to exit, and when to simply step aside.
One of the simplest yet most reliable ways to read that story?
👉 Story of Highs and Lows
Let’s break it down.
📚 Understanding Highs and Lows in Trading
In technical analysis, highs and lows are the market’s way of leaving breadcrumbs.
A high is a peak before the market pulls back.
A low is a trough before the market bounces.
Track these points over time and you start to see patterns that reveal the market’s mood — bullish, bearish, or indecisive.
This isn’t about guessing; it’s about observing price action as it is.
📌 The Four Key Building Blocks of Market Structure
1️⃣ Higher Highs (HH)
Each new high is higher than the one before.Paired with higher lows, this signals an uptrend. Buyers are in control, and demand is pushing price upward.
Example: Nifty rallies from 22,000 to 22,200, pulls back to 22,100, and then rallies to 22,350. That second high (22,350) is higher than the first, confirming bullish momentum.
2️⃣ Higher Lows (HL)
Each pullback low is higher than the last.This tells you that sellers tried to push the market down — but buyers stepped in sooner this time, showing strength.
HLs often precede trend continuation and give great spots for entering long positions with tight risk.
3️⃣ Lower Lows (LL)
Each new low is lower than the previous one.Paired with lower highs, this marks a downtrend. Selling pressure is in charge, and rallies are being sold into.
4️⃣ Lower Highs (LH)
Each bounce high is lower than the last.This shows weakening buying pressure and often leads to another push lower.
Think of it like climbing stairs vs. walking down a hill:
📌 HH + HL = Stairs up → Bull trend.
📌 LL + LH = Hill down → Bear trend.
📈 HH+HL : Bullish Setup :
📉 LL+LH : Bearish Setup :
📌 Why It Matters for Traders
Price action is the most honest information in the market — no lag, no magic, no guesswork.
HH/HL → Bulls in control → Look for long setups.
LL/LH → Bears in control → Look for short setups.
Spotting these patterns on the fly means you can align with the dominant side instead of fighting it.
🧩 Combining HH & LL With Other Tools
📏 Fibonacci Retracements
Once you’ve identified the trend:
In an uptrend, draw Fibonacci from the latest HL to HH for pullback buying zones.
In a downtrend, draw from the latest LH to LL to find shorting opportunities.
⛰️ Fractals for Clarity
Fractals help pinpoint swing highs and lows without guesswork. I personally track HH/HL/LL/LH on a 1-minute chart for intraday trading — this keeps me in sync with the micro-trend while avoiding sideways traps.
🔀 Trendlines & VWAP
Trendlines show the bigger path, VWAP confirms intraday balance. When HH or LL aligns with these, you’ve got high-confluence setups.
🥷 Kiran’s Approach
For intraday, I start by mapping the structure: HH, HL, LL, LH. This gives me the immediate trend bias and alerts me to potential reversals early. I track them on a 1-min chart, combine with Fibonacci and trendlines, and trail stops as the structure unfolds.
It’s simple, visual, and keeps me out of bad trades and warns me to stay out of a sideways market situation, too.
🔑 Key Takeaway
Market structure is like a language — HH, HL, LL, and LH are its alphabet. Once you learn to read it, you’ll never trade blind again.
💡 “Trade what you see, not what you think. The chart always whispers first — you just have to listen.”
Start marking highs and lows on your chart tomorrow. Watch the story unfold. Trade in sync, and you’ll notice your entries become sharper, your exits cleaner, and your confidence higher.
See you in the next one — and until then:
Keep it simple. Trade with structure. Trust the levels.
— Kiran Zatakia
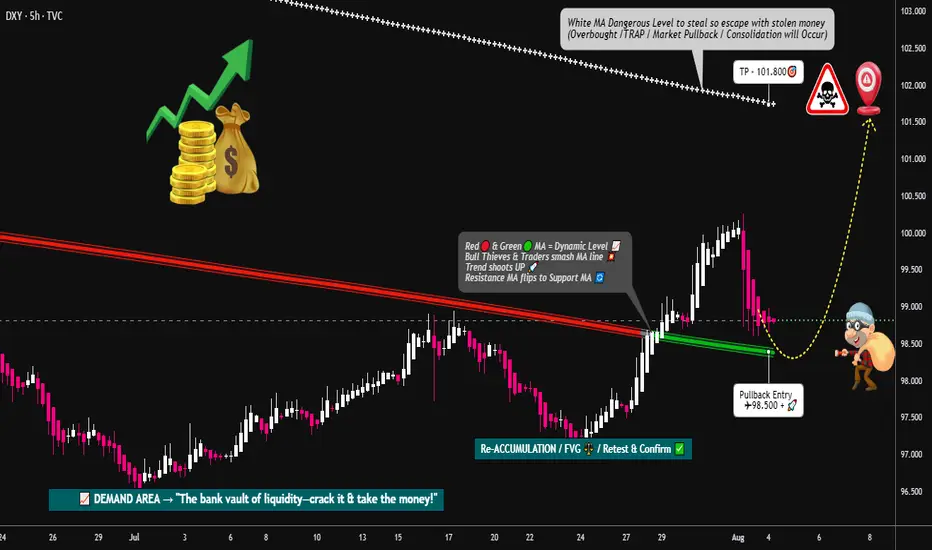
DXYHere’s the English description of the two scenarios in your chart:
Scenario 1 (Green Path):
Price drops from the current level (~98.26) towards the demand zone around 97.50–97.60, finds support, and then rallies sharply, breaking above the 98.80–99.00 resistance zone and continuing higher toward the 100.20–100.40 level.
Scenario 2 (Orange Path):
Price first pushes upward toward the 98.80–99.00 supply zone, faces rejection, then falls sharply to the demand zone around 97.50–97.60, before reversing and rallying strongly toward the 100.20–100.40 target.

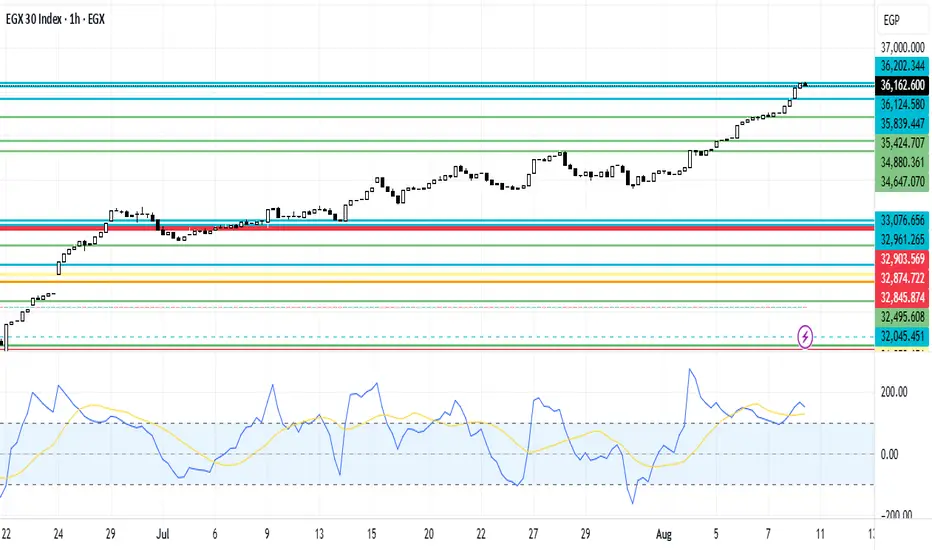
EGX30 Positive TrendEGX30 stock is currently in a rising region. In case of continuing, it's expected to breach the resistance line 36,202.344. In case of decreasing, it's expected to reach the support line 35,424.707, 34,880.361, then 34,647.070. This is a result of positive news as Egypt's blue-chip index EGX30 advanced for a fourth day and rose 1.6% to hit a record high at 35,254. EAST soared 5.5% and TMGH gained 0.7%. Meanwhile, Egypt's non-oil private sector showed signs of stabilization in July, with employment rising for the first time in nine months and a softer decline in output and new orders, the S&P Global Egypt PMI report said. Egypt's blue-chip index EGX30 advanced for a fifth day and rose 0.6% to hit a fresh record high at 35,480. ETEL soared 4.8% and FWRY gained 1.9%. Meanwhile, Egypt's net foreign reserves rose to $49.036 billion in July from $48.7 billion in June, the central bank said on Tuesday.
Nifty analysis On the weekly Nifty chart, the 40-week EMA is around 24,188, currently just ~175 points below the market at 24,363, with a bullish imbalance (FVG) sitting just above it; the last time Nifty dipped below this EMA was in Feb–Mar 2024, only ~1.35% (~300 points) under, before reversing from a confluence of a prior swing low, unfilled bullish FVG, and 50-week EMA support. If the EMA breaks now, the strongest support lies at 23,800–23,850, which is aligned with a March–April 2025 bullish order block and swing low. Given current macro conditions—U.S. tariffs on Indian exports, six straight weeks of FII selling, weak earnings, and geopolitical trade tensions—there’s about an 80% probability Nifty will test both the nearby FVG and EMA in weekly tf, the strongest resistances from the current price are 24,750–24,800 (recent lower high and bearish FVG, a near-term liquidity zone) and 25,050–25,100 (major swing high, start of last big sell-off, and 50% retracement of the recent drop), with the latter being the critical “supply wall” that would need to break to turn the weekly trend bullish again.

I guess maybe nifty will form a double top in Monthly TF and canI guess maybe nifty will form a double top in Monthly TF and can come to blue Trendline like previous one it did.

DOW JONES Channel Up on its strongest Support.Dow Jones (DJI) has been trading within a Channel Up since the April 25 Low and right now it is consolidating straight after a direct contact and bounce on the 1D MA50 (blue trend-line).
Given that this also took place at the bottom of the Channel Up, it is a technical Higher Low formation, thus the strongest Support level possible.
With the 1D RSI also rebounding around the same level as the previous Higher Low, we expect the next technical Bullish Leg of the Channel Up to begin. The previous two rose by at least +7.00%, so the minimum Target we are looking for on the short-term is 46350.
-------------------------------------------------------------------------------
** Please LIKE 👍, FOLLOW ✅, SHARE 🙌 and COMMENT ✍ if you enjoy this idea! Also share your ideas and charts in the comments section below! This is best way to keep it relevant, support us, keep the content here free and allow the idea to reach as many people as possible. **
-------------------------------------------------------------------------------
Disclosure: I am part of Trade Nation's Influencer program and receive a monthly fee for using their TradingView charts in my analysis.
💸💸💸💸💸💸
👇 👇 👇 👇 👇 👇

Nasdaq may consolidate in channalNasdaq may consolidate in channal. Waiting some big news to trigger.

Nifty is resting on support, likely to retrace from hereNifty is resting on support, likely to retrace from here. This fall is attributed to incresed US Tariff from 25 to 50 % to India

NASDAQ Potential UpsidesHey Traders, in today's trading session we are monitoring NAS100 for a buying opportunity around 23,300 zone, NASDAQ is trading in an uptrend and currently is in a correction phase in which it is approaching the trend at 23,300 support and resistance area.
Trade safe, Joe.

Nifty trend directionNifty 24363 has slipped it's support 462
Lat hour short covering also couldn't help to recover shows no buying interest.As posted earlier we expect nifty will drop to 24060.fii's have sold contracts and bearish in derivatives by selling calls and buying puts.

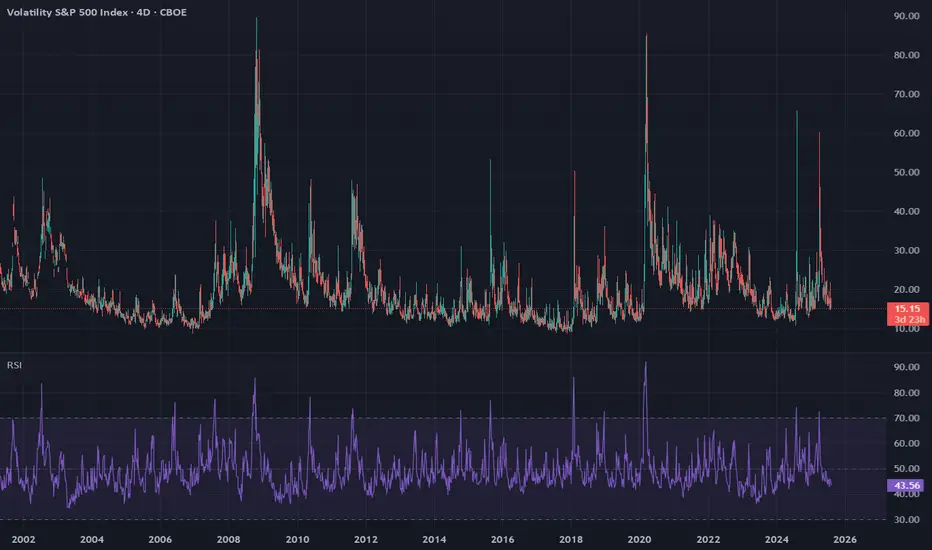
Have we entered a brand new normal or is a crash coming?The market's bullish narrative rests first and foremost on the control of volatility. I won't go too much deeper into that right now, but I have been discussing with AI the current period of volatility expression and would like to highlight the following points about the current period:
4d VIX RSI has not had a 5 point increase since April 1 of this year. That's 129 days and counting.
From Claude AI (Anthropic):
The ongoing 4 day VIX RSI fall period (started April 1, 2025, now at 128+ days) is completely unprecedented since September 2003 (when VIX formula was modernized).
That's already:
More than double the longest ever previous period of in October 28, 2020 to Jan 27, 2021 (63 days)
Nearly 10x longer than the average period (13.14 days)
Over 12 standard deviations beyond the mean
The only period ever to exceed 70 days since September 2003
Key Insight:
Since September 2003, 67.3% of all fall periods recovered within 2 weeks, and 84.2% recovered within 3 weeks. The current 128+ day period represents an extreme statistical outlier in modern VIX behavior.
Additionally, if we look at the S and P week chart, we see that the gap from May 9 to May 12 is the largest ever unfilled weekly gap in the entire history of the S and P.
We are currently in a whole new normal of "bullishness", akin to the time period just before the great crash and great depression (which was the most bullish the stock market has ever been).
US2000 Bearish Alert: Institutional Shorts Spike 300%, TechnicalInstitutional Sentiment Shift
Net short interest exploded from –30K in early July to –90K by early August—a 300% jump in bearish conviction.
Daily Chart:
On August 1, US2000 closed below key support, carving a lower low—the first technical indication of a bearish reversal.
Weekly Chart:
A clear bearish engulfing candlestick reinforces the likelihood of further downside.
Macro & Market Backdrop:
• The Fed remains hawkish, quashing near-term rate cut expectations.
Reuters
• Small-caps continue to underperform—Russell trades rich but offers less structural strength compared to large-caps.
MarketWatch
• With stagflation risks rising, small/mid-cap companies could face underperformance and tighter financing conditions.
MarketWatch
Bottom Line:
With institutional short positioning intensifying, market structure turning bearish, and macroeconomic challenges mounting, the US2000 is poised for further pressure. Traders—watch for follow-through declines.

SPX range bound unit September expirationExpect sideways wave 4 to last 4 weeks, volatility, (small positions: sell up, buy dips or do NPOTHING and hold. Basically these types of Wave-4 are where traders loose money from Wave-3.
Lower High Complete?OFC earnings provided buys a good level to pick up price but POC at 6375 was key.
The 4HR shows and englufing with LH partially complete.
Bias is Short!

DXY Locked & Loaded: Robber's Gameplan for Profit Pullout💸💼 "DXY Market Heist Blueprint – The Thief's Bullish Escape Plan" 💼💸
Rob the Market, Not the Rules – Trade Smart, Trade Sharp, Trade Thief Style™
🌍 Hey Money Makers, Risk Takers & Market Robbers!
Hola! Ola! Bonjour! Hallo! Marhaba! 🙌
Let’s break into the DXY vault and swipe those profits with precision. 💼💸
🧠💡This Thief Trading Style™ Master Plan is a high-stakes operation backed by technical setups, macro-fundamentals, and robbery-level insights. Follow the blueprint laid out on the chart. Our target? The High-Risk Yellow ATR Zone – where the real treasure is buried.
💼 ENTRY: "The Vault Is Open – Grab the Bullish Bags!"
Enter long as price approaches key pullback levels within a 15–30 min timeframe. Use the most recent candle wick’s swing low/high for sniper-style DCA entries.
🔑 Layer multiple limit orders like a thief stacking getaway bags (aka the DCA / Layering Method). Be patient and precise.
🛑 STOP LOSS: "Don’t Get Caught by the Market Police"
📍 Place SL just below the nearest 4H swing low (example: 97.300) depending on your strategy (scalping/swing).
⚖️ Your SL should reflect your risk appetite, lot size, and how many limit orders you’re running. Thieves don’t risk it all on one job. 🎭
🎯 TARGET: 101.800 (or Escape Before the Sirens)
Once the target zone nears, decide whether to collect full loot or exit before resistance hits. We trade smart, not greedy. 🧠💰
📈 Why This Heist Makes Sense: Market Conditions Breakdown
Bullish momentum supported by macro drivers and intermarket forces
COT report and sentiment leaning in favor of USD
Dollar Index structure showing signs of reversal + trend confirmation
Consolidation trap zones hinting at institutional accumulation
💡 This is not just a blind entry—it's a well-researched and time-tested plan. Check the chart details and refer to:
🔗 Fundamentals | COT Reports | Sentiment Score | Quantitative Outlook
🚨 NEWS & POSITION MANAGEMENT ALERT
Before jumping in, beware of high-impact news!
🗞️ To keep your trades safe and stress-free:
Avoid opening new positions during major news releases
Use trailing SLs to protect gains
Monitor volatility triggers (economic calendar is your best friend!)
🏴☠️💥 BOOST THE ROBBERY – Hit That Like/Boost Button
The more you boost, the stronger the heist crew becomes! 💪🚀
Help fellow traders steal opportunities with the Thief Trading Style™ – calculated, bold, and sharp.
🔥 Let's continue to outsmart the markets and make each trade count. Stay tuned for the next heist update – fresh trades, deeper insights, and bigger bags. 🤑💼
🔔 Disclaimer: This plan is not financial advice. Use it for educational and entertainment purposes. Always conduct your own analysis and manage risk accordingly.
📌 Markets shift quickly. Stay adaptable, informed, and always ready to pivot.
AUS200 – Retest of 8,634.00 After Swing High RejectionAUS200 pulled back sharply after tagging the recent high at 8,784.83, now testing the 8,634.00 support zone which aligns with the 21 SMA. This level is acting as the immediate battleground.
Support at: 8,634.00 🔽 | 8,530.00 | 8,400.00
Resistance at: 8,784.83 🔼
🔎 Bias:
🔼 Bullish: If price stabilizes above 8,634.00 and reclaims bullish momentum, we could see another retest of the high at 8,784.83.
🔽 Bearish: A daily close below 8,634.00 puts 8,530.00 and 8,400.00 in play, especially if the 21 SMA fails to hold as dynamic support.
📛 Disclaimer: This is not financial advice. Trade at your own risk.

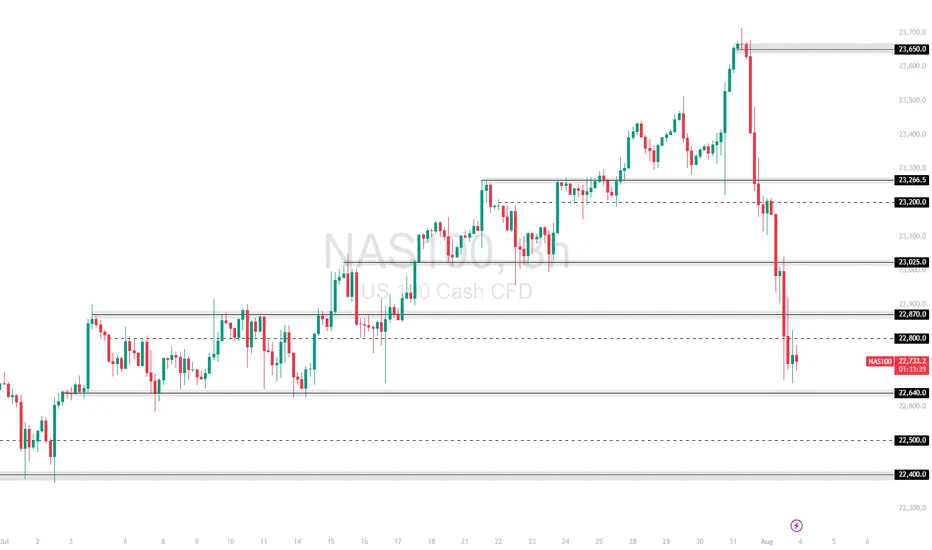
NAS100 Slammed by Fed Data and Trump Trade Remarks Can 22,640 ?The NAS100 plunged after strong US economic data fueled expectations of tighter Fed policy, and Trump's renewed push for aggressive trade deals rattled tech sentiment. After rejecting the 23,665 🔼 resistance, the index dropped sharply through multiple support levels.
Price is now consolidating just above the 22,640 🔽 zone, a key near-term support.
Support: 22,800 🔽, 22,640 🔽, 22,500 🔽
Resistance: 23,025 🔼, 23,277 🔼, 23,332 🔼
Bias:
🔽 Bearish: A breakdown below 22,640 could trigger a move toward 22,500. If that fails, 22,400 becomes the next target.
🔼 Bullish: A reclaim of 23,025 would be the first sign of bullish recovery.
📛 Disclaimer: This is not financial advice. Trade at your own risk.
US30 Risky Long!
HI,Traders !
#US30 is trading in an uptrend
So despite a local correction
We are bullish biased and
As we are already seeing
A bullish rebound from the
Local horizontal support
Of 43885.9 a further
Bullish move up is
To be expected !
Comment and subscribe to help us grow !

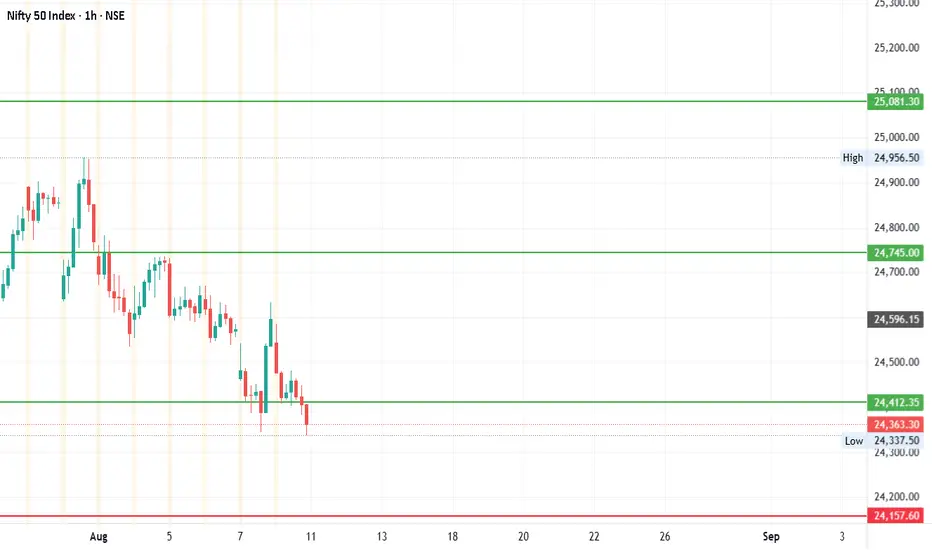
#Nifty - Levels for Aug 2025 Date: 09-08-2025
Nifty Current Price: 24363.3
Pivot Point: 24746 Support: 24412 Resistance: 25081
Upside Targets:
| Target | Price |
| ----------- | ---------|
| 🎯 Target 1 | ₹25335 |
| 🎯 Target 2 | ₹25589 |
| 🎯 Target 3 | ₹25905 |
| 🎯 Target 4 | ₹26221 |
Downside Targets:
| Target | Price |
| ----------- | ---------|
| 🎯 Target 1 | ₹24158 |
| 🎯 Target 2 | ₹23903 |
| 🎯 Target 3 | ₹23587 |
| 🎯 Target 4 | ₹23271 |
#TradingView #Nifty #BankNifty #DJI #NDQ #SENSEX #DAX #USOIL #GOLD #SILVER
#BHEL #HUDCO #LT #LTF #ABB #DIXON #SIEMENS #BALKRISIND #MRF #DIVISLAB
#MARUTI #HAL #SHREECEM #JSWSTEEL #MPHASIS #NATIONALUM #BALRAMCHIN #TRIVENI
#USDINR #EURUSD #USDJPY #NIFTY_MID_SELECT #CNXFINANCE
#SOLANA #ETHEREUM #BTCUSD #MATICUSDT #XRPUSDT
#Crypto #Bitcoin #BTC #CryptoTA #TradingView #PivotPoints #SupportResistance