What the Next CPI Print Could Do to the S&P500What the Next CPI Print Could Do to the S&P500
A technical and macro setup ahead of the inflation release
Next week’s CPI report could be one of the most important data points of the quarter, not just for the Fed, but for traders watching the S&P500 (SPX) at these elevated levels.
We’ve seen inflation data act like a volatility trigger in recent months, especially when it diverges from market expectations. And with the S&P flirting with key resistance, the stage is set for either a breakout or a reversal.
Let’s break down both the macro implications and the technical chart setup heading into the release.
Why CPI Matters?
If headline CPI comes in hot, markets may price in fewer Fed cuts this year. Yields spike and SPX often reacts with a sharp pullback.
If inflation cools faster than expected, the Fed may stay dovish. That typically gives SPX and risk assets broadly room to breathe higher.
Current expectations:
- Headline CPI: 3.2 percent
- Core CPI: 3.4 percent
Anything above those numbers is risk-off. Anything below supports the soft landing narrative.
Technical Setup on SPX
On the 4H and daily chart, here’s what we’re seeing:
- Price hovering around a key resistance zone between 5,660 and 5,680
- Rising wedge structure starting to form, typically a bearish sign near market tops
- Bearish RSI divergence on 1D chart
- Volume has been declining on recent pushes higher, showing lack of conviction
Key Levels
- Support: 5,615 and 5,575
- Breakout Target (if CPI is dovish): 5,750 to 5,770
- Downside Target (if CPI surprises hot): 5,500 to 5,480
Watch for a volatility spike on the release and be cautious about chasing the first move.
My Play
I’m personally staying flat heading into the data.
Too much chop, not enough conviction. But I’ll be watching for:
- A false breakout trap above 5,680 followed by reversal as a possible short setup
- Or a clear retest and hold above 5,700 with volume, which may confirm further upside
CPI has become the new FOMC. Be patient and reactive, not predictive.
Final Thought
CPI prints used to be background noise. Not anymore.
This one matters, and SPX is sitting in a technical pressure cooker.
Whatever side you lean toward, come in with a plan and don’t trade the first candle.
Market indices
DXY Analysis todayHello traders, this is a complete multiple timeframe analysis of this pair. We see could find significant trading opportunities as per analysis upon price action confirmation we may take this trade. Smash the like button if you find value in this analysis and drop a comment if you have any questions or let me know which pair to cover in my next analysis.

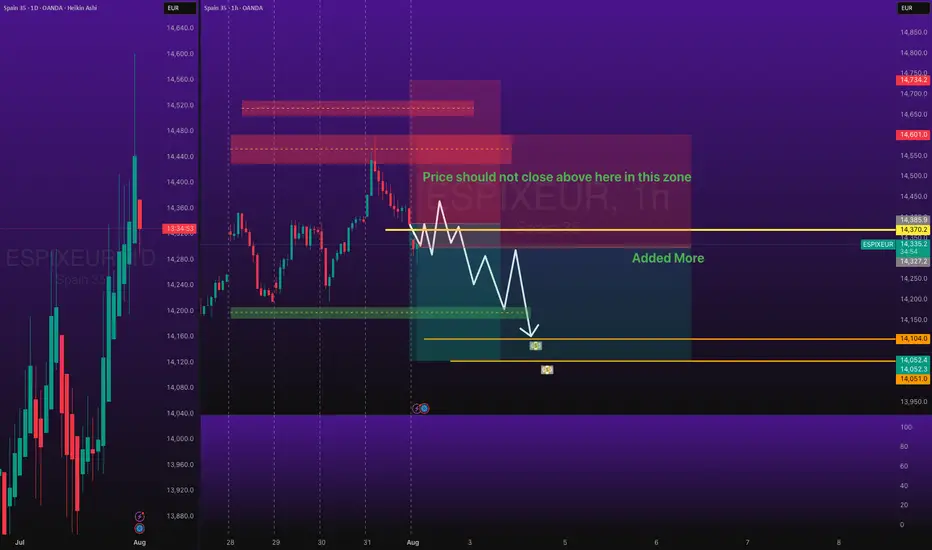
ESPIXEUR Short Trade with SL and TPOANDA:ESPIXEUR Short Trade - Low Risk, with my back testing of this strategy, it hits multiple possible take profits, manage your position accordingly.
Note: Manage your risk yourself, its risky trade, see how much your can risk yourself on this trade.
Use proper risk management
Looks like good trade.
Lets monitor.
Use proper risk management.
Disclaimer: only idea, not advice
#DAXDate: 01-08-2025
#DAX Current Price: 23680
Pivot Point: 24193.295 Support: 23822.409 Resistance:24566.692
Upside Targets:
🎯 Target 1: 24882.344
🎯 Target 2: 25197.995
🎯 Target 3: 25574.758
🎯 Target 4: 25951.520
Downside Targets:
🎯 Target 1: 23505.502
🎯 Target 2: 23188.595
🎯 Target 3: 22811.833
🎯 Target 4: 22435.070
#TradingView #Nifty #BankNifty #DJI #NDQ #SENSEX #DAX #USOIL #GOLD #SILVER
#BHEL #HUDCO #LT #LTF #ABB #DIXON #SIEMENS #BALKRISIND #MRF #DIVISLAB
#MARUTI #HAL #SHREECEM #JSWSTEEL #MPHASIS #NATIONALUM #BALRAMCHIN #TRIVENI
#USDINR #EURUSD #USDJPY
#SOLANA #ETHEREUM #BTCUSD #MATICUSDT #XRPUSDT
#Crypto #Bitcoin #BTC #CryptoTA #TradingView #PivotPoints #SupportResistance

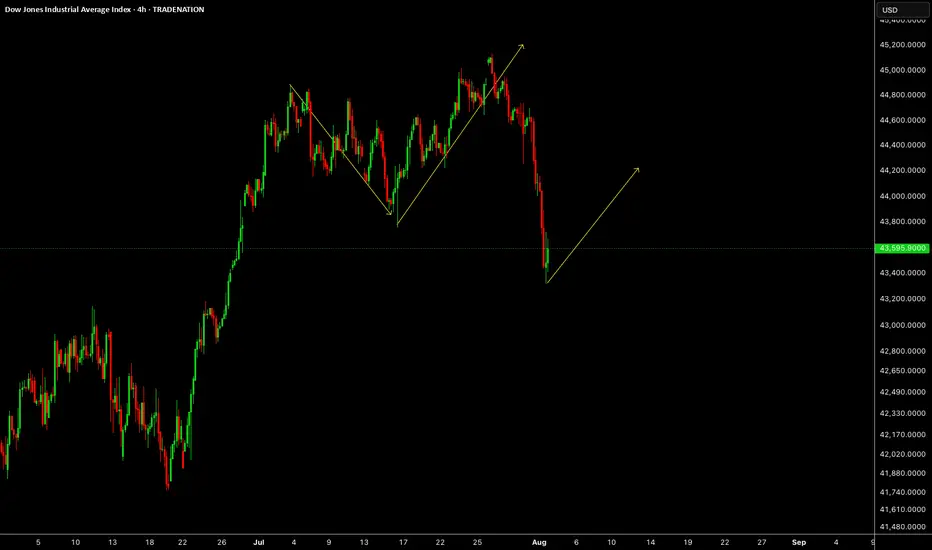
US30US30 was expected to drop last week which is what market has done. This week we need upside correction or impulse.
Disclosure: We are part of Trade Nation's Influencer program and receive a monthly fee for using their TradingView charts in our analysis.
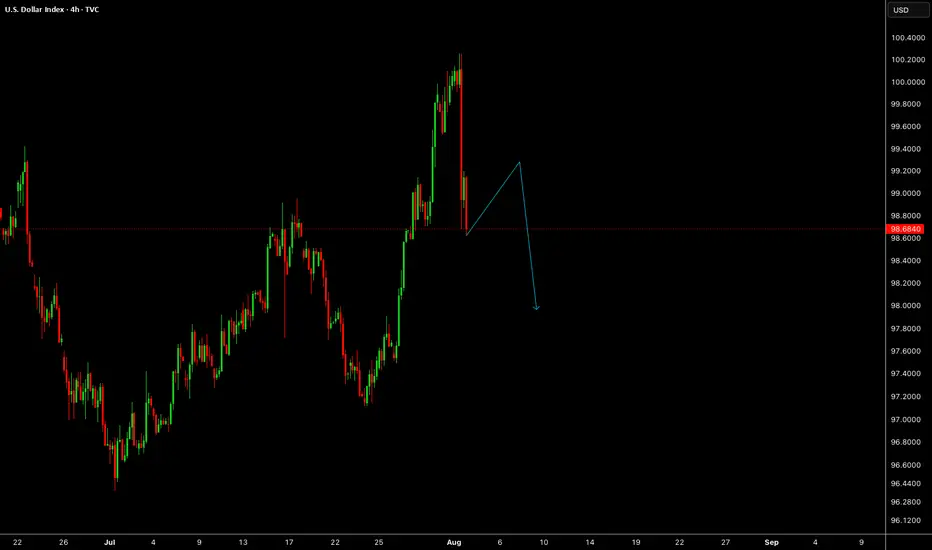
DXYDXY has given us a drop last week, lets wait for a correction to trade another drop.
Disclosure: We are part of Trade Nation's Influencer program and receive a monthly fee for using their TradingView charts in our analysis.
Germany 40DE40 Looks like doing this. It's going to retest an old area that was used bypassed while making an all time high.

UPDATEFriday we closed on the breakeven after that the price reached our 50% level of the trade, so our TP was raised to the breakeven.
Follow for more trades to catch up the next week!

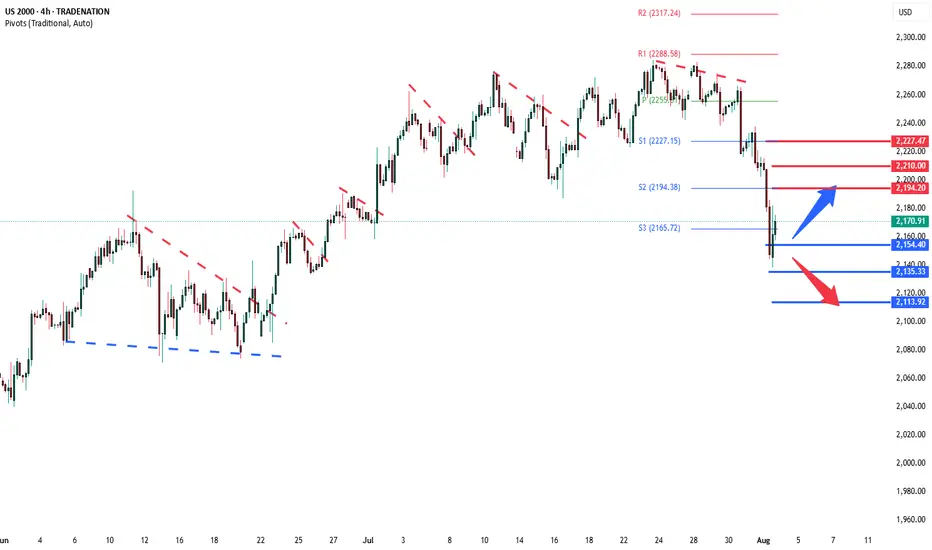
Russell2000 Key Trading levelsKey Support and Resistance Levels
Resistance Level 1: 2194
Resistance Level 2: 2210
Resistance Level 3: 2227
Support Level 1: 2154
Support Level 2: 2135
Support Level 3: 2113
This communication is for informational purposes only and should not be viewed as any form of recommendation as to a particular course of action or as investment advice. It is not intended as an offer or solicitation for the purchase or sale of any financial instrument or as an official confirmation of any transaction. Opinions, estimates and assumptions expressed herein are made as of the date of this communication and are subject to change without notice. This communication has been prepared based upon information, including market prices, data and other information, believed to be reliable; however, Trade Nation does not warrant its completeness or accuracy. All market prices and market data contained in or attached to this communication are indicative and subject to change without notice.
Stoxx50 sideways consolidation continuesKey Support and Resistance Levels
Resistance Level 1: 5464
Resistance Level 2: 5500
Resistance Level 3: 5580
Support Level 1: 5152
Support Level 2: 5097
Support Level 3: 5044
This communication is for informational purposes only and should not be viewed as any form of recommendation as to a particular course of action or as investment advice. It is not intended as an offer or solicitation for the purchase or sale of any financial instrument or as an official confirmation of any transaction. Opinions, estimates and assumptions expressed herein are made as of the date of this communication and are subject to change without notice. This communication has been prepared based upon information, including market prices, data and other information, believed to be reliable; however, Trade Nation does not warrant its completeness or accuracy. All market prices and market data contained in or attached to this communication are indicative and subject to change without notice.

FTSE oversold bounce backThe FTSE remains in a bullish trend, with recent price action showing signs of a corrective pullback within the broader uptrend.
Support Zone: 9026 – a key level from previous consolidation. Price is currently testing or approaching this level.
A bullish rebound from 9026 would confirm ongoing upside momentum, with potential targets at:
9170 – initial resistance
9208 – psychological and structural level
9245 – extended resistance on the longer-term chart
Bearish Scenario:
A confirmed break and daily close below 9026 would weaken the bullish outlook and suggest deeper downside risk toward:
8990 – minor support
8950 – stronger support and potential demand zone
Outlook:
Bullish bias remains intact while the FTSE holds above 9026. A sustained break below this level could shift momentum to the downside in the short term.
This communication is for informational purposes only and should not be viewed as any form of recommendation as to a particular course of action or as investment advice. It is not intended as an offer or solicitation for the purchase or sale of any financial instrument or as an official confirmation of any transaction. Opinions, estimates and assumptions expressed herein are made as of the date of this communication and are subject to change without notice. This communication has been prepared based upon information, including market prices, data and other information, believed to be reliable; however, Trade Nation does not warrant its completeness or accuracy. All market prices and market data contained in or attached to this communication are indicative and subject to change without notice.

DXY for this week Technical Analysis – Inverse Head & Shoulders with Neckline Retest
Current Market Situation
The chart shows an Inverse Head & Shoulders pattern, which is a bullish reversal pattern.
The neckline has been broken to the upside, providing a strong signal for potential continued bullish momentum.
The price is currently in the neckline retest phase, a critical area to confirm the bullish trend before further upward movement.
Key Zones
Retest Zone (Pullback): 98.300 – 98.700, an important support area.
Demand Zone: If price dips further, an additional support zone lies between 97.500 – 97.000.
Monthly Trendline: Offers long-term structural support, reinforcing the bullish outlook.
Potential Scenarios
✅ Bullish Scenario (Preferred):
If the price holds above the retest zone and neckline:
Target 1: 101.000
Target 2: 102.500 – 103.500
⚠ Bearish Scenario (Invalidation):
A break below 97.000 invalidates the bullish scenario and opens the door for deeper downside movement.
Conclusion
The market shows strong bullish potential after confirming the neckline retest.
97.000 is the key invalidation level for the bullish setup.
Price action around the retest zone and demand area should be monitored closely before entering trades.
⚠️ Trade at your own risk – We are not responsible for any losses.

DOLLAR INDEX DXYThe U.S. Dollar Index (DXY) is a measure of the value of the United States dollar (USD) relative to a basket of six major foreign currencies. It reflects how strong or weak the dollar is compared to these currencies collectively. The index was created by the Federal Reserve in 1973
The six currencies included in the basket and their approximate weightings are:
Euro (EUR): 57.6%
Japanese Yen (JPY): 13.6%
British Pound Sterling (GBP): 11.9%
Canadian Dollar (CAD): 9.1%
Swedish Krona (SEK): 4.2%
Swiss Franc (CHF): 3.6%
The DXY is calculated as a weighted geometric average of the dollar's exchange rates against these currencies. When the dollar strengthens against this basket, the index rises; when it weakens, the index falls.
The index is widely used by traders, investors, and economists to gauge the overall strength of the U.S. dollar in global currency markets and to inform trading and economic decisions.
In essence, the Dollar Index provides a standardized barometer of the U.S. dollar's value against its major international trading partners' currencies.
The U.S. Dollar Index (DXY) is trading near 98.684 of August 1, Friday market close.
July saw the DXY record its first monthly gain in 2025 (rising nearly 1%) as a a result of the demand floor on ascending trendline acting as dynamic support .but selling has resumed at the start of August on ADP data report, the current supply roof presents resistance to upswing capping gains on economic outlook and immigration enforcement concern.
Key Fundamental Drivers (August 2025):
Fed Policy & Inflation: The Federal Reserve kept rates steady at 4.25–4.50% in July, but persistent inflation (core PCE up to 2.8% YoY in June) and the impact of new U.S. tariffs are keeping rate cuts on hold for now.
Tariffs & Trade Policy: Fresh, globally-applied U.S. tariffs announced at the end of July have heightened risk aversion, helped the dollar find support, and stirred inflation concerns—as import price increases feed into core inflation data.
Interest Rate Differentials: While the Fed holds rates high, other central banks (especially the ECB and BOE) are signaling further easing. The resulting policy divergence still gives the dollar some support, but large inflows into alternative markets (e.g., eurozone equities, gold, yen) have also pressured the greenback.
Safe-Haven Flows: Risk-off sentiment amid trade tension and global policy uncertainty continues to prompt investors to seek the relative safety of the dollar, limiting its downside.
Composition: The DXY measures the value of USD relative to a basket of currencies: euro (57.6%), yen (13.6%), pound (11.9%), Canadian dollar (9.1%), Swedish krona (4.2%), and Swiss franc (3.6%).
The path ahead depends on upcoming U.S. inflation prints, additional Fed commentary, and how global markets react to ongoing trade disputes and central bank moves.
Longer term,
The DXY remains under pressure at the start of August 2025 but is showing tentative signs of stabilization just below the key 100 mark. The trend will hinge on Fed policy, global inflation data, and the impact of new tariffs on both inflation and global risk appetite. If buying breaks and close above weekly resistance roof then 104-103 can be reclaimed.
trading is 100% probability ,manage your risk and know that any key level can fail.
#dollar #dxy #money #eurusd #gbpusd #audusd #usdjpy

DXY POTENTIAL SCENARIO two possible scenarios for DXY in next coming weeks , watch the support and wait for confirmation before buying Dollar ,

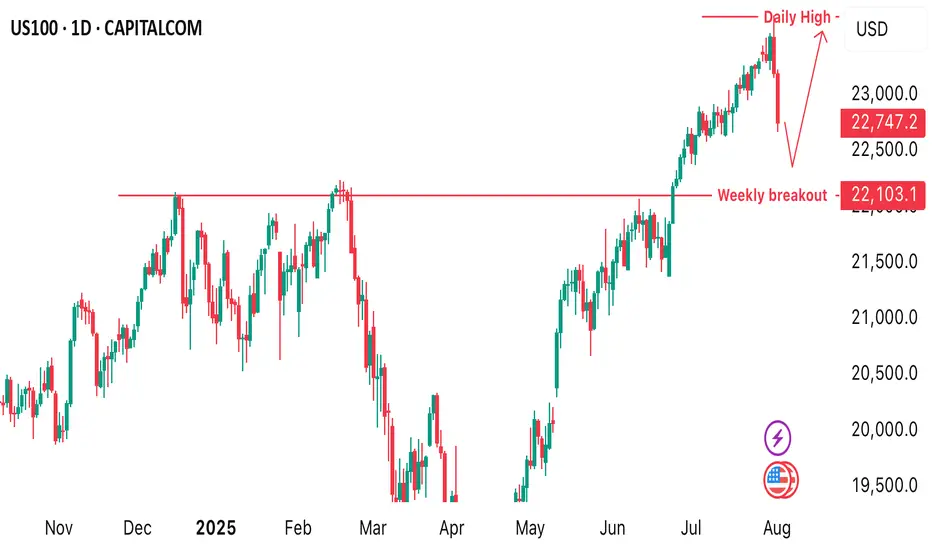
US100 makes a slight drop from ATH!Price dropped from the all time high of 23,703 we’re beginning to see a pullback in price. We’d be monitoring a time price will shift from intraday bearish to bullish. This is to help us position ourselves for a buy opportunity.
NAS100 - Potential Targets this WeekDear Friends in Trading,
How I see it,
(My week is building up; I'm using the DATA we have thus far)
Keynotes:
510k orders stacked at the current demand area.
If sellers push through Daily support decisively, it will become a strong resistance.
The real battlefield between sellers and buyer lies between 23250 - 23500.
Remember with stocks, Imbalances can remain unfilled for very long periods.
I sincerely hope my point of view offers a valued insight
Thank you for taking the time study my analysis.

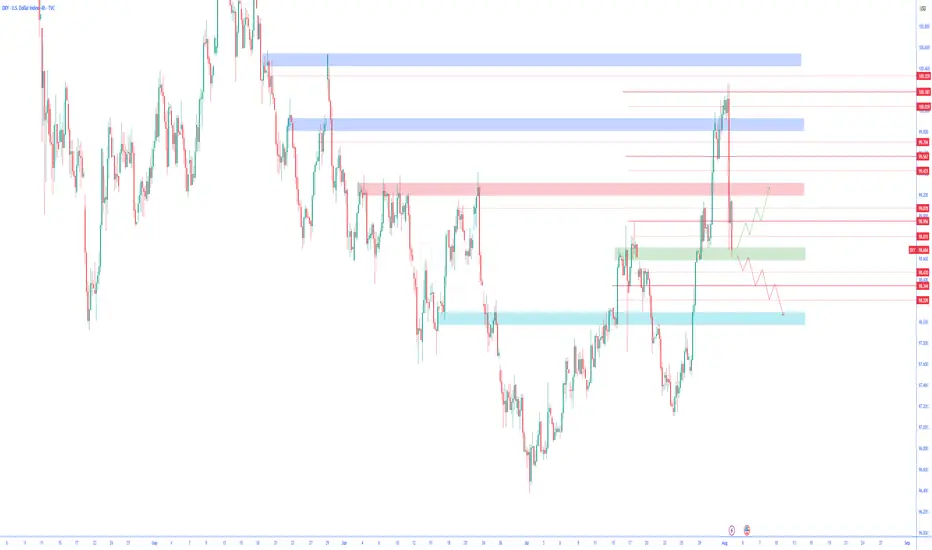
Technical Analysis | DXY | U.S. Dollar Index4-Hour Timeframe🔍 Technical Analysis | DXY | U.S. Dollar Index
4-Hour Timeframe
After hitting a strong supply zone marked in blue at the top of the chart, the price faced selling pressure and entered a bearish phase. Currently, the price is trading within a decision zone between buyers and sellers, where both bullish and bearish scenarios are possible.
🔼 Bullish Scenario:
If the price finds support at the mid-level support zone marked in green, and signs of a bullish reversal appear—such as proper candlestick formation or a renewed breakout of minor resistances (creating higher highs)—then the index is expected to move toward higher resistance levels.
🔽 Bearish Scenario:
Considering the market structure, if the mid-level support is lost and the price settles below this zone, the downtrend may accelerate. The dollar index could then move toward the lower support zone, marked in blue, which previously acted as a strong barrier and reversal area. This level may again serve as a key point to watch for market reactions.
✅ Conclusion
The U.S. Dollar Index is currently in a corrective phase, oscillating within a sensitive range. The price reaction to the current support zone will likely determine the next directional move. Therefore, it is recommended to wait for a confirmed breakout or bounce from this area before entering any trades.
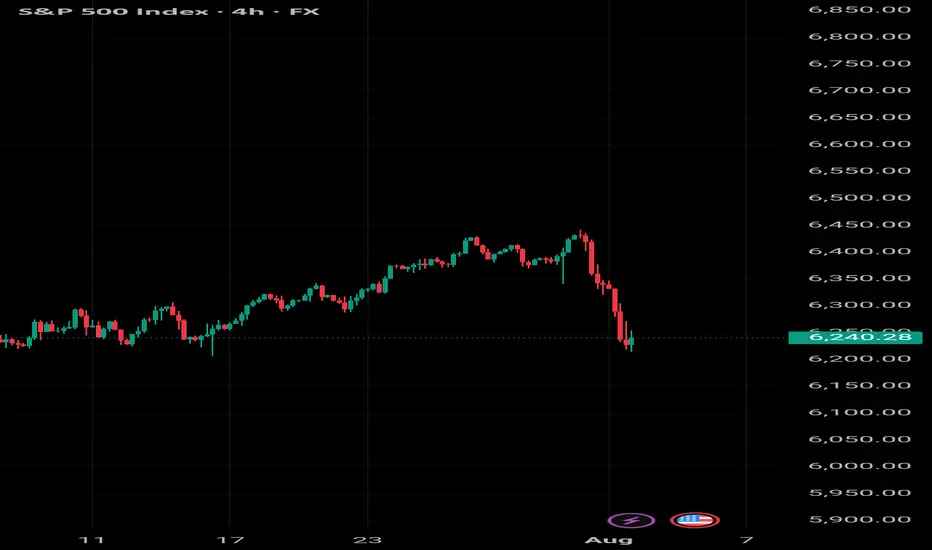
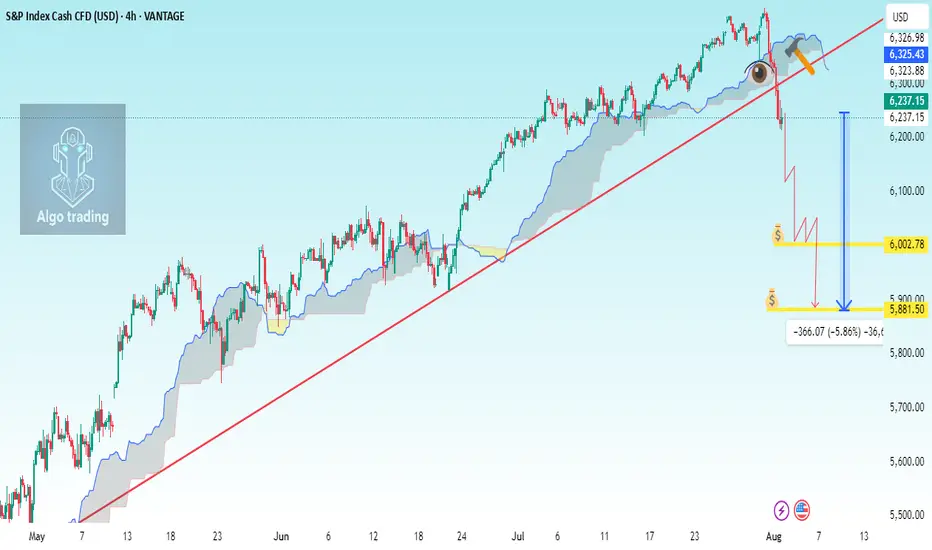
SP500 H4 analysis Breakdown TrendlineChart Components Observed:
Ichimoku Cloud: For trend and support/resistance visualization.
Uptrend line (manually drawn): Connecting higher lows since early May 2025.
Support break: Price has recently broken below the trendline and below the Ichimoku cloud.
Current Price: 6,237.15 (▼ -1.64%)
---
📉 Analysis Summary:
The trendline and Ichimoku cloud were acting as major dynamic support.
A bearish breakdown has occurred — price closed below the trendline and the cloud.
This suggests a potential trend reversal or correction underway.
---
🎯 Trade Setup Suggestion (Short Entry)
🟢 Entry Target (Short Position):
Sell Entry: Around 6,237 – 6,245 (current zone or slight pullback)
If price retests the underside of the broken trendline/cloud, that's a better entry confirmation.
📉 Take Profit Levels:
1. TP1: 6,130 (recent consolidation zone)
2. TP2: 6,000 (psychological + historical support)
3. TP3: 5,880 (next major support based on previous consolidation in early June)
🛡 Stop Loss:
SL: 6,300 – 6,310 (above the cloud and broken trendline for safe buffer)
---
📊 Risk Management:
Position size should be based on your account size, using 1–2% risk per trade.
Watch the S&P futures and macro news (e.g., U.S. data, Fed news) to avoid whipsaw.
DXY continued downside, next stop 90Perfect parallel channel + Fib 2.618 intersection
Gl
Not financial advice

US500 Pulls Back from 6,400– Correction or Trend Shift?The index has rejected the 6,400 🔼 resistance zone with a strong bearish candle, pulling back toward the 6,200 🔽 support region. Price is still trading within a bullish structure, but this drop may signal early signs of exhaustion.
Support Levels: 6,200 🔽, 6,100 🔽, 6,000 🔽
Resistance Levels: 6,300 🔼, 6,400 🔼
Bias:
🔼 Bullish: If price holds above 6,200 and reclaims 6,300, the uptrend remains intact and bulls may reattempt a push toward 6,400.
🔽 Bearish: A daily close below 6,200 could open a deeper retracement toward 6,100 or even 6,000.
📛 Disclaimer: This is not financial advice. Trade at your own risk.

US Dollar Index: Was Friday the Start of a Pullback Or Reversal?Welcome back to the Weekly Forex Forecast for the week of Aug 4 - 8th.
In this video, we will analyze the following FX market:
USD Index
The DXY had a strong week, but turned bearish Friday on weak jobs numbers. Was this just a retracement from the impulsive move up? Will price now find support for another bullish leg?
It all comes down to the +FVG, whether it holds or folds.
Look for price to continue down to discount prices early in the week... and then find it's footing on support.
Enjoy!
May profits be upon you.
Leave any questions or comments in the comment section.
I appreciate any feedback from my viewers!
Disclaimer:
I do not provide personal investment advice and I am not a qualified licensed investment advisor.
All information found here, including any ideas, opinions, views, predictions, forecasts, commentaries, suggestions, expressed or implied herein, are for informational, entertainment or educational purposes only and should not be construed as personal investment advice. While the information provided is believed to be accurate, it may include errors or inaccuracies.
I will not and cannot be held liable for any actions you take as a result of anything you read here.
Conduct your own due diligence, or consult a licensed financial advisor or broker before making any and all investment decisions. Any investments, trades, speculations, or decisions made on the basis of any information found on this channel, expressed or implied herein, are committed at your own risk, financial or otherwise.

Sunday Premarket AnalysisWe will likely hit the 4H FVG not too far above where price left off on Friday.
Then head all the way down take July's low and hit the area below that
because there is a BIG FAT juicy MONTHLY, WEEKLY && DAILY FVG
sitting directly under the July monthly low. We will likely hit all three or maybe just 2
of these FVG's and then head up for super big push, bullish into at least the first week of September. Keep in mind Jackson Hole Symposium is mid month-ish also.

China50 LongChina50 showing bullish potential! 📈
Could rise from 13.46k toward its target,
supported by the Crab pattern. 🚀
