DXY Dollar Index Review: The US Dollar flexes its muscles again.
Chart analysis suggests a medium-term uptrend in the dollar index, signaling growing strength in the U.S. dollar. The current price range between 96 and 97 has effectively prevented further declines and has acted as a strong support and demand zone.
For any further downward move to occur, the price would first need to retest and break this zone—but only after a temporary rise and corrective upward movement, which may take some time to unfold.
Further analysis points to price stabilization in the medium term, with a potential for a sideways to upward trend developing within the 97 to 110 range.
In this scenario, three potential price targets can be outlined:
First and most probable target: 100.30 – 101.70
Second, possible target: 103.20 – 104.30
Third and final target: 107.10 – 110.10
Current price: 98.31
Stop loss: Below 95.90
Market indices


Smallcap paradox 200WEMA and 40WEMA200WEMA - Two touches in a bear market after a simmering bullmarket once 40WEMA is breached. Buying point for Lumpsum bros.
40WEMA - Ride it to buy dips during a bull market. Dip buying point for BTD monkeys.

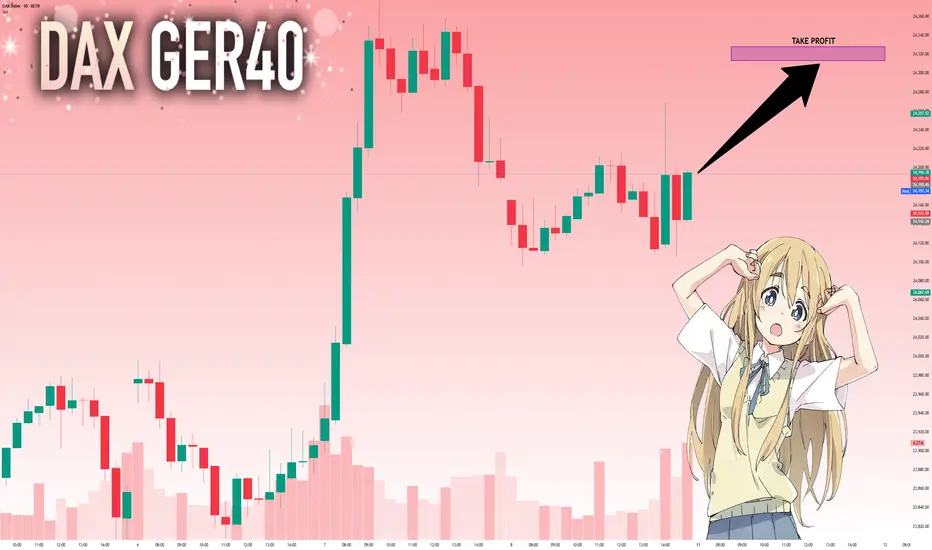
DAX: Next Move Is Up! Long!
My dear friends,
Today we will analyse DAX together☺️
The in-trend continuation seems likely as the current long-term trend appears to be strong, and price is holding above a key level of 24,194.78 So a bullish continuation seems plausible, targeting the next high. We should enter on confirmation, and place a stop-loss beyond the recent swing level.
❤️Sending you lots of Love and Hugs❤️
S&PS&P 500 waiting for overbought of 240 min. If it pass 6427 net resistance is about 6615. at this resistance there is a chance to drop 1 oversold of timeframe 240 min. however, it is on a long up trend, which the mid period target is 6952 (2-4 months). however, during this period it may go direcly to 6952 or down for 1 oversold of timeframe day or 240 min is OK. Note that the very importance supporting line,which should not be lower is at 4841. if it not fall below this point. S&P still on the uptrend.

US30 Bleeding.Greetings Family. I'm seeing a very clear selling opportunities on EIGHTCAP:US30 , so i brought the case to the attention of team TradingView community so that we can look into the situation together.

DXY Trend AnalysisTechnicals:
The DXY is sitting near its pivot, with technical momentum remaining mildly bearish, but oversold conditions suggest a potential for a bullish bounce. If the 97.55 support is broken decisively, further downside is likely. Upside is capped by resistance at 98.64; a break above this may confirm a short-term reversal to the upside.
Key Levels to Watch
Pivot Level: 98.12
Key Support: 97.55
Key Resistance: 98.64
Fundamentals:
- Persistent US twin deficits, reduced safe-haven flows, and a global trend of diversifying away from dollar assets all present headwinds.
- The spread between US yields and foreign peers is at historic highs, but with the Fed expected to ease and global growth forecasts improving, the dollar's advantage is eroding.
- Safe-haven demand could temporarily support the dollar in response to global shocks, but is not expected to reverse the broader downtrend this year.
Analysis by Terence Hove Senior Financial Markets Strategist at Exness

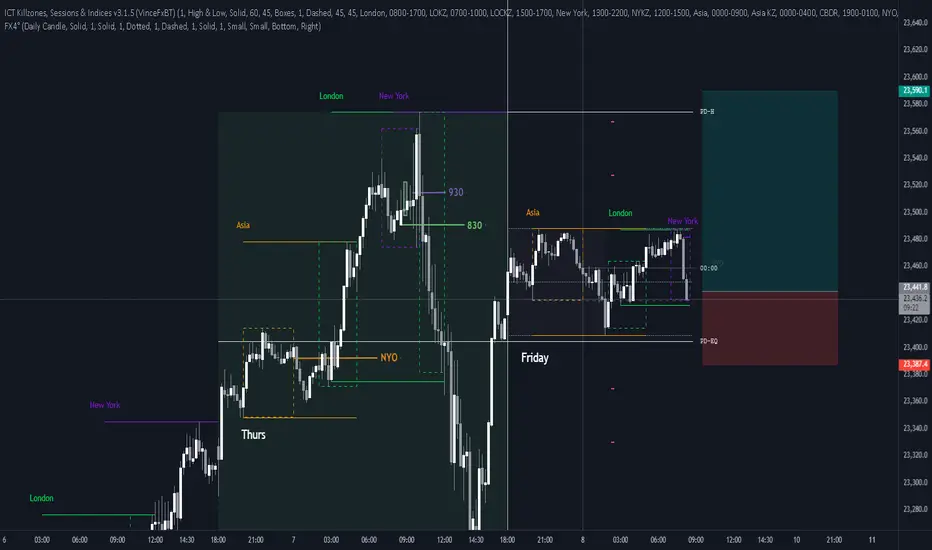
Long NQFriday so be ware
Asia and London left clean highs
We are on a down leg at OTE but it just looks to clean to sell
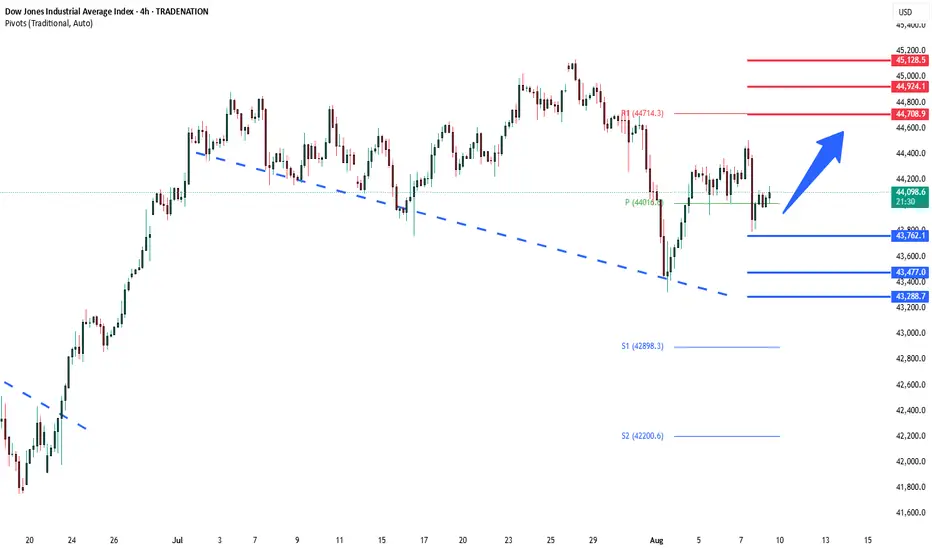
DowJones key trading levelsKey Support and Resistance Levels
Resistance Level 1: 44700
Resistance Level 2: 44924
Resistance Level 3: 45130
Support Level 1: 43760
Support Level 2: 43477
Support Level 3: 43288
This communication is for informational purposes only and should not be viewed as any form of recommendation as to a particular course of action or as investment advice. It is not intended as an offer or solicitation for the purchase or sale of any financial instrument or as an official confirmation of any transaction. Opinions, estimates and assumptions expressed herein are made as of the date of this communication and are subject to change without notice. This communication has been prepared based upon information, including market prices, data and other information, believed to be reliable; however, Trade Nation does not warrant its completeness or accuracy. All market prices and market data contained in or attached to this communication are indicative and subject to change without notice.
SPX500 at Key Pivot – Bearish Below 6365, Bullish AboveSPX500 – Market Overview
U.S. stock index futures rose on Friday after President Donald Trump’s temporary pick for a Federal Reserve governor boosted expectations for a more dovish central bank board.
Technical Outlook
Stability below 6365, we expect a move down toward 6341.
A 1H close below 6321 would likely extend the bearish trend toward 6301.
A 1H close above 6365 could trigger a push toward 6389.
A confirmed break above 6389 would shift the bias to bullish, targeting 6425 and 6453.
Pivot Line: 6365
Resistance: 6389 – 6425 – 6453
Support: 6341 – 6321 – 6301

USNAS100 Volatile – Key Level at 23440 in FocusUSNAS100 – Market Overview
The indices market remains highly volatile following the latest developments regarding the Federal Reserve Chairman.
The situation remains tense, with the possibility of one rate cut this year still on the table.
Technical Outlook
Bullish Scenario:
Stability above 23440 will keep bullish momentum intact, targeting the All-Time High (ATH) at 23690, with further potential toward 23870.
Bearish Scenario:
A 1H close below 23430 would shift the bias to bearish, targeting 23295, and possibly lower.
Resistance: 23570 – 23690 – 23870
Support: 23295 – 23180 – 23045

Trading update on NASDAQ 100
MEGA Cycle ended?
Greetings, traders!
The markets are at a critical juncture, and it's essential to prepare for what could be a significant correction in the NASDAQ 100 and, by extension, the broader stock market. Here's my analysis and outlook based on current price action, key levels, and technical indicators.
Potential for a 21% Decline in the NASDAQ 100
As I highlighted in the attached daily and weekly charts:
Elliott Wave Analysis:
The NASDAQ has completed its five-wave impulsive structure, signaling the potential end of a major bullish cycle. We are now in the midst of a corrective phase, which appears to be unfolding in the form of an ABC correction. This correction suggests that Wave C, the final leg down, is still in progress, with room for further downside.
Break of Structure (BOS):
A Break of Structure has occurred, confirming the bearish sentiment. Coupled with the presence of an unfilled gap overhead, it's clear that sellers are currently in control.
Key Fibonacci Levels:
The 0.618 Fibonacci retracement at 16,210 is a critical level to watch. A break below this support could open the door for a more extended drop to the 0.75 retracement at 13,200, representing a 21% decline from current levels.
Trendline at Risk:
The ascending trendline that has supported the NASDAQ since its 2022 lows is being tested. If this trendline breaks, it will likely trigger a cascade of selling pressure, accelerating the move to our projected downside targets.
Broader Market Implications
The NASDAQ often serves as a barometer for risk appetite in the financial markets. A sharp decline here could have ripple effects across other indices and sectors, particularly tech-heavy and growth-focused stocks. Watch for potential spillovers into the S&P 500 and Dow Jones Industrial Average, which could amplify market-wide volatility.
Key Levels to Watch
Resistance:
Gap area near 21,600–21,800.
This zone is likely to act as a supply area if the market attempts any retracement.
Support:
16,210 (0.618 retracement) – Initial target and a potential temporary bounce zone.
13,200 (0.75 retracement) – Ultimate target if bearish momentum persists.
Trading Strategy
For traders looking to capitalize on this potential move:
Short Positions:
Consider shorting retracements into resistance zones like the gap area or the 0.25 Fibonacci level.
Use 16,210 as a primary profit target, with a portion of the trade left to run toward 13,200 if bearish momentum accelerates.
Risk Management:
The markets remain volatile, so ensure you have clear stop-losses in place to protect against unexpected reversals.
Watch for Confirmations:
Monitor volume spikes, candlestick patterns (e.g., bearish engulfing), and breaks of key levels like the ascending trendline for additional entry confirmations.
Final Thoughts
The NASDAQ and broader markets are entering a critical phase. While the correction presents risks, it also provides opportunities for traders and investors who stay vigilant and disciplined.
Remember, patience and preparation are key to navigating volatile markets like these.
Stay sharp, stay informed, and trade smart.
Lord MEDZ

NAS100 – Eyeing 23,700.0 ResistanceNAS100 continues its bullish momentum, breaking above the 23,480.0 zone after a strong rally. Price is now approaching the 23,700.0 resistance, with short-term support building near 23,480.0. A retest of support before another push higher remains likely.
Support at: 23,480.0 🔽 | 23,280.0 | 22,960.0 | 22,720.0
Resistance at: 23,700.0 🔼 | 23,850.0
🔎 Bias:
🔼 Bullish: Holding above 23,480.0 and breaking 23,700.0 could extend gains toward 23,850.0.
🔽 Bearish: Failure to hold 23,480.0 may lead to a deeper pullback toward 23,280.0.
📛 Disclaimer: This is not financial advice. Trade at your own risk.

US30US30 needs some more correction downside short term before going up to take ATH.
Disclosure: We are part of Trade Nation's Influencer program and receive a monthly fee for using their TradingView charts in our analysis.

import pandas as pd # Suppose df is a DataFrame with columns ['import pandas as pd
# Suppose df is a DataFrame with columns
# It contains daily Monday-Thursday data for each week
# Example: df = pd.read_csv('nifty_weekly_data.csv', parse_dates= )
def backtest_fixed_range_iron_condor(df, spread=100, range_points=550, lot_size=50):
results =
idx = 0
while idx + 3 < len(df): # Ensure 4 days available for a week
monday = df.iloc
thursday = df.iloc
spot = monday
expiry_spot = thursday
# Determine short and long strikes (rounded to nearest 50)
short_put = int((spot - range_points) // 50) * 50
long_put = short_put - spread
short_call = int((spot + range_points) // 50) * 50
long_call = short_call + spread
# --- Placeholders for option premium ---
# In a real-world scenario, you would fetch the following four prices from actual data!
# For illustration, let's set a net credit for the condor:
net_credit = 50 * lot_size # Example: Rs.50 per lot total net credit received
# Calculate max possible loss per spread:
max_loss = ((spread * lot_size) - net_credit)
# Calculate P&L at expiry:
pnl = net_credit
# If expiry spot below short put
if expiry_spot <= short_put:
pnl -= ((short_put - expiry_spot) * lot_size) - max(0, (long_put - expiry_spot) * lot_size)
# If expiry spot above short call
elif expiry_spot >= short_call:
pnl -= ((expiry_spot - short_call) * lot_size) - max(0, (expiry_spot - long_call) * lot_size)
# If expiry spot between short strikes
else:
pnl = net_credit # keep the entire premium
results.append({
'EntryDate': monday ,
'Monday_Spot': spot,
'Thursday_Spot': expiry_spot,
'ShortPut': short_put,
'LongPut': long_put,
'ShortCall': short_call,
'LongCall': long_call,
'NetCredit': net_credit,
'PNL': pnl
})
# Move to next week
idx += 4
return pd.DataFrame(results)
# Example usage:
# df = pd.read_csv('nifty_weekly_data.csv', parse_dates= )
# result_df = backtest_fixed_range_iron_condor(df)
# print(result_df)
# print('Total P&L:', result_df .sum())

DXYDXY looks like we are getting some momentum to the upside short term impulsively or correctively.
Disclosure: We are part of Trade Nation's Influencer program and receive a monthly fee for using their TradingView charts in our analysis.

NIFTY -1H RSI Whispers, Market ListensPrice swept the sell-side liquidity before showing a bullish divergence on RSI.
A break above the descending trendline could trigger a rapid move toward the buy-side liquidity.
Setup suggests a classic trap-and-reversal scenario favoring the bulls.

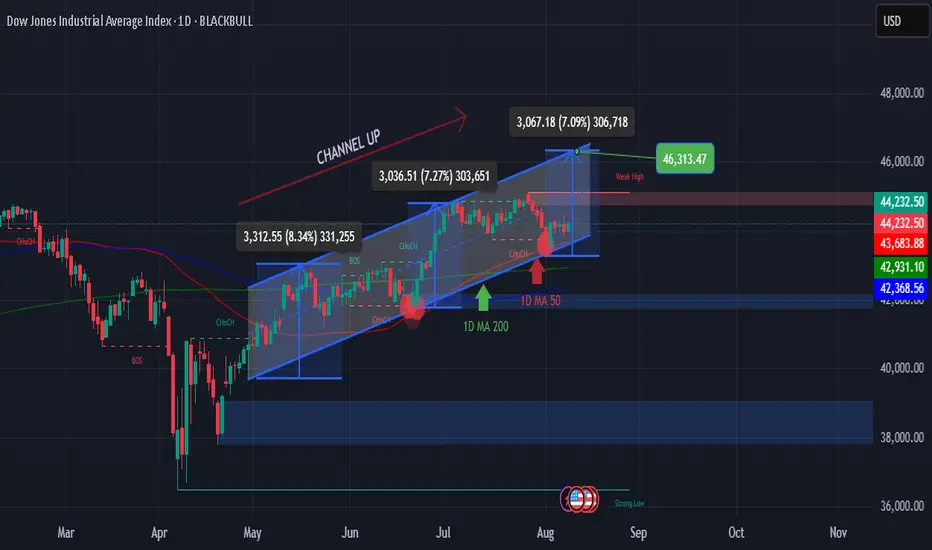
DOW JONES - STRONG SUPPORT BOUNCE INSIDE CHANNEL UP
The Dow Jones (DJI) has been moving inside a Channel Up since the April 25 low. Right now, price is consolidating after touching and bouncing from the 1D MA50 (blue line), which also aligns with the bottom of the Channel.
This area forms a Higher Low, which is one of the strongest technical supports.
The 1D RSI is also bouncing from the same level as the last Higher Low, increasing the chance of another bullish wave inside the Channel.
In the last two bullish legs, price gained at least +7%. Based on that, our short-term target is 46,350.
🟢 KAIZO US30 REPORT
🎯 Setup: BUY 📈
🔹 Entry: 44,000 – 44,200
🛑 Stop Loss: 42,930
✅ Take Profit: 46,313
📶 Confidence: High (85%)
💬 “Strong support means strong opportunities.”
#DJI #DowJones #StockMarket #ChannelUp #Kaizo
NIFTY50.....Miss a final sell-off! Part III!Hello Traders,
the NIFTY50 declined this week about ~370 points. That was inline with my expectations, and it also touched the sky-blue rectangle, to see at the chart! At the past two weeks, a loss of nearly 640 points!
Whether there will be a "final sell-off" at the start of a longer lasting correction or a crash?
Last week price have hit my target range, marked with the sky-blue rectangle @24363 points. I expect price to go lower in the coming trading week.
Chart analysis!
I have checked the pattern, and I am still waiting for the final sell-off! This kind of correction often ends in an "exhausting gap down" and it recovers imminently! After, if so to come, the next move should bring N50 to new ATH`s in the coming week, probably for the rest of the year!
An alternate scenario is that this pattern is a huge w-x-y correction and a wave "b" has ended @25669 on Monday 30th! In this case, the next move is a huge wave down with an a-b-c to new lows below the wave z @21743 on April 7th!
Note, that it can morph into a "running or expanding-flat" in the coming weeks!
It is too early to judge and call out a target. I depend on the internal structure of the pattern and how it develops.
Above 22540, the targets are at 28905.
We'll see how the market will makes its decision!
Have a great week.....
Ruebennase
Please ask or comment as appropriate.
Trade on this analysis at your own risk.

NASDAQNasdaq climbed all the way close to new highs, unable to break the ath before closure over the weekend. Expect to see a wick out and then a massive fall (following DAX). When market opens its short time. Check out this amazing auto supply and demand indicator, get a month free if u dm me the word free.

JXY (YEN INDEX)
Touch major support and rejected showing bullish momentum on JPY.
Expect all JPY PAIRS to Drop for remainder of year.

Weekly Market Outlook – Nifty & S&P 500 AnalysisNifty closed the week at 24,363, down 200 points from the previous week’s close, after making a high of 24,736 and a low of 24,337. As highlighted last week, Nifty traded exactly within my projected range of 25,000–24,100, but the negative takeaway is that it has now closed below the crucial support of 24,400.
If Nifty sustains below 24,300 next week, there is a strong probability of it testing 24,000/23,900 support levels. My outlook for the coming week: expect movement within 24,800–23,900, with a potential bounce from 24,000/23,900.
Interestingly, this marks the 6th consecutive week of Nifty closing lower — something that last happened 12 years ago in August 2013. Historically, after five straight weeks of selling, we usually see at least one green candle. If that bounce comes next week, my focus will be on whether selling resumes afterward or finally takes a breather.
Remember the timeless stock market wisdom:
“When everyone is fearful, be greedy. When everyone is greedy, be fearful.”
For long-term investors waiting for a dip, the opportunity is here — consider accumulating fundamentally strong companies for the long haul. Traders, brace for volatility.
S&P 500 Outlook:
The S&P 500 closed 150 points higher than last week, validating my prediction of holding 6,200. On the weekly chart, the index is showing signs of forming an M-pattern — a bearish setup. To negate this, the S&P 500 must sustain above 6,400, which could extend its rally towards 6,454/6,500 and the key Fibonacci level of 6,568.
However, if it fails to hold 6,400, we could see a retest of 6,225. Investors in U.S. markets should trail their stop-losses to protect gains.
Key Levels to Watch Next Week:
Nifty: Support – 24,000/23,900 | Resistance – 24,800
S&P 500: Support – 6,225 | Resistance – 6,454/6,500/6,568

To 95 and up
The previous idea has been fully implemented. I expect a slight decrease to 95 and then only upward.
