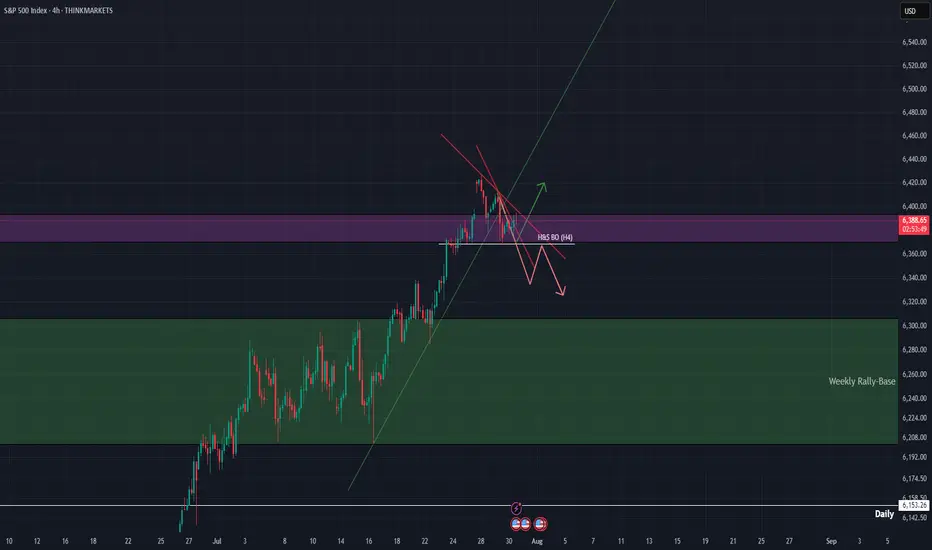
SPY back in the trendlineFrom a technical stand point, the expectation was that the trend line will be respected and sellers will force price to close back inside.
Today's daily close can ignite further downward movement which can align with August seasonality that typically sees Indices pull back within this period.
Target still remains 6108 at previous ATH
Market indices

NAS - LONGWaiting to see how news affects the markets today. IF we hold this area and we get confirmation that buyers are taking over. I will enter long and target previous highs.
USD Dollar Index (DXY): Pushing Higher As Forecast!Welcome back to the Weekly Forex Forecast for the week of July 30 - Aug1
In this video, we will analyze the following FX market:
USD Index
In my last USD video, the forecast was for higher prices. Check the related links below to see that video forecast. It played out exactly as analyzed. The +FVG was used to push for higher prices. The FOMC decision to keep the rate unchanged only pushed it further along.
Enjoy!
May profits be upon you.
Leave any questions or comments in the comment section.
I appreciate any feedback from my viewers!
Like and/or subscribe if you want more accurate analysis.
Thank you so much!
Disclaimer:
I do not provide personal investment advice and I am not a qualified licensed investment advisor.
All information found here, including any ideas, opinions, views, predictions, forecasts, commentaries, suggestions, expressed or implied herein, are for informational, entertainment or educational purposes only and should not be construed as personal investment advice. While the information provided is believed to be accurate, it may include errors or inaccuracies.
I will not and cannot be held liable for any actions you take as a result of anything you read here.
Conduct your own due diligence, or consult a licensed financial advisor or broker before making any and all investment decisions. Any investments, trades, speculations, or decisions made on the basis of any information found on this channel, expressed or implied herein, are committed at your own risk, financial or otherwise.

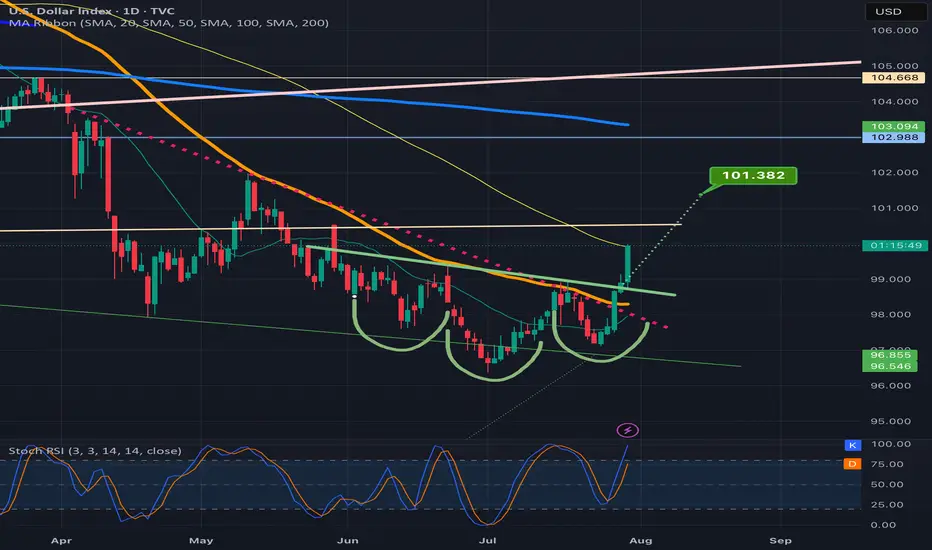
DXY attempting an inverse H&S breakoutSeeing a big green candle today on dxy after confirming the neckline of the inverse head and shoulders pattern as support on the previous daily candle.
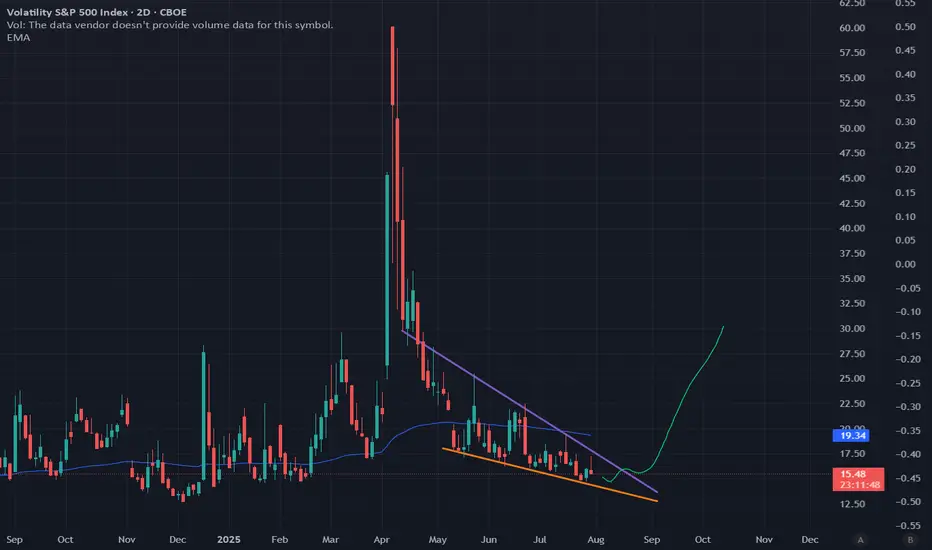
Unprecedented VOL suppression will lead to VIX October explosionAccording to my discussions with ChatGPT and analyzing various metrics we are currently in one of the longest periods, if not *the longest* period, of Vol suppression in the entire history of volatility.
Zooming out and looking at the current chart pattern VIX is very clearly in a falling wedge, which means its falling days are numbered.
Once you see a daily close breach of the upper boundary of the upper wedge channel, I would consider buying some VIX 30 calls for Oct 22 expiration.
Once VIX pierces 25, take profit and close the option.
Good luck and happy trading!
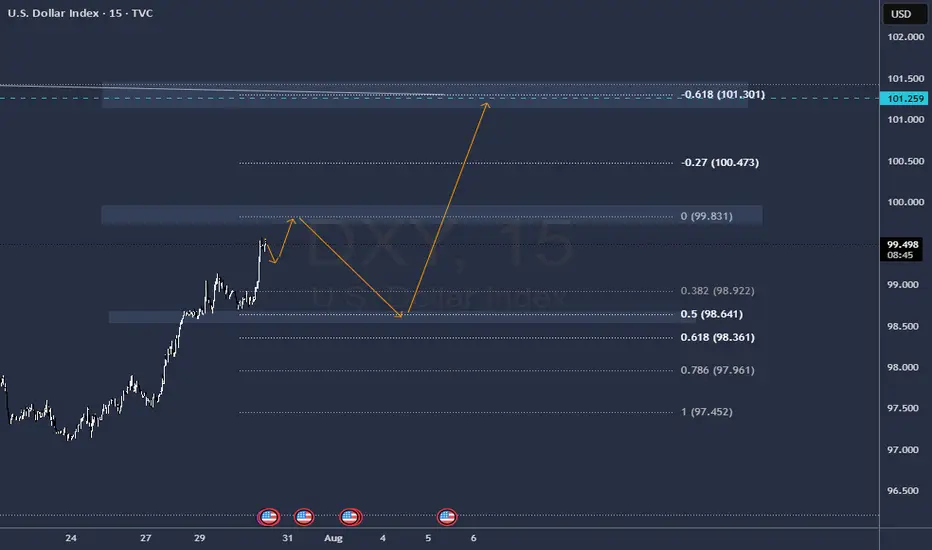
DXY with interest rates With interest rates remaining steady, the U.S. Dollar is currently moving in a bullish direction.
As shown in the chart, it seems likely that price will break the previous high and form a bullish Quasimodo (QM) pattern. The price may then reach the 50% Fibonacci level.
After that, we should wait and observe the market's reaction.
If price gets rejected from the 103 zone — especially if accompanied by a rate cut or bearish price action — we could see a sharp decline toward the 95 area.
This 95 zone also aligns with a key weekly Fibonacci support level on the Dollar Index.
As long as the Federal Reserve maintains its hawkish stance, the U.S. Dollar may continue its upward momentum. However, the 103–104 zone — which aligns with the 50% Fibonacci retracement and a significant supply area — could serve as a strong resistance.
If price gets rejected from this area and we simultaneously see signs of a rate cut or weakening U.S. economic data, a trend reversal and corrective phase could begin. In that case, lower targets around 95 or even 93 could become likely in the medium term.
good luck

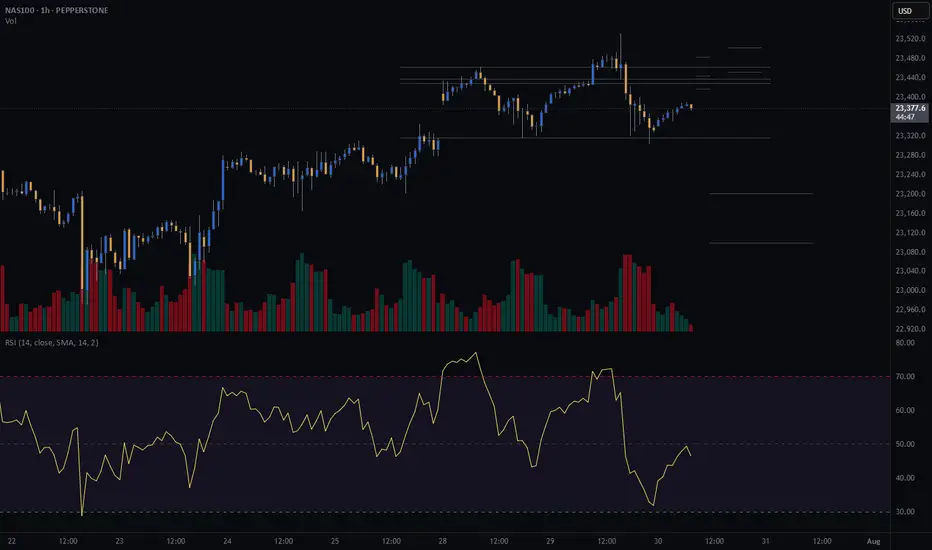
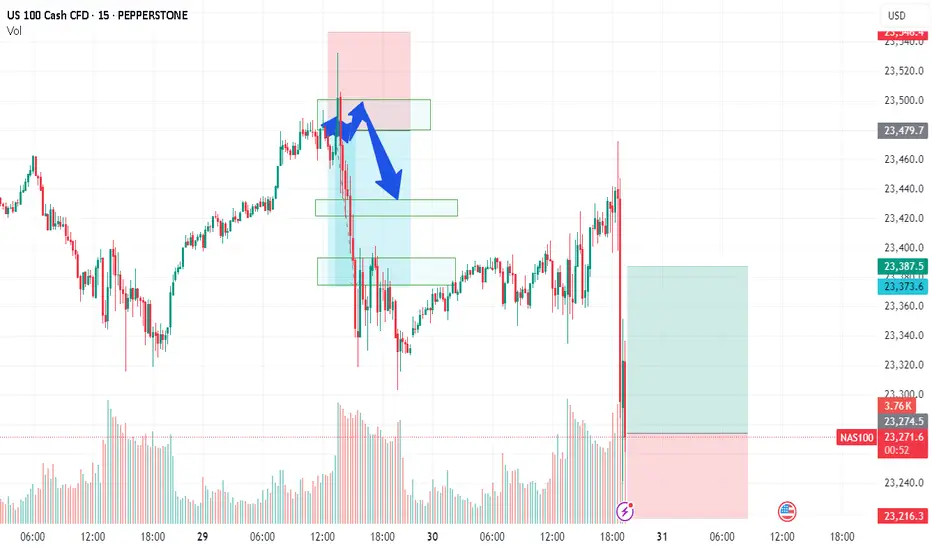
CASH100 (NASDAQ) CRASH - Head and shoulders Risk/reward = 3.7
Entry price = 23 430
Stop loss price = 23 503.2
Take profit level 1 (50%) = 23 202
Take profit level 2 (50%) = 23 099
Still waiting for some variables to confirm before entering the trade
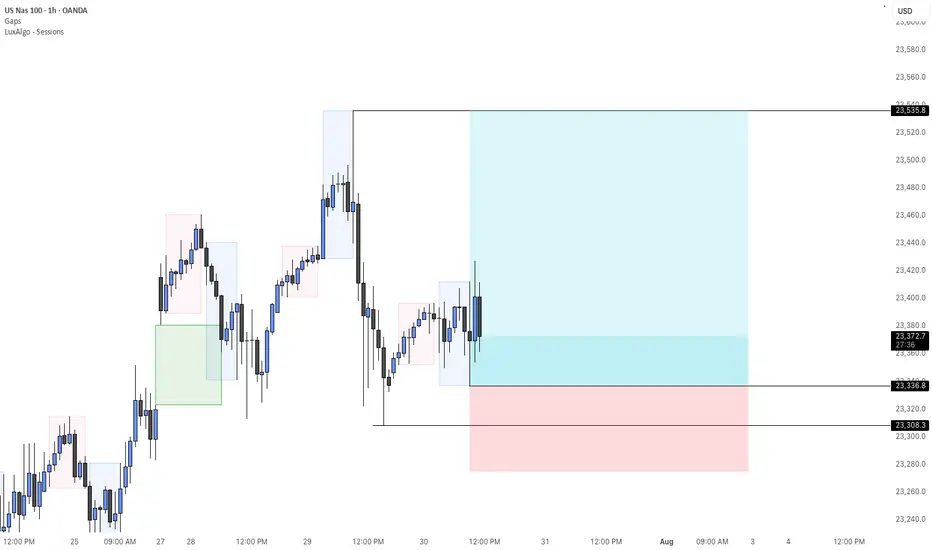
NAS100 - EXPECTING THE DUMPTeam, we got short well today with AUS200 - both target hit
we have set up the NAS entry , this is the entry price 23268 - 23200
STOP LOSS at 23100
Once it break above 23320 - bring stop loss to BE
Target 1 at 23320-60 - take 50%-70& partial
Target 2 at 23380-23400
LETS GO
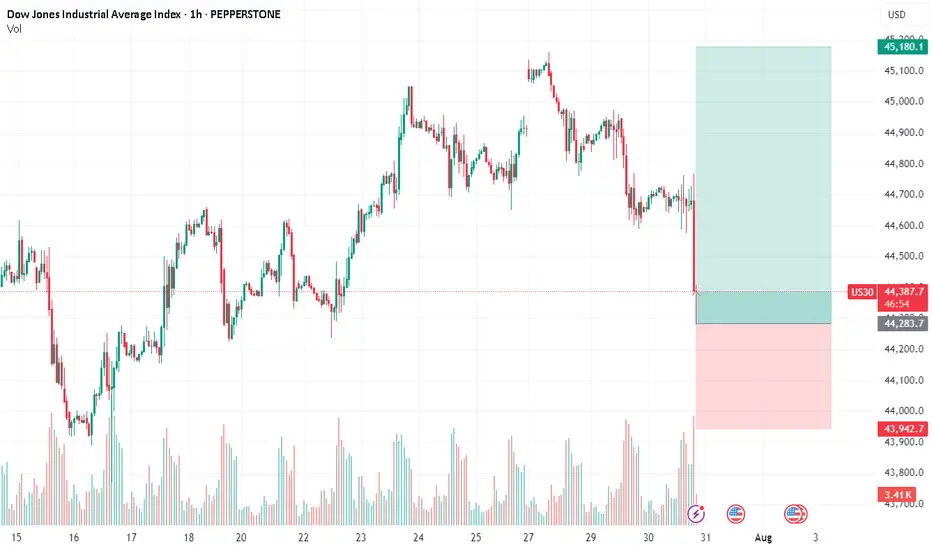
DOW/US30 - PATIENCE IS THE KEYTeam, i expect the DOW/ NAS will be selling off due RATE unchange
i am going LONG now at 44335-44300 ranges
STOP LOSS at 44195
Target 1 at 44500-44550
Target 2 at 44600-44630
LETS GO
By the way, if you trade AUS200 today, both target hit on SHORT.
SPX500 Bearish Bias!
HI,Traders !
#SPX500 broke both the
Rising and horizontal
Support line which are
Now resistance areas
And the breakout is
Confirmed so we are
Bearish biased and we
Will be expecting a
Further bearish move down !
Comment and subscribe to help us grow !

DXY Bulls Ready — Can Powell Spark the Rally?📊 DXY Pre-FOMC Outlook
In my previous analysis released on Monday, I expected the Dollar Index to fill the gap around the 98.60 zone and range below the key red line at 99.429.
Now, with less than 8 hours left until the highly anticipated FOMC rate decision, it’s time to take a closer look at tonight’s event and what it could mean for the markets.
From a purely technical perspective — setting the news aside — the Dollar Index looks ready to break through the crucial 100 level and kick off a strong bullish rally.
However, recent political pressure from Trump urging rate cuts, along with visible tension between him and Fed Chair Jerome Powell, has created uncertainty. If it weren’t for these conflicting signals, I would’ve confidently expected a clean breakout above 100.
As much as I enjoy trading news-driven events, I’ll likely stay out of the market tonight and observe from the sidelines. The setup is tempting, but the dual narratives make it risky.
That said — if you ask for my final take — I believe the stage is fully set for a bullish dollar and a corresponding drop in gold, EUR, GBP, and other major assets.
Let’s see how it plays out. 👀💥

DXY BEARISH TREND 30-JUL 15-JUN 2025There are some major upcoming events that could significantly impact the US dollar index (DXY), including the ADP Non-Farm Employment Change and the Federal Funds Rate decision. Because of this, I expect the DXY to continue its downward movement until it reaches around 94.5. If it breaks below that level, it’s also possible that it could drop further and reach 89.00.
Currently, the DXY is expected to start its move downward from the 99.20–99.50 range, making a decline from that level quite likely

US30 Sell analysis/ideathis trade is based on the 4-hour timeframe and executed using reversal trading and trend formation. Complete explanation in the video!

DXY still in downward channel. Rejection here = BTC rally The DXY is still in a downward sloping channel and trying to break back above the previous 2-year cycle low, but I think will reject here and kick off the next leg of the BTC rally.
Ideally we get a big DXY drop and ultimately break below the 95% level and on down into 'Bitcoin Super Rally Zone'🚀

US100/NQ short idea PM session I expect yesterdays high to hold. For NQ reaching a discount, a 400 point move can happen. WATCH A 5m FVG formation for entry

SPX500 AnalysisThis analysis is based on the 4-hour timeframe, reversal trading, and trend formation. I've posted a video explaining what I think is probable to happen and why.
Data Release - Interest Rate DecisionJul 30 2025: Interest Rate Decision (4.5%)
Rates remain unchanged as expected.
OANDA:XAUUSD remains bearish with the help of GDP data.
TVC:DXY remains bullish with the help of GDP data. No major changes in either pairs.
Volatility is increased.
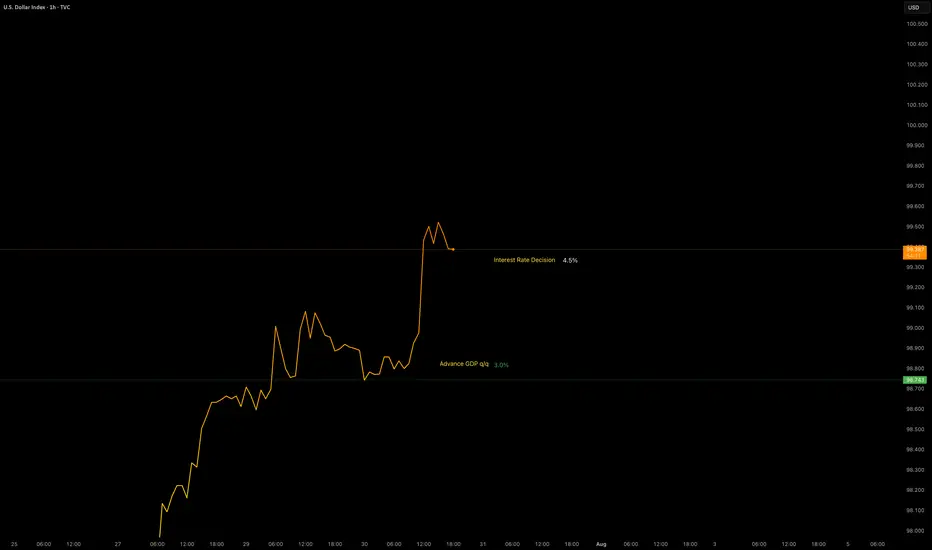
DOLLAR INDEX DXYThe latest U.S. economic data released on July 30, 2025 shows:
ADP Non-Farm Employment Change: Actual increase of 104,000 jobs, significantly above the forecast of 77,000. This marks a strong rebound from the previous decline of -23,000 in June and indicates solid labor market momentum, particularly in services sectors like leisure/hospitality, financial activities, and trade/transportation. However, education and health services saw job losses. Wage growth remains steady at 4.4% year-over-year for job-stayers.
Advance GDP q/q Growth: Actual growth came in at 3.0%, beating the forecast of 2.5% and improving sharply from -0.5% previously. This suggests that the economy is expanding robustly in the second quarter
Advance GDP Price Index q/q (Inflation measure): Actual was 2.0%, slightly below the forecast of 2.2%, and down from 3.8% previously, indicating easing inflation pressures .
Interpretation of this data for Federal Reserve policy:
The stronger-than-expected job growth and GDP expansion signal a resilient economy, which may reduce the immediate likelihood of Fed rate cuts, as these indicators support sustained economic momentum.
The slightly softer inflation reading on the GDP Price Index suggests inflation pressures are continuing to moderate, which could offer some flexibility to the Fed.
Overall, the Fed is likely to view this data mix as supportive of a cautious, data-dependent approach, possibly maintaining current rates in the short term without rushing to cut, but monitoring to ensure inflation stays on a downward path.
If the Fed prioritizes strong growth and a resilient labor market, rate hikes or holds are more likely than cuts. If inflation remains subdued, it could permit a gradual easing down the line but probably not immediately.
Let me know if you want a detailed outlook on market reactions to this release or the potential Fed communication following today’s data.
#GOLD

29-07-2025This chart contains my analysis and key observations for today's trading session. All drawings and indicators reflect my current view of the market as of today. The purpose of this publication is to keep a record of my analysis and review it later for learning and improvement. No investment advice is provided.

Nasdaq Long 7.17.25At 9 AM, price bounced off of the PD high which signified that price wanted to distribute above the current week high, old day high. I entered at 10 AM off the 9 AM candle. Awesome trade and execution.

US500 (S&P): Trend in daily time frameThe color levels are very accurate levels of support and resistance in different time frames, and we have to wait for their reaction in these areas.
So, Please pay special attention to the very accurate trends, colored levels,
and you must know that SETUP is very sensitive.
Be careful
BEST
MT

NASDAQ Long 7.28.25I saw that price had hit the PD high and took the PD low (sunday) then closed at 9 AM as a bullish hammer. At 10 AM, I entered long at the 9 AM wick equilibrium. The trade hit the 75% BE and Final TP with a 1:1 RR.
