US NAS 100DO YOU KNOW WHATS BEHIND THIS OR OTHER IDEAS?? in bio..
Preferably suitable for scalping and accurate as long as you watch carefully the price action with the drawn areas.
With your likes and comments, you give me enough energy to provide the best analysis on an ongoing basis.
And if you needed any analysis that was not on the page, you can ask me with a comment or a personal message.
Enjoy Trading ;)
Market indices

12th Dec Nifty Analysis Clean Price Action Breakdown Here’s my full market analysis for 12th December.
I’ve broken the chart down with trend lines, horizontal levels, and clean market structure, keeping everything in simple language.
No indicators just pure price action and a top-down view of what the market can do from here.
This video is meant to help you think clearly, avoid noise and understand why the market might move in a certain direction.
Nothing fancy, nothing complicated just logic and structure.
Let me know what you think.

Nqz & nas100Price has a potential of slamming lower. Overall it will be good to see price pushing higher tapping into premium arrays and eventually go lower from next week. I will keep an eye on the previous daily high

S&P500 Key Trading Levels
Key Support and Resistance Levels
Resistance Level 1: 6898
Resistance Level 2: 6922
Resistance Level 3: 6958
Support Level 1: 6809
Support Level 2: 6790
Support Level 3: 6768
This communication is for informational purposes only and should not be viewed as any form of recommendation as to a particular course of action or as investment advice. It is not intended as an offer or solicitation for the purchase or sale of any financial instrument or as an official confirmation of any transaction. Opinions, estimates and assumptions expressed herein are made as of the date of this communication and are subject to change without notice. This communication has been prepared based upon information, including market prices, data and other information, believed to be reliable; however, Trade Nation does not warrant its completeness or accuracy. All market prices and market data contained in or attached to this communication are indicative and subject to change without notice.

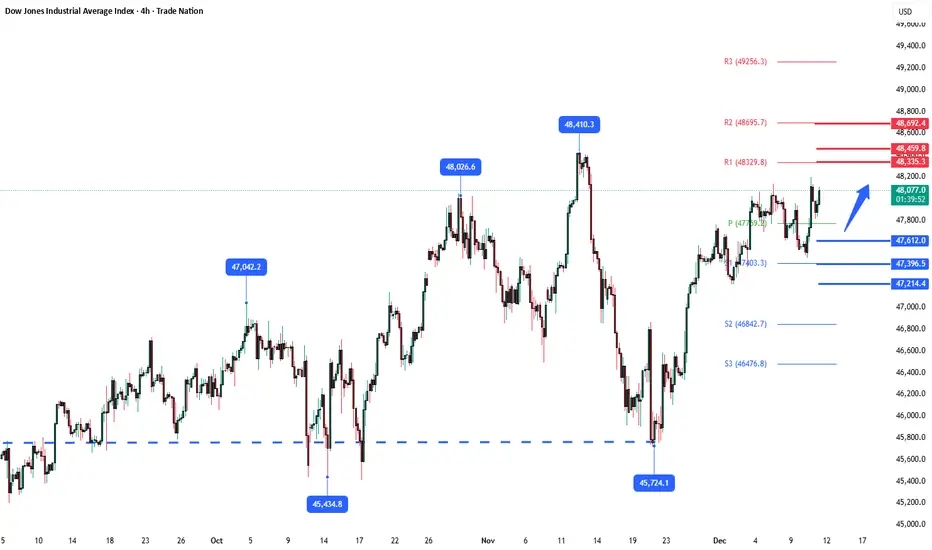
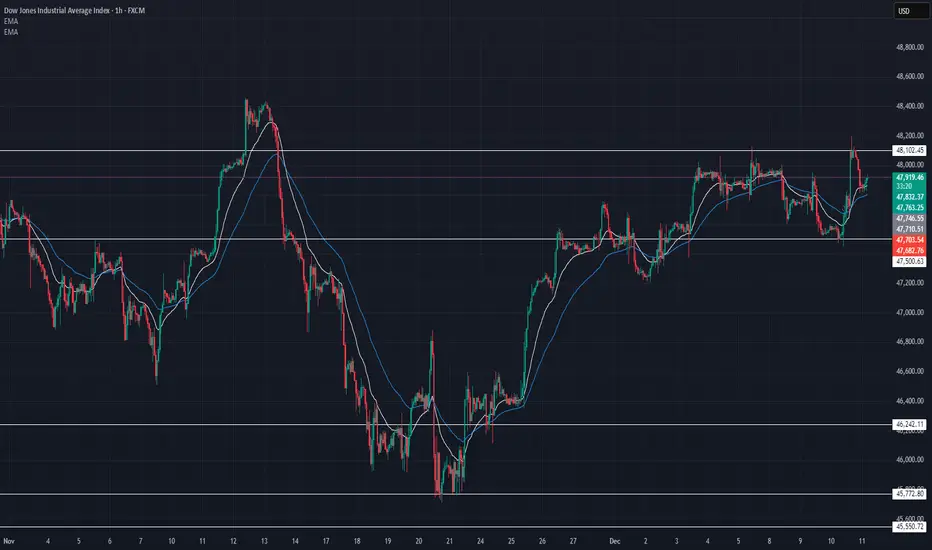
DpwJones Key Trading LevelsKey Support and Resistance Levels
Resistance Level 1: 48335
Resistance Level 2: 48460
Resistance Level 3: 48690
Support Level 1: 47610
Support Level 2: 47390
Support Level 3: 47210
This communication is for informational purposes only and should not be viewed as any form of recommendation as to a particular course of action or as investment advice. It is not intended as an offer or solicitation for the purchase or sale of any financial instrument or as an official confirmation of any transaction. Opinions, estimates and assumptions expressed herein are made as of the date of this communication and are subject to change without notice. This communication has been prepared based upon information, including market prices, data and other information, believed to be reliable; however, Trade Nation does not warrant its completeness or accuracy. All market prices and market data contained in or attached to this communication are indicative and subject to change without notice.
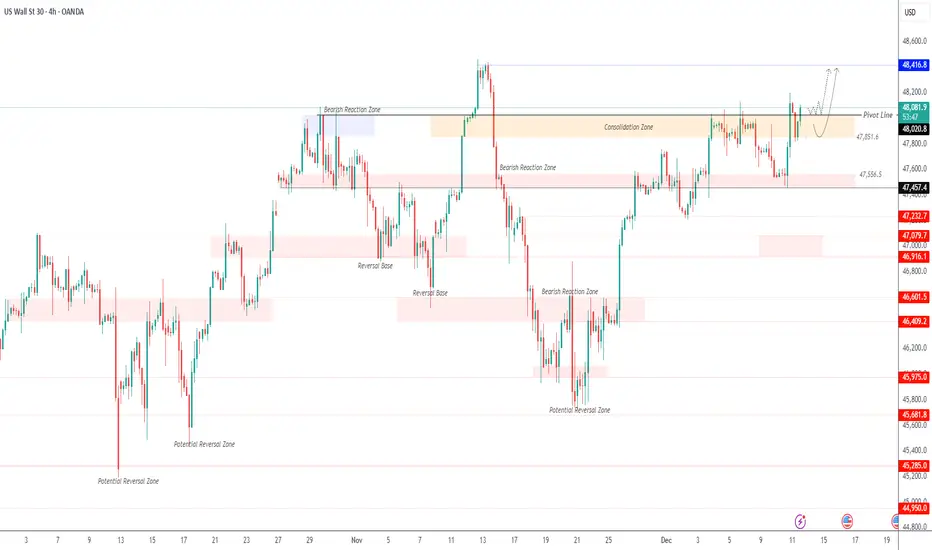
US30 Testing the Pivot Before Next MoveUS30 – Technical Overview
The Dow Jones (US30) gained 1.1% after the Fed’s rate cut, pushing the index within 200 points of a new all-time high. Futures later turned slightly positive, with US30 outperforming Nasdaq and S&P 500 despite weakness in tech.
US30 is attempting to stabilize above the 48020 pivot line. A breakout above this level on a 4H close would support a move toward the previous all-time high at 48415.
A correction remains possible toward the pivot or slightly below it, with 47850 acting as a key pullback level before any renewed bullish momentum.
A 4H break below 47850 would confirm bearish pressure toward 47560 and 47460.
Pivot: 48020
Resistance: 48415 · 48690
Support: 47850 · 47560 · 47460
Nikkei 225 Is Coiling UpAfter a strong uptrend, price is consolidating inside a symmetrical triangle, a pattern that often precedes a continuation move.
Bullish Scenario
If price breaks above 51,500:
• Target 1: 52,800
• Target 2: 54,500
• Target 3: 56,000
• Stop-loss: Below 50,900
Bearish Scenario
If price breaks below 49,600:
• Target 1: 47,800
• Target 2: 45,500
• Target 3: 43,500
• Stop-loss: Above 50,200
Short Fundamental Overview
• Weak Japanese yen supports export-heavy companies.
• BOJ’s accommodative stance remains supportive.
• Yet, price is near major historical resistances.


Dollar Index at Critical Support — Is a Big USD Rally Coming?Today I want to analyze the DXY index( TVC:DXY ) for you, which is one of the key indices in the financial markets.
At the moment, the DXY index is moving near a support zone($98.85-$98.50), Monthly Support (1) level, and the 21_SMA(Weekly).
In addition, the DXY has been trending inside a descending channel for roughly the past 13 trading days.
The main question is whether the DXY can break below this confluence of support levels or not.
Looking at the 4-hour chart, we can identify a Morning Star candlestick reversal pattern, and there is also a clear bullish Regular Divergence (RD+) between the last two lows.
Moreover, the US 10-Year Government Bond Yield ( TVC:US10 ) appears bullish in my view — and its upward movement can potentially support a rise in the DXY as well.
From my perspective, the best currency pairs to capitalize on a stronger USD are USDJPY( FX:USDJPY ) and EURUSD( FX:EURUSD ).
We should also keep in mind that several important US economic indicators will be released this week, which could significantly impact market direction. So be extra cautious with your positions, especially during data releases:
JOLTS Job Openings➡️09 December
Federal Funds Rate➡️10 December
FOMC Statement➡️10 December
FOMC Press Conference➡️10 December
Unemployment Claims➡️11 December
I expect that once the DXY breaks above the upper line of the descending channel, it could at least move toward one of the higher Fibonacci levels.
Do you think the U.S. interest rate will be cut this week?
💡 Please respect each other's opinions and express agreement or disagreement politely.
📌U.S. Dollar index Analysis (DXYUSD), 4-hour time frame.
🛑 Always set a Stop Loss(SL) for every position you open.
✅ This is just my idea; I’d love to see your thoughts too!
🔥 If you find it helpful, please BOOST this post and share it with your friends.

S&P 500 Breakdown Alert — Rising Wedge Reversal in Play!Today I want to share an S&P 500 index( SP:SPX ) analysis, as this index plays a major role in guiding correlated markets—especially crypto, and particularly Bitcoin( BINANCE:BTCUSDT ).
The S&P 500 index entered the Potential Reversal Zone(PRZ) and resistance zone($6,902_$6,875), where it began to fall.
The S&P 500 index also failed to form new Higher Highs(HH) and Higher Lows(HL), which signals weakening bullish momentum over the past 7 trading sessions.
From a classical technical-analysis perspective, it appears that the S&P 500 index has broken below the lower line of its rising wedge pattern, which is considered a bearish reversal pattern. The index is currently in the process of completing a pullback/retest of the broken structure.
My expectation is that the S&P 500 index may decline at least toward $6,823, and if important support lines break, we could see a deeper correction toward the measured move (target) of the rising-wedge pattern.
What’s your outlook on the S&P 500 index and the U.S. stock market?
First Target: $6,823
Second Target: $6,803
Stop Los(SL): $6,889(Worst)
------------------------------------------------
We should also keep in mind that several important US economic indicators will be released this week, which could significantly impact market direction. So be extra cautious with your positions, especially during data releases:
JOLTS Job Openings➡️09 December
Federal Funds Rate➡️10 December
FOMC Statement➡️10 December
FOMC Press Conference➡️10 December
Unemployment Claims➡️11 December
------------------------------------------------
💡 Please respect each other's opinions and express agreement or disagreement politely.
📌S&P 500 Index Analyze (SPX500USD), 1-hour time frame.
🛑 Always set a Stop Loss(SL) for every position you open.
✅ This is just my idea; I’d love to see your thoughts too!
🔥 If you find it helpful, please BOOST this post and share it with your friends.

USNAS100 | Correction Toward 25835 Before Bearish ContinuationUSNAS100 – Technical Overview
USNAS100 is expected to make a corrective move toward 25710–25835, where the market may find short-term resistance before resuming the broader bearish trend.
A continuation of downside momentum requires a confirmed break of key support.
Technical Analysis
The index is likely to retrace upward toward 25710 and 25835.
This zone is expected to act as a reaction area before sellers regain control.
A 1H close below 25430 will confirm bearish continuation, targeting:
→ 25430
→ 25210
If the price breaks above 25835, the structure shifts bullish, opening the path toward 25985 and higher upside potential.
Pivot Line: 25700
Support: 25430 · 25210
Resistance: 25830 · 25985

SPX500 | Bulls Push Higher but Key Reversal Zone NearsSPX500 – Technical Overview
The broad market index is approaching another record high, supported by a surprisingly market-friendly message from the Federal Reserve.
Powell’s acknowledgment of “significant downside risks” in the labor market immediately signaled to traders that additional rate cuts remain possible.
Although the rate cut itself was expected, the tone was less hawkish than feared, giving bulls confidence heading into year-end.
The 9–3 split vote also revealed internal disagreement within the Fed—two members preferred no cut, while one favored an aggressive 50 bps reduction—adding uncertainty to future policy direction.
Technical Analysis
SPX500 currently shows bullish momentum, with price expected to move toward 6873 and 6888.
However, this zone is likely to act as a reversal area, and a bearish reaction could follow from these resistance levels.
As long as price remains below 6888, bearish pressure can re-emerge.
If the market stays below 6852, downside continuation remains favored toward 6815.
Upside continuation only strengthens if the market breaks and holds above 6888, targeting the 6918 region.
Pivot Line: 6852
Resistance: 6873 · 6888 · 6918
Support: 6830 · 6815 · 6797

DAX40 resistance at 24300The DAX remains in a bullish trend, with recent price action showing signs of a breakout within the broader uptrend.
Support Zone: 23870 – a key level from previous consolidation. Price is currently testing or approaching this level.
A bullish rebound from 23870 would confirm ongoing upside momentum, with potential targets at:
24300 – initial resistance
24450 – psychological and structural level
24560 – extended resistance on the longer-term chart
Bearish Scenario:
A confirmed break and daily close below 23870 would weaken the bullish outlook and suggest deeper downside risk toward:
23712 – minor support
23600 – stronger support and potential demand zone
Outlook:
Bullish bias remains intact while the DAX holds above 23870. A sustained break below this level could shift momentum to the downside in the short term.
This communication is for informational purposes only and should not be viewed as any form of recommendation as to a particular course of action or as investment advice. It is not intended as an offer or solicitation for the purchase or sale of any financial instrument or as an official confirmation of any transaction. Opinions, estimates and assumptions expressed herein are made as of the date of this communication and are subject to change without notice. This communication has been prepared based upon information, including market prices, data and other information, believed to be reliable; however, Trade Nation does not warrant its completeness or accuracy. All market prices and market data contained in or attached to this communication are indicative and subject to change without notice.

NasdaqNASDAQ bounced from a strong demand zone, showing bullish momentum, as buyers step in, with key resistance levels ahead to watch for potential continuation.

S&P500 INDEX (US500): Bullish Move After Trap
I see a confirmed liquidity grab after a test of a major
intraday demand zone on US500.
An occurrence of a buying imbalance afterward
suggests a strong bullish pressure.
I expect a rise at least to 6875
❤️Please, support my work with like, thank you!❤️
I am part of Trade Nation's Influencer program and receive a monthly fee for using their TradingView charts in my analysis.

Fed Cuts, Treasuries Bounce, Dollar Slips FurtherGood morning traders! The Fed cut interest rates by 0.25% yesterday, marking the third straight cut. A few members dissented, showing the committee isn’t fully aligned. They proceeded with the cut as the job market continues to cool, even though inflation is still sticking around. The Fed also hinted this could be the last cut for a while and announced plans to start buying short-term Treasuries to keep liquidity stable. The US dollar remains under bearish pressure, while stocks hold steady, keeping the risk-on sentiment intact. This momentum could carry into year-end, we should just be aware of potential short-term pullbacks. USDollar Index - DXY remains nicely bearish, supported by 10Y US Treasury chart, as anticipated. If we consider that 10Y US Notes chart is now turning back to bullish mode, then DXY could easily see more weakness at least towards the open/unfilled GAP at 97.74 area.
NQ LongsStill in a bullish uptrend, Sweep of lows yesterday and momentum sustained towards the end of the day. Ideally, price should come to take Asia Lows and then move higher to take the most recent highs.
If we continue to move higher through London, I'll be watching previous highs as an area of interest for shorts In NY session.

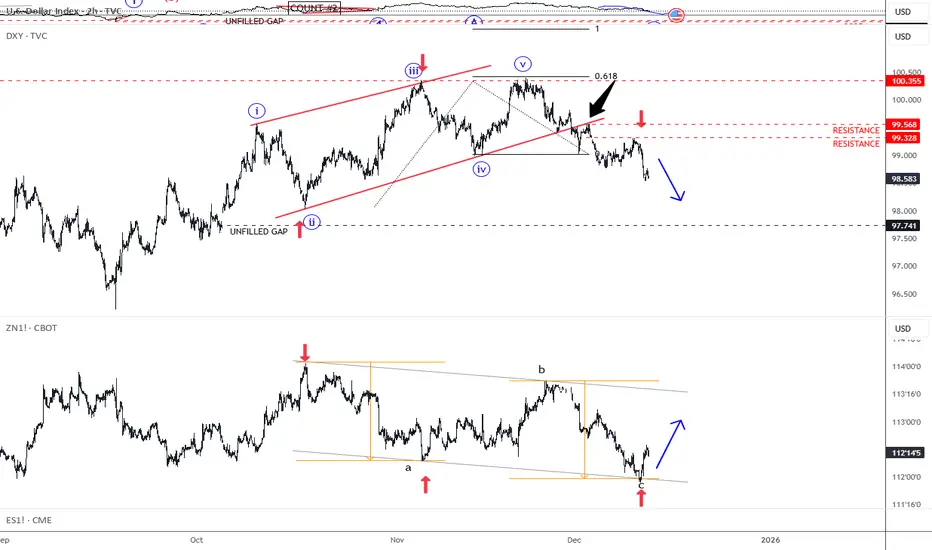
Dollar Index Chart Analysis After the Fed DecisionDollar Index Chart Analysis After the Fed Decision
Following yesterday’s FOMC interest rate decision and Jerome Powell’s press conference, the US Dollar Index (DXY) dropped sharply to point A.
On one hand, the 0.25% rate cut makes the dollar less attractive for capital preservation and yield. On the other, the prospect of a pause before further cuts provides some support.
Thus, the current level represents the market’s attempt to establish a fair valuation for the US currency.
Technical Analysis of the DXY Chart
Three days ago, we:
→ updated the system of two trend channels;
→ noted signs of seller dominance;
→ highlighted the formation of a consolidation zone.
Yesterday’s decline prompted an extension of the blue upward channel formed in October–November. Key insights from recent price action include:
→ the consolidation zone (marked by black lines) was broken after the median of the red channel acted as resistance (indicated by the arrow);
→ the price fell to the lower boundary of the red channel;
→ the former support around 98.78 acted as resistance this morning (marked by the second arrow);
→ the RSI indicator is near oversold levels, reflecting ongoing selling pressure.
Considering the above, a scenario of further downward movement along the lower boundary of the red channel seems plausible. If this develops, the price may fall to the lower boundary of the blue channel, which could serve as a key support level.
This article represents the opinion of the Companies operating under the FXOpen brand only. It is not to be construed as an offer, solicitation, or recommendation with respect to products and services provided by the Companies operating under the FXOpen brand, nor is it to be considered financial advice.

DXY may sell off from or above 98.77With rate cut, as expected DXY as created new lower low. The gap resistance at 99.32 has been tested and price finally managed break the trend line with FOMC realse.
Daily price opened with gap, which in currently retesting the swing high and possible rejection at 98.77 or above after a false breakout can lead the market to go futher lower to 97.84 or below.

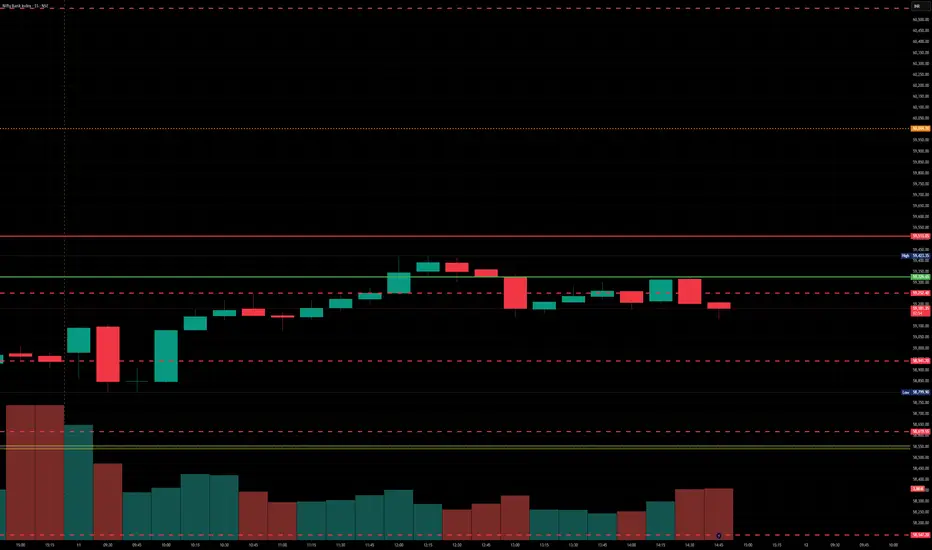
BankNifty levels - Dec 12, 2025Utilizing the support and resistance levels of BankNifty, along with the 5-minute timeframe candlesticks and VWAP, can enhance the precision of trade entries and exits on or near these levels. It is crucial to recognize that these levels are not static, and they undergo alterations as market dynamics evolve.
The dashed lines on the chart indicate the reaction levels, serving as additional points of significance. Furthermore, take note of the response at the levels of the High, Low, and Close values from the day prior.
We trust that this information proves valuable to you.
* If you found the idea appealing, kindly tap the Boost icon located below the chart. We encourage you to share your thoughts and comments regarding it.
Wishing you successful trading endeavors!
US30 Technical Breakdown – 12/11/2025📍 US30 Technical Breakdown – 12/11/2025
US30 rejected sharply from the 48,100–48,200 resistance zone, creating a clean wick rejection before pulling back into the mid-range. Despite the selloff, the broader structure remains bullish as long as price holds above 47,700, but momentum has clearly cooled with EMAs flattening out 🔍📉.
📊 Market Behavior:
🔹 Strong rejection from 48,150 — sellers defending heavy supply
🔹 EMAs tightening → momentum slowing after the push
🔹 Price stuck in a wide consolidation between 47,700–48,150
🔹 Bulls still defending higher-timeframe structure
📌 Key Levels:
🔹 Resistance:
48,150 → major supply / rejection zone
48,000 → intraday reaction level
47,930 → current retest zone
🔹 Support:
47,700 → immediate support (key for trend continuation)
47,500 → deeper intraday demand
46,960 → strong structural support if market breaks down
🧠 Bias:
Neutral-to-bullish above 47,700 📈
📈 Break & close above 48,150 → opens path to 48,300 → 48,500
📉 Lose 47,700 → downside opens toward 47,500 → 47,000
💡 Trade Ideas:
🔹 Bullish Setup:
Entry: 48,020 (break + retest above resistance)
TP1: 48,180
TP2: 48,320
SL: 47,820
🔹 Bearish Setup:
Entry: 47,680 (loss of support)
TP1: 47,500
TP2: 47,300
SL: 47,850
🎯 Summary:
US30 rejected the 48,100 resistance zone and is now rotating back toward support. Bulls remain in control on the higher timeframe, but short-term momentum has slowed. Watch 47,700 closely — hold = continuation, break = correction 🔥📊
Nifty levels - Dec 12, 2025Nifty support and resistance levels are valuable tools for making informed trading decisions, specifically when combined with the analysis of 5-minute timeframe candlesticks and VWAP. By closely monitoring these levels and observing the price movements within this timeframe, traders can enhance the accuracy of their entry and exit points. It is important to bear in mind that support and resistance levels are not fixed, and they can change over time as market conditions evolve.
The dashed lines on the chart indicate the reaction levels, serving as additional points of significance to consider. Furthermore, take note of the response at the levels of the High, Low, and Close values from the day prior.
We hope you find this information beneficial in your trading endeavors.
* If you found the idea appealing, kindly tap the Boost icon located below the chart. We encourage you to share your thoughts and comments regarding it.
Wishing you success in your trading activities!

Nasdaq 100 Chart Analysis After the Fed DecisionNasdaq 100 Chart Analysis After the Fed Decision
The Nasdaq 100 index showed sharp volatility yesterday following the interest rate announcement. The market action can be interpreted as follows:
→ First, the FOMC decision was released: as expected, the Federal Funds Rate was cut from 4.00% to 3.75% (a bullish catalyst), which pushed the index up towards point A.
→ However, half an hour later Jerome Powell’s press conference began, and his tone was noticeably hawkish (a bearish catalyst). The Fed Chair signalled that the rate-cutting cycle has been paused because inflation remains elevated and additional labour-market data is needed. As a result, the index fell sharply from point A to the low at point B.
Meanwhile, Donald Trump criticised the Fed’s decision, arguing that rates should be cut far more aggressively. This adds to uncertainty, especially given expectations that Powell will leave his post in May 2026.
Bearish pressure on the tech index intensified further after Oracle’s earnings release — see yesterday’s post for details. The results disappointed investors, fuelling renewed talk of an AI bubble, and ORCL shares plunged around 11% in after-hours trading.
Technical Analysis of the Nasdaq 100 Chart
Looking at recent price action in the Nasdaq 100, the index appears to be forming a bearish Rounding Top pattern:
→ The peak at point A resembles a bull trap, as the price only slightly exceeded the December highs before reversing — in SMC terms, a sign of a bearish liquidity grab.
→ The price then broke support from several recent sessions around 25,570 after forming a large bearish candle (marked by the arrow). This indicates strong selling pressure (a market imbalance) and the area may now act as resistance.
It is possible that bulls will attempt to recover some of yesterday’s losses today. However, if any rebound stalls near this resistance zone, the Nasdaq 100 may continue to drift lower along a rounding downward trajectory.
This article represents the opinion of the Companies operating under the FXOpen brand only. It is not to be construed as an offer, solicitation, or recommendation with respect to products and services provided by the Companies operating under the FXOpen brand, nor is it to be considered financial advice.
