US 100 Index – Potential Crunch Time for the Santa Rally!The US 100 has edged 0.2% lower to start this pivotal week as traders adjust positioning ahead of the final Federal Reserve meeting of 2025. This is a meeting at which the US central bank is widely expected to cut interest rates by 25bps and with markets pricing around a 90% chance of this happening it could be argued that anything else would be a major shock to the financial system.
Putting that to one side, there could also be challenges for traders to navigate even if the Fed does cut rates as expected, and this is where assessing the price action once the decision is released at 1900 GMT on Wednesday could be crucial.
The US 100 has rallied strongly from its November 21st low at 23834 up to current levels around 25650 at time of writing (0700 GMT). This 1800-point rally coincided with Fed policymakers talking more positively regarding their views on the potential for a further ‘near term’ rate cut, so it could be argued that this is now already priced into US stock indices.
More specifically, the US 100 is up around 21.5% year to date and consideration may need to be given to how motivated investors may be to add to their directional exposure versus locking in gains on what has been a strong 2025 performance.
With this as the backdrop moving into the next 36 hours of trading, assessing the current technical trend, alongside identifying potential key support and resistance levels could help to determine whether a Santa rally or a nasty case of ‘bah humbug’ volatility is more likely moving into the final 3 weeks of 2025.
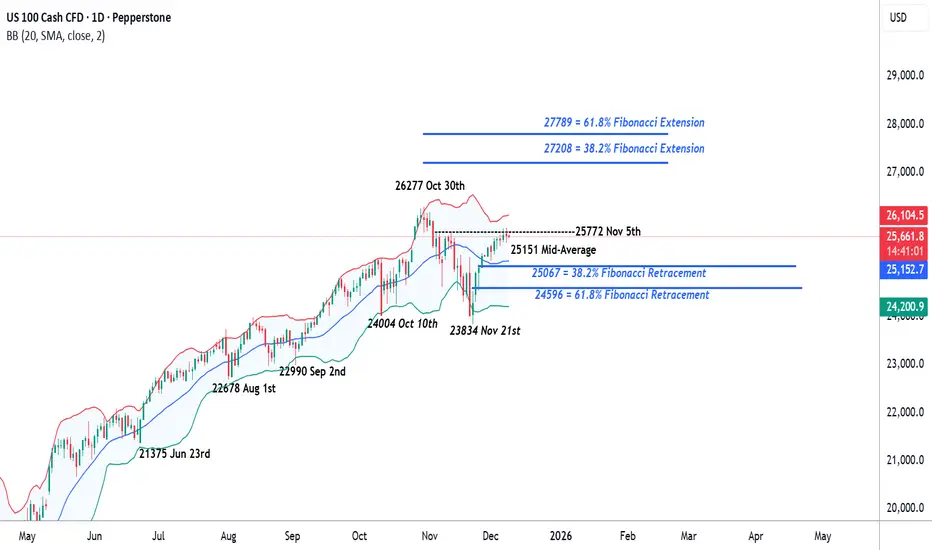
US 100 Index Technical Update: Stalling Against 25772 Resistance?
The US 100 index has staged an impressive 8.4% recovery from the 23834 November 21st low, yet the latest phase of strength may be stalling against potential resistance at 25772. This level, equal to the November 5th session high, has repeatedly capped attempts at fresh price strength throughout November and early December, as the chart below illustrates.
While much will depend on future price activity, traders may now view the 25772 resistance as something of a pivotal level. A successful close above 25772 might be required to open the way for further price strength. However, if 25772 continues to cap prices on a closing basis, the latest upside momentum may be seen as slowing with scope for downside weakness to emerge.
What Next if 25772 Is Broken on a Closing Basis?:
With resistance at 25772 potentially pivotal to future price activity, closing breaks above this level may now be required to sustain a push toward higher levels. Such moves, while not guaranteeing continued upside, could encourage further attempts to extend the latest strength.
Successful closes above 25772 could open the possibility of moves towards 26277, which is the October 30th upside extreme, and if this level were to also be broken, on further toward 27208, which is the 38.2% Fibonacci extension.
What Next if the 25772 Resistance Continues to Hold?:
With the 25772 resistance still intact on a closing basis, it is notable that the new week has once again seen selling pressure emerge around this level. The concern now for the bulls is that the longer 25772 continues to cap price strength, the greater the risk that downside momentum could begin to materialise.
If price weakness does emerge, trader focus may then shift to support offered by the rising Bollinger mid‑average, which currently stands at 25151. A closing break below 25151 could then raise risks of a deeper retracement of the November/December strength, with potential to test 25067, which is the 38.2% retracement, possibly even 24596, a level equal to the 61.8% retracement.
The material provided here has not been prepared accordance with legal requirements designed to promote the independence of investment research and as such is considered to be a marketing communication. Whilst it is not subject to any prohibition on dealing ahead of the dissemination of investment research, we will not seek to take any advantage before providing it to our clients.
Pepperstone doesn’t represent that the material provided here is accurate, current or complete, and therefore shouldn’t be relied upon as such. The information, whether from a third party or not, isn’t to be considered as a recommendation; or an offer to buy or sell; or the solicitation of an offer to buy or sell any security, financial product or instrument; or to participate in any particular trading strategy. It does not take into account readers’ financial situation or investment objectives. We advise any readers of this content to seek their own advice. Without the approval of Pepperstone, reproduction or redistribution of this information isn’t permitted.
Market indices
Nifty at a Breaking Point: Will 26,300 Finally Give Way?NIFTY is stuck at the major resistance zone 26,300, showing early weakness. The 25,650–25,700 zone aligned with the 50-day SMA will determine the next move.
Key Levels
• Major Resistance: 26,300
• First Support: 25,650 (SMA50)
• Second Support: 25,200
Bullish Scenario (Break & Close Above 26,300)
• Target 1: 26,750
• Target 2: 27,200
• Stop-loss: Daily close below 26,000
Bearish Scenario (Break Below 25,650 – SMA50)
• Target 1: 25,200
• Target 2: 24,800
• Stop-loss: Close above 25,850
Short Fundamental View
• Strong fund flows into large-cap Indian equities support the index.
• Economic stability and domestic growth keep the medium-term structure bullish.
• But the market is near all-time highs, increasing the probability of a corrective move.

Nifty Update: Market Opens Exactly as Expected—Caution ContinuesSharing today’s chart because Nifty has reacted exactly in line with the risk cues and technical structure we highlighted yesterday.
The opening dip and the break below the mid-channel zone reinforce the need for a cautious stance, especially in the current global environment.
1. Rising Channel Structure Under Pressure
Nifty has slipped below the mid-channel support, something we have been tracking as a key inflection area.
This shift tells us:
The trend is not broken, but it is weakening
Buying interest at the mid-band is not as strong as earlier
Supply zones remain dominant
Momentum continues to fade
The next meaningful support lies around 25,500 → 25,300, where the broader consolidation zone begins.
2. Today’s Candle Confirms the Loss of Upward Strength
The morning move shows:
A gap-down / weak open
Immediate follow-through on the downside
Sellers stepping in with confidence
No meaningful attempt to reclaim 26,000
This mirrors the exact setup we discussed:
a fragile structure vulnerable to global triggers.
3. Global & Macro Factors Are Playing a Bigger Role Now
a) Rupee Weakness vs Dollar
The ongoing softness in USDINR is adding pressure:
Signals global risk-off
Encourages FII outflows
Reduces appetite for Indian equities at higher levels
b) Upcoming India–US Trade Discussions
With bilateral trade talks around the corner:
Markets tend to avoid aggressive long positions
Any announcement on tariffs, tech access, or supply chain policy can impact sectors materially
FIIs typically step back ahead of such events
This keeps upside capped regardless of technical structure.
4. Price Action Is Moving Exactly as Highlighted Yesterday
We discussed that:
Upside was capped at 26,300+
Momentum was slowing
A cautious stance was appropriate
Global cues were not supportive
Today’s open has validated all of these observations.
5. Key Levels to Watch
Support:
25,800 (being tested today)
25,500 → 25,300 (major support zone)
Resistance:
26,000
26,300–26,350 (strong supply)
Unless Nifty reclaims 26,000 decisively, the bias stays cautious.
Final Thought — Time to Stay Defensive, Not Aggressive
While the larger trend is not broken, today’s move shows that the market is:
Losing strength
Sensitive to global cues
Showing supply dominance
Not ready for fresh breakouts
This is a phase to protect capital, avoid chasing, and stay selective.


NDX100 Analysis🔹 Rejection seen from the 0.786 Fibonacci retracement zone
🔹 Previous uptrend support line now acting as resistance
🔹 RSI showing early signs of exhaustion near key 60–70 zone
All these confluences hint at a possible pause or reversal unless we get a strong breakout with volume confirmation.

US100 Daily Chart AnalysisSimilar to DJI, US100 Showing:
🔹 Price testing channel resistance
🔹 Rejection seen from the 0.786 Fibonacci retracement zone
🔹 Previous uptrend support line now acting as resistance
🔹 RSI showing early signs of exhaustion near key 60–70 zone
🔹 Bearish divergence forming potential — caution advised
All these confluences hint at a possible pause or reversal unless we get a strong breakout with volume confirmation.
#US100 #NASDAQ100 #PriceAction #RSI #Fibonacci #ChartAnalysis #TradingView #ChartsDriven

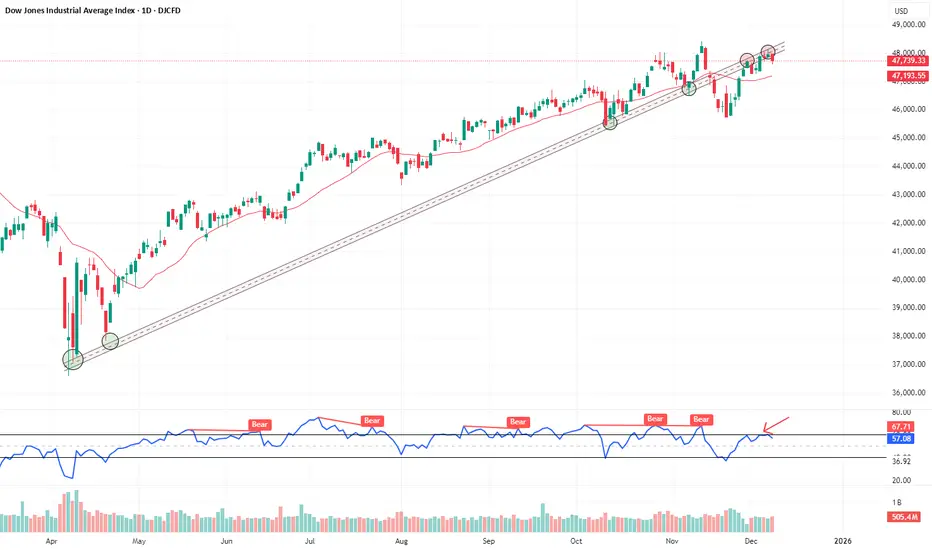
DOW JONES DAILY CHART ANALYSISClear trendline role reversal in play — previous support now acting as strong resistance📉
Price rejection seen near:
🔹 Trendline resistance
🔹 RSI bearish range shift (marked by repeated failures to cross 60)
🔹 Fib 0.786 retracement zone (not shown in chart)
All confluences suggest a potential pause or short-term pullback unless price breaks out with strong volume.
Analysis → Execution → Target Hit LIVE — Plus the New Road map. In today’s video I’ve covered a lot.
First, I revisited last week’s analysis and showed how the levels and structure played out almost exactly the way we discussed. It’s always good to see a plan unfold in real time —> it builds confidence in the process.
Then I walked through yesterday's trades honestly:
one breakeven, one small stop-loss and finally a clean target hit.
The whole thing is captured live, including the thinking and the psychology behind holding the winner.
This is the part I want people to take seriously —> a small loss will ALWAYS get wiped out by a strong risk-reward trade if you stick to your plan .
No hype, no euphoria, just following the process.
I’ve also shared my fresh analysis and what I’m expecting next from the market.
Levels, structure, probability. Everything is explained in a simple, practical way.
Hope the video helps you guys understand how real trading actually works:
small losses are normal… big winners come only when you let them.

#Nifty directions and levels for December 9th:Good morning, friends! 🌞
Market directions and levels for December 9th:
The Dow Jones shows a moderately bullish sentiment, while the Indian market indicates a bearish outlook. Today, the GIFT Nifty is expected to open approximately 80 points lower.
What to expect today?
> In the previous session, both Nifty and Bank Nifty experienced significant declines, suggesting a structural long correction. If the gap down sustains, we can expect the minimum targets of this correction to reach the channel bottom. if the index consolidates or breaks this level, the correction may continue.
> An important point is that this correction may occur gradually, the channel bottom will acting as a strong support.
> Additional technical factors to watch the 20 EMA (on the 15-minute chart) and the 38% Fibonacci retracement level. A break above the 20 EMA or the 38% Fibonacci level can confirm a reversal from bearish to bullish.
Until such confirmation, the market bias remains bearish.

#Banknifty directions and levels for December 9th:If the gap down sustains, we can expect the minimum targets of this correction to reach the channel bottom. if the index consolidates or breaks this level, the correction may continue.
> An important point is that this correction may occur gradually, the channel bottom will acting as a strong support.
> Additional technical factors to watch the 20 EMA (on the 15-minute chart) and the 38% Fibonacci retracement level. A break above the 20 EMA or the 38% Fibonacci level can confirm a reversal from bearish to bullish.
Until such confirmation, the market bias remains bearish.

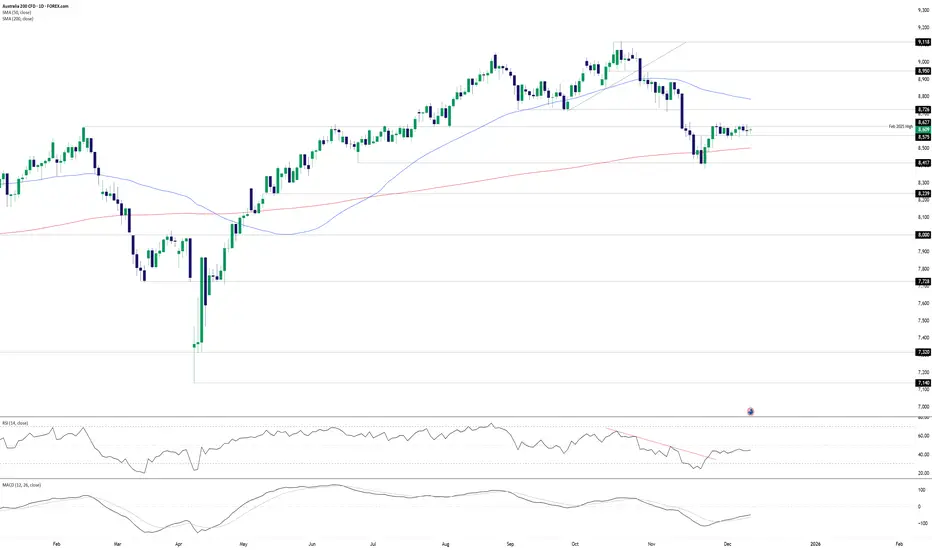
Breakout Risk Builds Before RBAOur ASX 200 contract continues to trade within a narrow range heading into the RBA’s December rate decision, with sellers active above the February high of 8,627 while buyers are lurking on dips below 8,575. Despite multiple probes through both levels over the past fortnight, there has been no close beyond them since 25 November—and that attempt failed.
While there’s no guarantee the RBA decision will deliver a range break, it does present a risk event with the potential to do so. With a well-defined range in play, a sustained breakout in either direction would allow trades to be set targeting a retest of higher or lower levels.
Should the price break and close above 8,627, longs could be established with a stop beneath the level, initially targeting 8,726 given it previously acted as support earlier this year. Conviction in the setup would be bolstered by a close above 8,650.
Conversely, a sustained break beneath 8,575 would flip the setup, with shorts established below the level and a stop above. The 200DMA or 8,417 screen as potential targets. Conviction would grow should the price close beneath the December MTD lows.
Momentum indicators lean marginally bearish on directional bias, though the overall signal is more neutral, placing emphasis on price action. Also note we’re approaching what is traditionally a strong seasonal period for Australian stocks in the second half of December.
Good luck!
DS
Bullish reversal?US Dollar Index (DXY) has bounced off the pivot and could rise to the 1st resistance.
Pivot: 98.83
1st Support: 98.40
1st Resistance: 99.53
Disclaimer:
The opinions given above constitute general market commentary and do not constitute the opinion or advice of IC Markets or any form of personal or investment advice.
Any opinions, news, research, analyses, prices, other information, or links to third-party sites contained on this website are provided on an "as-is" basis, are intended to be informative only, and are not advice, a recommendation, research, a record of our trading prices, an offer of, or solicitation for, a transaction in any financial instrument and thus should not be treated as such. The information provided does not involve any specific investment objectives, financial situation, or needs of any specific person who may receive it. Please be aware that past performance is not a reliable indicator of future performance and/or results. Past performance or forward-looking scenarios based upon the reasonable beliefs of the third-party provider are not a guarantee of future performance. Actual results may differ materially from those anticipated in forward-looking or past performance statements. IC Markets makes no representation or warranty and assumes no liability as to the accuracy or completeness of the information provided, nor any loss arising from any investment based on a recommendation, forecast, or any information supplied by any third party

NQ TOWARDS ALL TIME HIGHS Technical Analysis (Bullish Bias With Key Levels)
Nasdaq-100 futures (NQ) continue to show a bullish structure as long as price holds above the 25539 support zone. The market has been forming higher lows on the intraday timeframes, signaling continued buyer interest near liquidity pockets. Your bullish target at 25822 aligns with the current momentum, as price has been respecting trendline support and rotating upward from demand zones created during previous New York sessions. A clean break and hold above 25822 could open the door for an extension into the next liquidity cluster, allowing buyers to push toward psychological levels above 25900.
However, despite the bullish bias, the 25539 support remains the critical line in the sand. If this level fails, it would signal that the market has accepted lower pricing and that sellers have absorbed buy-side liquidity. A decisive break below 25539—especially accompanied by high volume—would likely trigger short-term momentum shorts targeting the imbalance zones created during the last leg up. This shift would invalidate the bullish structure and potentially initiate a deeper retracement toward the previous week’s value area. Until then, bulls remain in control, but the reaction at 25539 will determine whether the trend continues or flips.
Fundamental Analysis
From a macro perspective, NQ remains supported by strong fundamentals driven primarily by the performance of large-cap tech companies, resilient corporate earnings, and ongoing investor expectations for future rate cuts. The Federal Reserve’s tone has recently shifted more dovish, indicating that although inflation remains sticky, monetary easing is still on the table for the upcoming quarters. This keeps growth sectors—especially technology—attractive, as lower interest rates improve future earnings projections and strengthen valuation models for high-beta stocks.
At the same time, markets remain sensitive to macroeconomic data releases such as CPI, PCE, and labor-market readings. Any upside surprise in inflation or stronger-than-expected employment data could temporarily pressure NQ, as it may delay the Fed’s easing timeline. Additionally, geopolitical tensions and shifts in semiconductor policy remain potential sources of volatility. Overall, while short-term fluctuations are expected, the fundamental backdrop continues to favor higher prices for Nasdaq-focused assets, supporting your bullish outlook until key support levels fail.

SPX selloff could have just begunRising Japanese 10Y bond yield will reverse the carry trade of borrowing in JPY and investing in other higher yielding assets in other countries. With Japan inflation on the rise and BOJ cornered by very high debt/gdp their ability to keep buying government debt could be limited.
Also long term cycle of Japan225 supports this idea
Since GFC all the central banks, mainly the USA FED have been supporting the markets by QE and the governments racking up massive debt to mitigate one crisis after another.
Have you wondered, if all the government are in debt, who is buying these debts? Well, its asset management firms like Blackrock and others using your pension and super funds to invest in these debts. In other words when you take a mortgage on your house you are staking your current and future savings, without you knowing it. Ha. Ha. Your mortgage is repackaged by your bank and sold to these funds, who use your super and pension as MARGIN money!!! That is why you are now allowed to use your super to borrow by law, because that right is given to your fund managers

Nifty Index - Price Action & PsychologyPsychology comes first in trading.
Risk–reward comes second.
The setup comes last.
Always take entries where the risk–reward is favorable.
If the setup does not offer a good risk–reward ratio, simply ignore the trade.
At the support zone:
If any 5-min or 15-min candle closes below support, consider a bearish trade and look for call-option selling opportunities.
If the market opens gap-up above the support zone
Wait for a pullback toward the nearest zone.
Enter only if the price takes support or gives a clear single
let the structure form.
If the market opens gap-down below the support zone
Wait for a retest of the breakdown level.
If the retest fails, it confirms weakness → consider bearish entries / call selling.(I am option seller)
If the price reclaims the level, avoid shorting structure has changed.

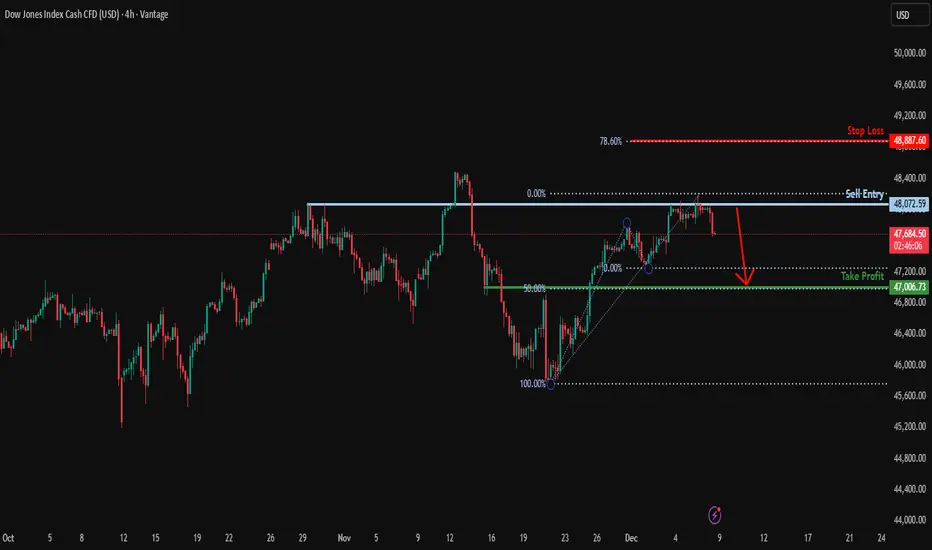
Could we see a reversal from here?NAS100 has rejected off the resistance level, which is a pullback resistance and could potentially drop from this level to our take profit.
Entry: 48,072.59
Why we like it:
There is a pullback resistance level.
Stop loss: 48,887.60
Why we like it:
There is a resistance level at the 78.6% Fibonacci projection.
Take profit: 47,006.73
Why we like it:
There is a pullback support that aligns with the 50% Fibonacci retracement.
Enjoying your TradingView experience? Review us!
Please be advised that the information presented on TradingView is provided to Vantage (‘Vantage Global Limited’, ‘we’) by a third-party provider (‘Everest Fortune Group’). Please be reminded that you are solely responsible for the trading decisions on your account. There is a very high degree of risk involved in trading. Any information and/or content is intended entirely for research, educational and informational purposes only and does not constitute investment or consultation advice or investment strategy. The information is not tailored to the investment needs of any specific person and therefore does not involve a consideration of any of the investment objectives, financial situation or needs of any viewer that may receive it. Kindly also note that past performance is not a reliable indicator of future results. Actual results may differ materially from those anticipated in forward-looking or past performance statements. We assume no liability as to the accuracy or completeness of any of the information and/or content provided herein and the Company cannot be held responsible for any omission, mistake nor for any loss or damage including without limitation to any loss of profit which may arise from reliance on any information supplied by Everest Fortune Group.