#Nifty Directions and Levels for December 23Good morning, friends! 🌞
Market Directions and Levels for December 23
The global markets are showing a bullish sentiment (based on the Dow Jones), and the Indian market also indicates a bullish outlook. Today, the market may open on a positive note due to GIFT Nifty showing about 50 points up.
What to Expect Today?
The global market structure has a solid bullish bias, and the Indian market also formed a solid candle in the previous session. Sentimentally, it suggests a positive day today as well. In my opinion, the Nifty could move in line with yesterday’s pattern. On the other hand, Bank Nifty is displaying a solid bullish structure, which means that if it breaks the 78% resistance, we can expect a long rally. Let’s look at the charts.
Nifty
Current view:
> If the market opens with a gap-up, it could reach 26,269—a resistance zone. Structurally, it could undergo a minor retracement of 23% to 38% in the current swing. However, if it breaks through without rejection(26269), follow the rally
> Note: if the gap-up does not sustain and declines, we can apply the same sentiment until it breaks the 38% retracement level. If it breaks, we can expect the correctional targets at 50% and 78% in the current swing.
Market indices

#Banknifty Directions and Levels for December 23Bank Nifty
Current view:
> If the market opens with a gap-up, structurally we could see a long rally that may reach a minimum of 59,545 to 59,651.
Alternate view:
> If the gap-up does not sustain and declines, we can expect a 23% to 38% retracement in the current swing. Structurally, it may fail to break. However, if it breaks, we could expect a range-bound market

NIFTY Quick View – Dec 23, 2025NIFTY Quick View – Dec 23, 2025
(Chart: )
Spot:
26177
Supports
30min: 26,000
|| 1D: 25,700
View
Supports dominate – no visible resistance.
Higher likelihood of testing support than reaching new all-time highs.
Trade Approach
Enter long calls on rejection at put strikes (support holds).
• Enter long puts on rejection at call strikes (upside fails).
Dynamic flip: Shift to inverse strikes when the initial direction weakens.
Clear levels only – no SL or targets provided.
You define your own setup.
DYOR – Options trading carries high risk! 📈
More details on my view
www.tradingview.com
www.tradingview.com
My Trading approach
www.tradingview.com

S&P500 Elliott Wave Analysis | SPX | SPY This technical analysis is not financial advice. This is bases on Elliott Wave Theory. SP:SPX

US30, Big Money Waiting Below, Buy the Dip or a Trap?📌 Market Structure
On the higher timeframe, H4 structure remains bullish, indicating that institutional money is still in control.
The recent move on H1 shows a short-term downtrend, which appears to be a controlled pullback rather than a full trend reversal.
📌 Order Block & Volume
Price is approaching a clear Bullish Order Block on the H2 timeframe.
Strong volume expansion near the lows confirms that Big Money has already reacted in this zone.
This is not panic selling, but a technical retracement into demand.
📌 Liquidity Perspective
The recent sell-off has swept late buyers’ liquidity above previous highs.
After liquidity is taken, price often returns to an Order Block to rebalance and accumulate long positions.
📌 Trading Plan
Buy Zone: H2 Bullish Order Block
Stop Loss: Below the Order Block low
Target: Upper liquidity zone
Risk / Reward: Approximately 2 : 1, aligned with institutional trading logic
🧠 Final Thought
As long as the H4 uptrend remains intact, pullbacks should be viewed as accumulation opportunities, not reasons to panic.
⚠️ Disclaimer
This analysis is for educational purposes only.
Not financial advice. Always manage your risk.

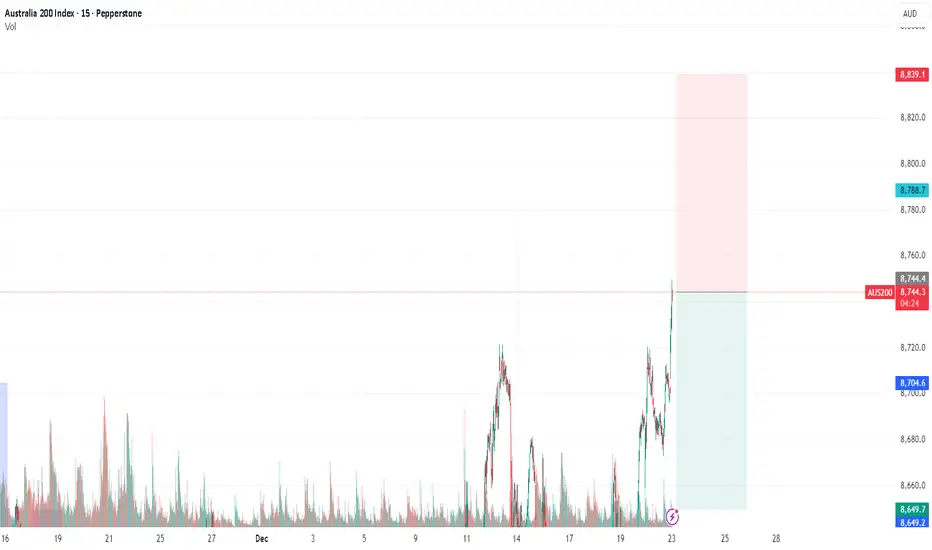
AUS200 - consider SHORT Team, we have successfully trade AUS200 long last week, all target hits
Time to consider short AUS200 at 8743-8756
STOP LOSS at 8775 or 8786
Target 1 at 8720-12
Target 2 at 8696-8685
LETS GO
U.S. Dollar Index (DXY) – Daily / Long-Term OutlookThe U.S. Dollar Index is currently trading at a major long-term demand zone, holding above the key support around 96.25–98.20. This area has historically acted as a strong reaction zone, and price is showing signs of base formation after an extended corrective phase.
Structurally, DXY previously completed a strong impulsive rally toward the 114.87 resistance (real algo level) before entering a prolonged distribution and decline. The recent selloff appears corrective rather than trend-ending, as price has now begun to respect an ascending trendline, suggesting early signs of bullish re-accumulation.
The projected path highlights a potential higher-low structure, followed by a gradual bullish expansion. A sustained move above the psychological 100–102 zone would confirm momentum shift, opening the door for a retest of the 110 SMT resistance, and ultimately a push back toward the 114.87 major high.
As long as price holds above the 96.25 support and continues to print higher lows, the long-term bullish bias remains valid. A clean break below this support would invalidate the bullish scenario and signal further downside risk.

ASX200 to see extended gains?ASX200 - 24H expiry
Price action looks to be forming a bottom.
A break of the recent high at 8722 should result in a further move higher.
We look for gains to be extended today. Our outlook is bullish.
The primary trend remains bullish.
We look to Buy a break of 8723 (stop at 8649)
Our profit targets will be 8883 and 8913
Resistance: 8722 / 8750 / 8800
Support: 8655 / 8610 / 8543
Risk Disclaimer
The trade ideas beyond this page are for informational purposes only and do not constitute investment advice or a solicitation to trade. This information is provided by Signal Centre, a third-party unaffiliated with OANDA, and is intended for general circulation only. OANDA does not guarantee the accuracy of this information and assumes no responsibilities for the information provided by the third party. The information does not take into account the specific investment objectives, financial situation, or particular needs of any particular person. You should take into account your specific investment objectives, financial situation, and particular needs before making a commitment to trade, including seeking, under a separate engagement, as you deem fit.
You accept that you assume all risks in independently viewing the contents and selecting a chosen strategy.
Where the research is distributed in Singapore to a person who is not an Accredited Investor, Expert Investor or an Institutional Investor, Oanda Asia Pacific Pte Ltd (“OAP“) accepts legal responsibility for the contents of the report to such persons only to the extent required by law. Singapore customers should contact OAP at 6579 8289 for matters arising from, or in connection with, the information/research distributed.

UK100 SHORTS
Anticipating a 3 touch ascending channel towards the Value area. A H4 or H1 rejection would be an ideal Risk entry

Dow Jones – Low Volume Expected During My Trading SessionDuring my trading session tomorrow,
volume is expected to remain very low.
This means patience is required.
I am not expecting meaningful moves
until after the New York Open.
Based on the structure and the schematic I’ve drawn,
the market is more likely to start executing that plan
once real liquidity enters the market.
No rush.
No forcing trades.
Timing and liquidity always come first.

check the trend It is expected that the upward trend will end at the current resistance level and we will see the beginning of the downward trend. If the index breaks through the resistance level, the continuation of the upward trend will be likely.

NIFTY Bank Index — Intraday Technical Analysis for 23-Dec-2025NSE:BANKNIFTY
NIFTY Bank Index — Chart Pathik Intraday Levels for 23-Dec-2025
(If these levels add value to your trades, a quick boost or comment goes a long way in supporting this free content and keeping our trading community thriving!)
Nifty Bank is trading near 59,284, moving in a tight range just below the zero line at 59,304 after a volatile session, turning this band into the key intraday pivot between continuation of the recovery and renewed selling pressure.
Bullish Structure
Longs activate above the Long Entry level at 59,289 once price sustains above the zero line at 59,304 with follow-through strength.
Targets: 59,437 (Long Target 1 / primary booking zone) and 59,520 (Long Target 2 / extended move if momentum holds).
Control: Place stops or trail risk near 59,263–59,217 (Add Long Pos. base and Long Exit) to stay protected if the breakout fails and price slips back into the lower band.
Bearish Structure
Shorts remain favoured while price struggles below 59,304 and especially on rejections from the Short Exit at 59,310 after tests of the zero line.
Fresh shorts open below the Short Entry at 59,238 or on failed pushes above 59,289 that quickly fall back under 59,263.
Targets: 59,171 (Short Target 1 / first profit zone near Day Bias – Buy 59,156) and 59,088 (Short Target 2 / extended downside if sellers regain control).
Neutral Zone
59,304 is today’s inflection—expect choppy, stop-hunting action while Nifty Bank oscillates between roughly 59,263 and 59,310 without decisive 15‑minute closes beyond either side.
Every setup is designed for structure, plan, and logic—let the chart work for you, not your emotions.
Boost or comment if these levels help your preparation—help Chart Pathik keep delivering quality analysis to more intraday traders!

S&P500 mini Santa Rally up next on a 1H Golden Cross.S&P500 (SPX) is about to complete a Golden Cross today on the 1H time-frame. The last time it did that was on November 25, almost 1 month ago, while trading on the first Bullish Leg of the current Channel Up pattern.
Following the 1H Golden Cross, the index rallied to the 1.236 Fibonacci extension level, before turning sideways. As a result this could be the mini Santa Rally that the market is waiting, targeting 6920.
---
** Please LIKE 👍, FOLLOW ✅, SHARE 🙌 and COMMENT ✍ if you enjoy this idea! Also share your ideas and charts in the comments section below! This is best way to keep it relevant, support us, keep the content here free and allow the idea to reach as many people as possible. **
---
💸💸💸💸💸💸
👇 👇 👇 👇 👇 👇

NIFTY 50 Index — Intraday Technical Analysis for 23-Dec-2025NSE:NIFTY
NIFTY 50 Index — Chart Pathik Intraday Levels for 23-Dec-2025
(If these levels add value to your trades, a quick boost or comment goes a long way in supporting this free content and keeping our trading community thriving!)
Nifty 50 is trading near 26,163 after a sharp gap-up and trending move, now testing the zero line at 26,173 where fresh buyers and profit-bookers are squaring off. Price is holding higher lows intraday, but immediate resistance sits just overhead, so reactions around this band are crucial.
Bullish Structure
Longs remain active above the Long Entry level at 26,130 as long as price defends the Add Long Pos. zone at 26,114 on dips.
Targets: 26,255 (Long Target 1 / primary booking area) and 26,306 (Long Target 2 / extended move if momentum persists).
Control: Stop or trail can sit around 26,099–26,086 (Short Entry and Long Exit cluster) to keep risk defined if the breakout loses strength.
Bearish Structure
Shorts are only favoured on clear rejection from 26,173–26,143 (zero line and Short Exit) with failure to hold back above 26,130.
Downside focus: 26,091 (Short Target 1) and 26,040 (Short Target 2 near the Day Bias – Buy / Long Till Safe at 26,048) if sellers press price back inside prior value.
Control: Quick covers are needed if price sustains above 26,173 and pushes toward 26,255, where bearish structure breaks.
Neutral Zone
26,173 is today’s inflection—expect choppy, stop-hunting action while Nifty oscillates between roughly 26,130 and 26,173 without decisive 15‑minute closes beyond either side.
Every setup is designed for structure, plan, and logic—let the chart work for you, not your emotions.
Boost or comment if these levels help your preparation—help Chart Pathik keep delivering quality analysis to more intraday traders!

DXY lean & Professional
DXY swept sell-side liquidity and showed bullish intent. Looking for continuation toward buy-side liquidity above.
Smart Money / ICT Style
Sell-side liquidity taken on DXY, followed by bullish displacement. Long bias targeting liquidity resting above highs.
Very Short
DXY ran sell-side liquidity. Buying the move toward buy-side liquidity.
Confident
Downside liquidity cleared on DXY. Bullish continuation expected toward highs.
Minimalist
Sell-side liquidity sweep → bullish continuation.

DXY – TFOTechnical:
Price is pulling back from the 98.70–98.75 area and trading around 98.30. Short-term momentum is bearish while below 98.50. A break under 98.20 could extend toward 98.00–97.90. Reclaiming 98.55 would reopen upside toward recent highs.
Fundamental:
Dollar remains pressured by softer yield expectations and a more cautious Fed outlook. Near-term moves depend on US data and rate expectations; weakness persists if yields stay capped.

NAS100 – TFOTechnical:
Price is holding above the 25,400 area after a strong recovery from the 24,700 lows. Short-term structure remains bullish while above 25,300. A clean break above 25,500 could extend toward 25,700–25,900. Failure to hold 25,300 opens room for a pullback to 25,000–24,900.
Fundamental:
Nasdaq remains supported by expectations of softer financial conditions and resilience in large-cap tech. Near term price action is still sensitive to US yields, USD moves, and macro data.

Key US Data This Holiday WeekBecause of Christmas, the US calendar is short and compressed. The main US events this week (22–28 December) are:
1. ADP Weekly Employment Change 👷♂️
High‑frequency look at US private‑sector employment from ADP. It’s not perfect, but markets use it as a soft preview for labor trends.
Bullish outcome (for risk assets):
Moderate positive reading (e.g., steady job gains, not a spike or collapse) → supports the “soft‑landing” story.
Stocks and crypto usually handle this well because it means growth is holding without screaming overheating.
Bearish outcome:
Big downside surprise (jobs stalling or negative) → recession fears, risk‑off; Treasuries and USD can catch a bid.
Big upside surprise (very strong hiring) could worry markets that the Fed will stay tighter for longer, lifting yields and pressuring growth/tech.
2. Q3 GDP (Prelim) & GDP Price Index 📊
Stronger than expected GDP / hotter price index:
Suggests the US economy is still running hot.
Could be good for cyclicals and value stocks short‑term, but if the GDP Price Index is also high, yields may rise and weigh on growth, tech, and crypto as markets push out rate‑cut hopes.
Weaker GDP / cooler price index:
Signals cooling growth and easing price pressure.
Initial reaction may be risk‑off (growth worries), but bonds rally and markets can later flip to “more cuts coming”, which supports duration and high‑beta plays if the slowdown looks controlled rather than crash‑like.
3. CB Consumer Confidence 🛒🏭
Higher reading: supports continued consumer spending → good for retail, discretionary stocks, and broad indices.
Sharp drop: raises recession odds in traders’ minds → rotation into defensives; can hurt high‑beta equities and crypto.
Conclusion
If the overall picture is: solid growth + ok confidence + no big downside shock in orders, markets will likely keep leaning toward the soft‑landing / gradual‑cuts scenario → supportive for US indices and crypto, especially if yields don’t spike.
If the data tilt either to “too strong” (growth + orders + confidence all hot) or “too weak” (clear slowdown across the board), expect bigger moves in yields and USD, and accordingly more volatility in equities and crypto as the market re‑prices the 2026 Fed path.
US100 Liquidity Reaction at Accumulation Box Volume ProfileThis analysis is based on a Volume Profile anchored to the most recent accumulation box in order to isolate the active auction. The goal is to understand whether price is accepting value or rejecting it, rather than attempting to predict direction.
US100 recently attempted to trade above the upper value region but failed to hold acceptance. Price is now rotating back into the composite range, suggesting a transition from expansion to balance.
Volume Profile Perspective
The anchored Volume Profile highlights where the majority of recent transactions occurred. These levels define fair value and serve as decision points for continuation or rotation.
Price is currently interacting with a key acceptance area that has previously acted as both support and resistance. This makes it a critical zone for determining short-term control.
Key Reference Levels
Upper distribution and rejection zone from prior highs
Value acceptance area defined by the anchored profile
Lower value boundary and high-volume support
Lower composite distribution below value
These levels are treated as reaction zones, not precise turning points.
Expected Market Paths
Path One: Continued Rejection and Rotation Lower
If price fails to reclaim acceptance above the value area and continues to form lower highs, rotation toward the lower value boundary becomes the higher probability outcome. Acceptance below value would open the path toward the next lower composite distribution.
Path Two: Reacceptance Into Value
If price reclaims the value area and holds above it with acceptance, rotation back toward the upper distribution becomes likely. In this case, the prior rejection zone would act as the next area to evaluate for continuation or rejection.
Execution Considerations
This environment favors patience and reaction over anticipation. Trades are best evaluated at value boundaries rather than inside the range. Acceptance and rejection should be confirmed through structure and follow-through, not single candles.
This is a contextual market analysis, not a trading signal.
Summary
US100 is currently trading within a decision zone defined by an accumulation-based Volume Profile. The next directional move depends on whether price accepts back above value or continues to reject and rotate lower. Letting the market confirm intent at these levels is critical.

The S&P 500 Is Back Near Record Highs. What Its Chart SaysThe S&P 500 SP:SPX is up some 17% year to date and just below the record high it set earlier this month, but its chart is getting a bit confusing. Let's check it out.
Take a look at the S&P 500's daily chart going back to July and running through Wednesday:
The first thing you'll see is a cup-with-handle pattern that failed to produce a breakout, as marked with a curvy black line at the chart's right.
That said, readers will note that the S&P 500 did regain its 21-day Exponential Moving Average (or "EMA," denoted by a green line) and 50-day Simple Moving Average (or "SMA," marked with blue line) in late November.
Then it posted a "reconfirmation of bullish trend" on Dec. 10 (as marked with a green box at the chart's extreme right). With this move, the index's supposed positivity had been confirmed by increased volume.
However, some mixed messages have developed since then.
For example, the S&P 500 reversed its positivity on Dec. 12, although not on significant volume.
The index then found technical support again at its 21-day EMA, but that only lasted for two days. Still, the S&P 500 next garnered support at its 50-day SMA.
Despite the fact that index's recent bullish confirmation has been broken, the SPX's bullish thesis appears to remain in play as long as that 50-day line holds at 6,765.10. (The S&P 500 was trading at 6,876.41 as of midday Monday.)
Meanwhile, the SPX's Relative Strength Index is sporting a neutral reading.
However, the index's daily Moving Average Convergence Divergence indicator (or "MACD," marked with black and gold lines and blue bars at the chart's bottom) recently lost its bullish posture.
The histogram of the 9-day EMA has dipped into negative territory, while the 12-day EMA (the black line) has crossed below the 26-day EMA (the gold line).
All in, this is neither a truly bullish chart -- nor a truly bearish one.
(Moomoo Technologies Inc. Markets Commentator Stephen "Sarge" Guilfoyle had no position in S&P 500-based securities at the time of writing this column.)
This article discusses technical analysis, other approaches, including fundamental analysis, may offer very different views. The examples provided are for illustrative purposes only and are not intended to be reflective of the results you can expect to achieve. Specific security charts used are for illustrative purposes only and are not a recommendation, offer to sell, or a solicitation of an offer to buy any security. Past investment performance does not indicate or guarantee future success. Returns will vary, and all investments carry risks, including loss of principal. This content is also not a research report and is not intended to serve as the basis for any investment decision. The information contained in this article does not purport to be a complete description of the securities, markets, or developments referred to in this material. Moomoo and its affiliates make no representation or warranty as to the article's adequacy, completeness, accuracy or timeliness for any particular purpose of the above content. Furthermore, there is no guarantee that any statements, estimates, price targets, opinions or forecasts provided herein will prove to be correct.
Moomoo is a financial information and trading app offered by Moomoo Technologies Inc. In the U.S., investment products and services on Moomoo are offered by Moomoo Financial Inc., Member FINRA/SIPC.
TradingView is an independent third party not affiliated with Moomoo Financial Inc., Moomoo Technologies Inc., or its affiliates. Moomoo Financial Inc. and its affiliates do not endorse, represent or warrant the completeness and accuracy of the data and information available on the TradingView platform and are not responsible for any services provided by the third-party platform.

NIFTY Analysis 23rd Dec '25: IntraSwing Spot levelsNIFTY Analysis 23rd Dec '25: IntraSwing Spot levels
Follow GIFTNIFTY Post for NF levels
💥Level Interpretation / description:
L#1: If the candle crossed & stays above the “Buy Gen”, it is treated / considered as Bullish bias.
L#2: Possibility / Probability of REVERSAL near RLB#1 & UBTgt
L#3: If the candle stays above “Sell Gen” but below “Buy Gen”, it is treated / considered as Sidewise. Aggressive Traders can take Long position near “Sell Gen” either retesting or crossed from Below & vice-versa i.e. can take Short position near “Buy Gen” either retesting or crossed downward from Above.
L#4: If the candle crossed & stays below the “Sell Gen”, it is treated / considered a Bearish bias.
L#5: Possibility / Probability of REVERSAL near RLS#1 & USTgt
HZB (Buy side) & HZS (Sell side) => Hurdle Zone,
*** Specialty of “HZB#1, HZB#2 HZS#1 & HZS#2” is Sidewise (behaviour in Nature)
Rest Plotted and Mentioned on Chart
Color code Used:
Green =. Positive bias.
Red =. Negative bias.
RED in Between Green means Trend Finder / Momentum Change
/ CYCLE Change and Vice Versa.
Notice One thing: HOW LEVELS are Working.
Use any Momentum Indicator / Oscillator or as you "USED to" to Take entry.
⚠️ DISCLAIMER:
The information, views, and ideas shared here are purely for educational and informational purposes only. They are not intended as investment advice or a recommendation to buy, sell, or hold any financial instruments. I am not a SEBI-registered financial adviser.
Trading and investing in the stock market involves risk, and you should do your own research and analysis. You are solely responsible for any decisions made based on this research.
"As HARD EARNED MONEY IS YOUR's, So DECISION SHOULD HAVE TO BE YOUR's".
Do comment if Helpful .
Do Comment for In depth Analysis.
❇️ Follow notification about periodical View

NAS TakeSupport levels from pivot points and multiple moving averages create a technical base that reduces downside risk in the short term.
Volume remains steady, which confirms the reliability of the ongoing trend.
These combined technical factors typically precede price appreciation in the Nasdaq 100 , suggesting the index will likely continue to Declines hortly based on trend-following and momentum-based trading strategies with limited immediate overbought risk.

Hang Seng | Post-Rally Compression at Key TrendlinesThe Hang Seng has staged a strong recovery from the early-year lows, driven largely by improving China sentiment rather than earnings momentum. Recent gains have been fuelled by targeted policy support, stabilisation in property stress headlines, and renewed foreign inflows into select China-linked equities.
What’s Been Driving the Move:
Policy support: Beijing has leaned on incremental easing — liquidity injections, modest fiscal support, and rhetoric aimed at stabilising growth rather than aggressively reflating.
Property narrative stabilisation: While not “fixed,” the pace of negative surprises from the property sector has slowed, reducing tail-risk pricing.
Valuation + positioning: Hong Kong equities entered the year deeply discounted, with light global positioning amplifying upside once sentiment turned less bearish.
Tech leadership: Large-cap China tech has acted as the marginal driver, benefiting from regulatory pressure easing compared to prior years.
Technical Lens:
After the sharp advance, price has transitioned into a contracting triangle. Lower highs against rising support suggest consolidation rather than outright rejection so far. Momentum has cooled, but RSI holding around neutral implies digestion, not distribution. This is a classic pause after trend expansion.
Scenarios:
If the lower trendline holds: The structure resolves as continuation, keeping the broader recovery intact and opening the door for another leg higher toward the prior highs.
If support gives way: A break would likely signal a deeper corrective phase, retracing part of the prior rally as the market reassesses growth follow-through.
Potential Forward Catalysts:
China macro data (PMIs, credit growth, consumption)
Any escalation from “targeted” to broader stimulus measures
Property-sector policy clarity or renewed stress
Global risk appetite and USD direction, which remain key for HK equities
Takeaway:
This triangle is a decision point, not a signal. As long as support holds, this looks like consolidation after a powerful rebound. A breakdown would suggest the rally needs more policy backing to continue. Watching reaction, not forcing direction.
