NATF✅ Trade Plan:
Entry: Buy around 395 (current market).
Stop Loss: 377.5 (protecting capital in case of breakdown).
Target Profit: 417+ (channel resistance).
Risk/Reward Ratio (RRR):
Risk ≈ 17 pts (395 – 377.5).
Reward ≈ 22 pts (417 – 395).
RRR ~ 1.3 : 1 → acceptable.

Searle Analysis Searle taking resistance from the trendline and Fib 0.382 level. It has tested the trendline and Fib 0.382 twice and got rejected. It can take support from MA100 (104) and try once again. to break the trendline.
On a bigger view, it is making a symmetric triangle. Once it breaks this triangle, price will move towards next levels.
Target as per symmetric triangle can be 227 - 230 (Fib 0.786 level).
However, this may take some time and fundamental turn around will drive it.

BFBIO – TECHNICAL BUY CALL | 24 AUG 2025 (5-MIN TF) BFBIO – TECHNICAL BUY CALL | 24 AUG 2025 (5-MIN TF)
The stock marked a high of Rs. 190, then pulled back, and now seems to be completing its pullback within a bullish structure. Price action suggests readiness for an upward move.

MARI – TECHNICAL BUY CALL | 24 AUG 2025 (5-MIN TF) MARI – TECHNICAL BUY CALL | 24 AUG 2025 (5-MIN TF)
The stock accumulated in a trading zone (marked with a yellow channel), broke out to Rs. 675, pulled back to Rs. 624, and now looks ready to resume its upward move.

BELA – TECHNICAL BUY CALL (Day TF) | 23 AUGUST 2025BELA – TECHNICAL BUY CALL | 23 AUGUST 2025 (Day TF)
The stock was previously in a downtrend but now shows signs of stabilization at a major support level marked with a blue solid line. Recent price action and volume distribution suggest the stock is ready for an upward move.

Systems Ltd. (SYS) Technical AnalysisOverall Trend
On the 4-hour timeframe, SYS is in a bullish trend, making consistent Higher Highs (HH) and Higher Lows (HL).
Price recently retraced after touching 144.45 PKR, and is now testing Fibonacci support zones.
📈 Chart Highlights
Fibonacci Levels & Golden Zone
The retracement from the 144.45 high is approaching the golden ratio (0.618 Fib, ~126.68 PKR).
Ideal buying zone lies between 127 – 129.33 PKR, aligning with Fib support and trendline confluence.
Trade Setup
Buy Zone: 127 – 129.33 PKR (golden ratio support).
Stop Loss (SL): 121.85 PKR (below Fib 0.786 and structure support).
Profit Targets
TP1: 138.17 PKR (near recent HH and Fib 0.236 resistance).
TP2: 144.67 PKR (retest of previous top & extension target).
📊 Indicators
RSI Divergence (14-period):
Currently at 54.34, slightly above neutral, giving room for upside.
Previous bearish divergences caused corrections, but no strong bearish reversal confirmed yet.
Momentum is stabilizing for a potential bullish bounce from support.
🔑 Trading View
SYS remains bullish as long as it holds above the 121.85 PKR stop zone.
A dip into the golden Fibonacci zone offers a high-probability buy entry.
The next upside move could push toward 138–145 PKR targets.
✅ Summary: Systems Ltd. (SYS) on PSX is bullish, with a trade plan to buy near 127–129.33 PKR at Fib golden zone. Stop loss at 121.85, with TP1 = 138.17 and TP2 = 144.67. RSI supports a bullish rebound after consolidation.

TOWL – TECHNICAL BUY CALL | Day TF | 22 August 2025 TOWL – TECHNICAL BUY CALL | Day TF | 22 August 2025
The stock previously spiked upward, marked a high of Rs. 208, pulled back, and is now ready to move upwards, pursuing various bullish targets.

PSX: Haleon - Weekly TF - Long positionContinuation pattern for Haleon
Long position.
Important note:
If the medicine prices are regulated by the government again, this could have -ve impact and hamper the continuation.

#CRTM #KSE - Possible buy setup.CRTM is showing strong bullish momentum. After a long accumulation phase, the stock broke structure by creating a higher high and is now possibly forming a new higher low.
Buy Levels:
Entry 1: 18.86
Entry 2: 17.19
Entry 3: 14.82
Stop Loss (SL): 11.80
Take Profit (TP):
TP1: 25.93
TP2: 32.58

MLCF – TECHNICAL BUY CALL | 24 AUG 2025 (5-MIN TF) MLCF – TECHNICAL BUY CALL | 24 AUG 2025 (5-MIN TF)
The stock traded in a range (marked with a light blue channel), broke out to Rs. 97.8, pulled back in a wedge pattern, and now appears ready to resume its upward move.

AKBL – TECHNICAL BUY CALL | 24 AUG 2025 (15-MIN TF)AKBL – TECHNICAL BUY CALL | 24 AUG 2025 (15-MIN TF)
The stock consolidated in an accumulation zone (marked with a light blue channel), broke out to Rs. 78.5, and then entered a pullback. The pullback now appears to be ending, and the stock looks set to resume its upward movement.

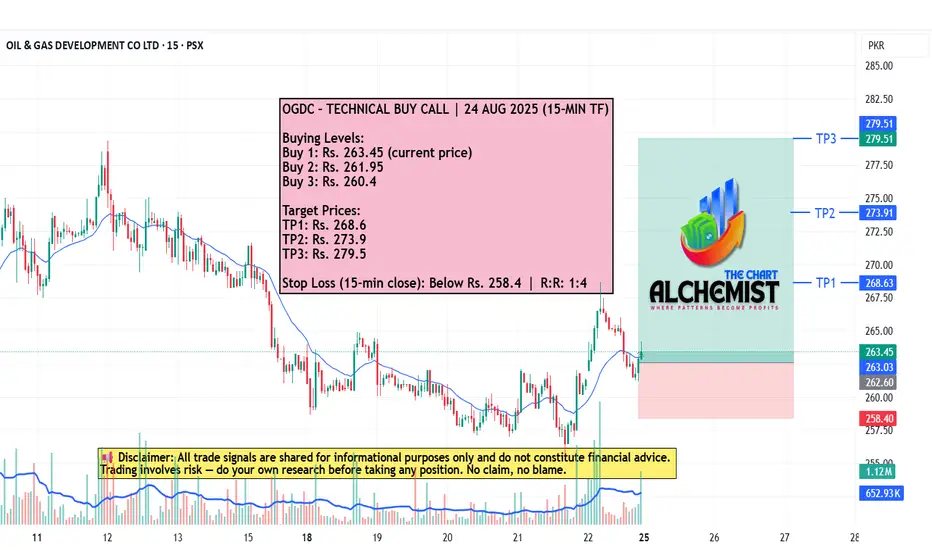
OGDC – TECHNICAL BUY CALL | 24 AUG 2025 (15-MIN TF) OGDC – TECHNICAL BUY CALL | 24 AUG 2025 (15-MIN TF)
The stock pulled back from a high of Rs. 279.4, and the pullback now seems to have completed within a bullish structure. Price action indicates readiness for an upward move.
Monthly Time FrameFibonacci Drawn from All Time High to Macro Bottom
All a significant Macro Price Levels and Targets.
Currently Price has been rejected by Fib 0.236 is providing Support
Fib 0.382 providing Resistance, rejecting the price twice currently.
QoQ and YoY Revenues and improved Profit After Tax will determine the trajectory of the stock price.

Rounded Bottom - Cup And Handle 3 years long Cup/Rounded Bottom and Handle
Measured Target shown by Orange Line

Potential Bullish Triangle Long Term Green Trendline to act as support
Resistance (Redline)
Potential Bullish Path drawn
Full measured Target represented by Orange Line

SEARL - Daily ChartSupport (Green Line)
Pivot (Yellow Line)
Resistance (Red Line)
Green Rectangle/Box is a very strong Bullish Order Block and Accumalation Zone.
Orange Line is the previous SnR Flip Zone. Retest Successful.
Currently price has entered into a Bullish Channel (Blue Diagonal Channel Lines)
Thick Diagonal Green Line is the Major Long Term Bullish Trendline

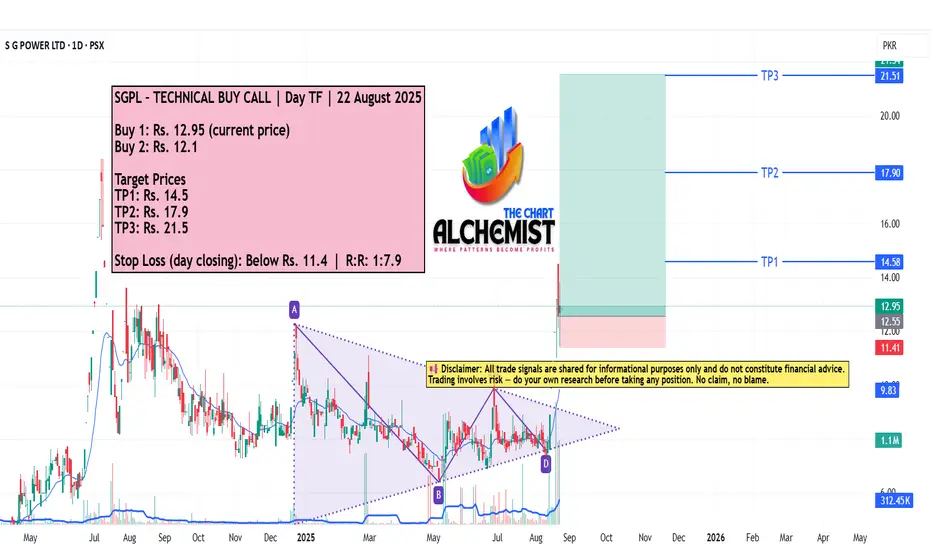
SGPL – TECHNICAL BUY CALL | Day TF | 22 August 2025 SGPL – TECHNICAL BUY CALL | Day TF | 22 August 2025
The stock broke out of an asymmetrical triangle, completed one leg of its uptrend, and marked a high of Rs. 14.58. It's now undergoing a shallow pullback, and we expect it to surpass its latest high and achieve multiple bullish targets.
HPL – TECHNICAL BUY CALL | Day TF | 22 August 2025 HPL – TECHNICAL BUY CALL | Day TF | 22 August 2025
The stock previously achieved multiple targets after a buy call. Recently, it formed four bullish structures, providing a safe entry point for a new buy.

BAPL – TECHNICAL BUY CALL | H TF | 22 August 2025BAPL – TECHNICAL BUY CALL | H TF | 22 August 2025
The stock previously achieved all targets, marked a high of Rs. 64, pulled back, and now seems to have ended its pullback at an AXIS Line (marked with solid blue line). It has reversed upward, creating a powerful bullish structure.

DLL – TECHNICAL BUY CALL | Day TF | 22 August 2025DLL – TECHNICAL BUY CALL | Day TF | 22 August 2025
The stock previously marked a high of Rs. 313, pulled back, and has now ended its pullback, resuming its uptrend. We expect the stock to continue its upward bullish trend and achieve multiple targets

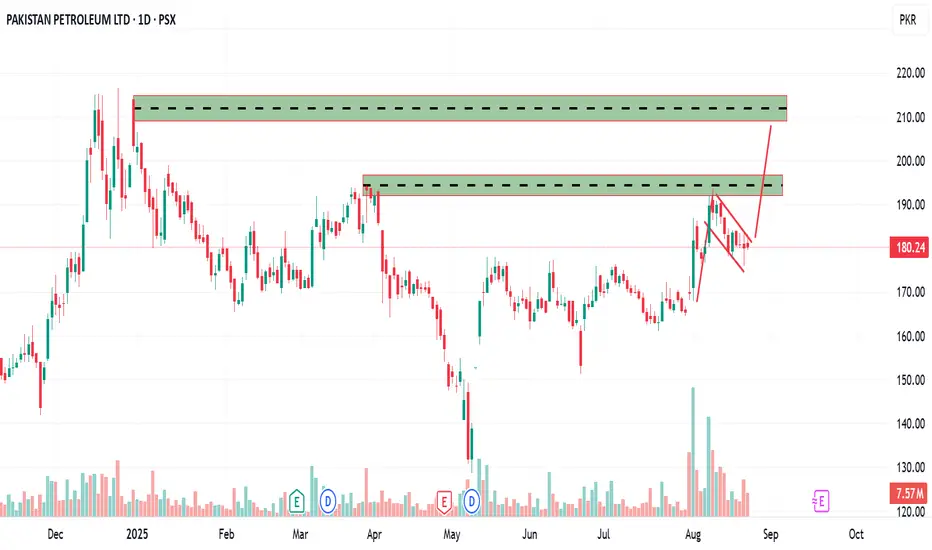
PPL✅ Trade Plan:
Entry: Above 182 – 184 confirmation (flag breakout).
Target 1: 190 – 192 (short-term resistance).
Target 2: 208 – 215 (medium-term resistance zone).
Stop Loss: Below 172 (to protect capital in case of breakdown).
Risk/Reward: Attractive, ~1:2 to 1:3 depending on entry/exit.
#PAKISTAN STATE OIL CO.LTD. (PSO) LOOKING FOR BREAKOUTTechnical Analysis: Pakistan State Oil Co. Ltd. (PSO)
Time Frame: Weekly
Trend: Bullish
Pattern: Bullish Flag
Technique Used: Trend Lines
🔎 Chart Structure
PSO is forming a Bullish Flag pattern, a continuation setup usually seen before the next leg higher.
Price has been consolidating inside converging trendlines after a sharp rally.
This indicates strong accumulation before a potential breakout.
📈 Trade Plan
Buy Stop: Rs. 431.29 → Enter on breakout confirmation.
Stop Loss: Rs. 345.89 → Below consolidation support.
Targets:
TP1: Rs. 519.02
TP2: Rs. 602.45
TP3: Rs. 715.92
🚀 Breakout Outlook
A confirmed weekly close above Rs. 431 would validate the bullish flag breakout.
Initial rally may target Rs. 519, followed by Rs. 602, with the long-term projection towards Rs. 715+.
Trendlines are guiding higher, supporting continuation of the bullish structure.
⚠️ Risk Considerations
Failure to hold above Rs. 345 would invalidate the flag setup.
Watch for false breakouts; confirmation with weekly candle close is key.
Market sentiment in energy and PSX performance will also influence momentum.
✅ Conclusion: PSO is coiling within a Bullish Flag on the weekly chart. A breakout above Rs. 431 could open the path toward Rs. 519, 602, and 715. Long-term momentum remains bullish as long as Rs. 345 holds.

#Aisha Steel Mills Ltd. (ASL) – PSX Monthly ChartTechnical Analysis: Aisha Steel Mills Ltd. (ASL)
Time Frame: Monthly
Analysis Focus: Time Cycle & Seasonality
🔎 Time Scale & Cyclic Behavior
Historical analysis shows that ASL tends to complete a full bullish cycle in ~1200–1400 days (3.5–4 years).
In the past:
Cycle 1: 1187 days to peak (~Rs. 28).
Cycle 2: 1400 days to next peak (~Rs. 28).
Current Cycle: Already 1300 days in progress, aligning with previous time cycles, suggesting another potential bullish run into 2026.
This time-cycle repetition indicates predictable bullish peaks every ~4 years.
🌦 Seasonality Importance
Seasonality analysis shows strong bullish months for ASL: July, August, September, November, December, and January.
These months historically aligned with upward momentum and price rallies.
With the current bullish reversal underway, the upcoming Nov–Jan 2026 window is critical for continuation towards cycle highs.
📈 Trade Plan
Trend: Bullish
Buy: Instant (current Rs. 13.60 zone still favorable)
Stop Loss (SL): Rs. 11.62
Take Profit Targets:
TP1: Rs. 17.91
TP2: Rs. 19.31
TP3: Rs. 22.11
TP4: Rs. 28.08 (historical top and cycle resistance)
📊 RSI & Momentum
RSI = 64.94, indicating bullish momentum with further upside potential before reaching overbought.
Past bullish reversals coincided with RSI crossing 60+, which aligns with the current breakout phase.
Strong momentum supports continuation towards higher cycle targets.
🚀 Projection & Expectation
Based on time cycles (~1300 days), ASL is entering its bullish window that typically ends with a peak around Rs. 28.
Combined with seasonal strength (Nov–Jan), the probability of continuation is strong.
Traders can look for daily & 4-hour chart confirmations to add positions while maintaining tight stop losses.
⚠️ Risk Notes
Failure to hold above 11.62 would invalidate the bullish outlook.
Macro factors in steel demand and PSX sentiment may accelerate or delay the cycle’s peak.
Patience is key — cycle completion typically spans 12–18 months after reversal begins.
✅ Conclusion:
ASL is respecting its long-term time cycle (~4 years) and has entered a new bullish phase. With seasonal tailwinds in late 2025 and early 2026, the probability of a rally towards Rs. 22–28 is high. This makes ASL a strong accumulation candidate for swing and positional traders, provided risk management is followed.
