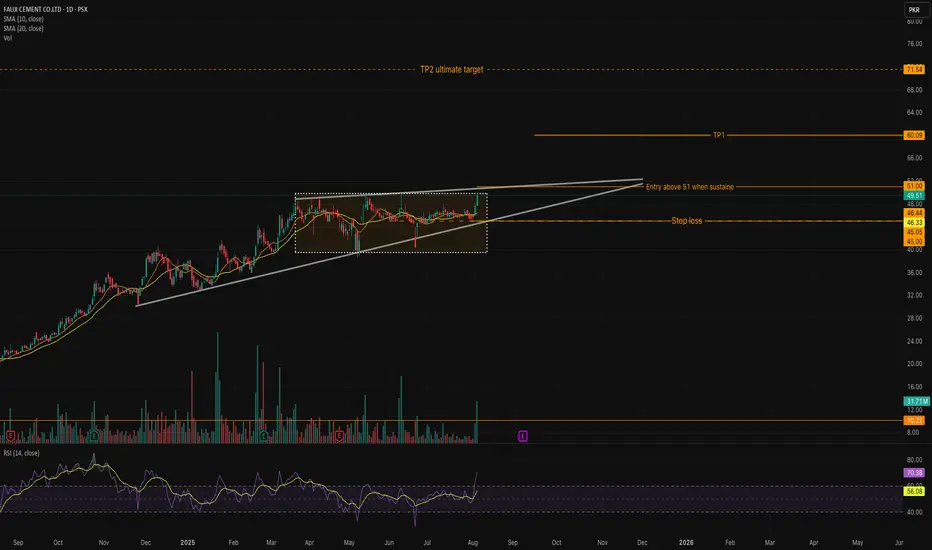
FCCL Breakout Watch: A Strong Setup Brewing!After months of consolidation within a well-defined ascending triangle, FCCL is showing signs of life again! The stock has just broken out of its horizontal range with a strong bullish candle and surge in volume – signaling momentum may be shifting upward. 💥
🔍 Key Highlights:
✅ Price has reclaimed the top of the consolidation range.
🔺 Breakout confirmation above 51 will be the ideal trigger for a long entry.
📊 Strong volume confirms buyer interest.
📈 RSI has crossed 70, indicating bullish momentum.
🎯 Targets:
TP1: 60.09 – First logical target post-breakout.
TP2: 71.54 – Ultimate target based on pattern projection.
🔐 Risk Management:
Stop Loss: Placed below the support zone at 45 to protect against false breakouts.
⚠️ Plan of Action:
Wait for a sustained move and close above 51 to confirm breakout strength before entering. Patience pays off in setups like these!
Near BreakoutBFBIO Analysis
CMP 164.75 (05-08-2025 03:24PM)
Near Breakout. However, important to
Cross & Sustain 170 for further upside.
It has the potential to touch atleast 190 - 200
initially.
In worst case, 146 - 165 is the Support Zone.

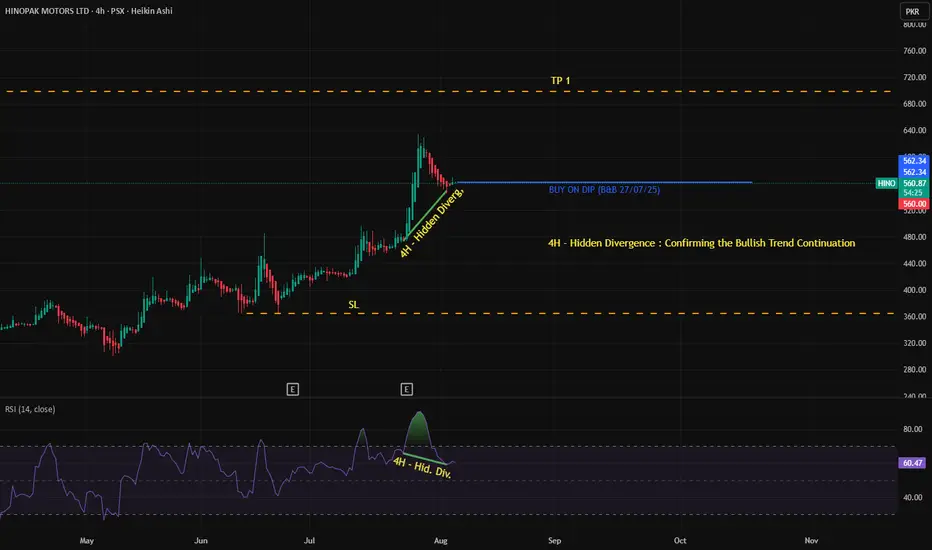
HINOPAK MOTORS LTD - (PSX) - Shows Hidden Bullish DivergenceThe 4H chart is showing a bullish hidden divergence where the price is making a higher low while RSI is making a lower low. This suggests a continuation of the uptrend after a healthy pullback. A 'Buy on Dip' zone has been marked near 561, with stop-loss (SL) significantly below at a strong support zone near 375. Confirmation of this hidden divergence strengthens the bullish bias.

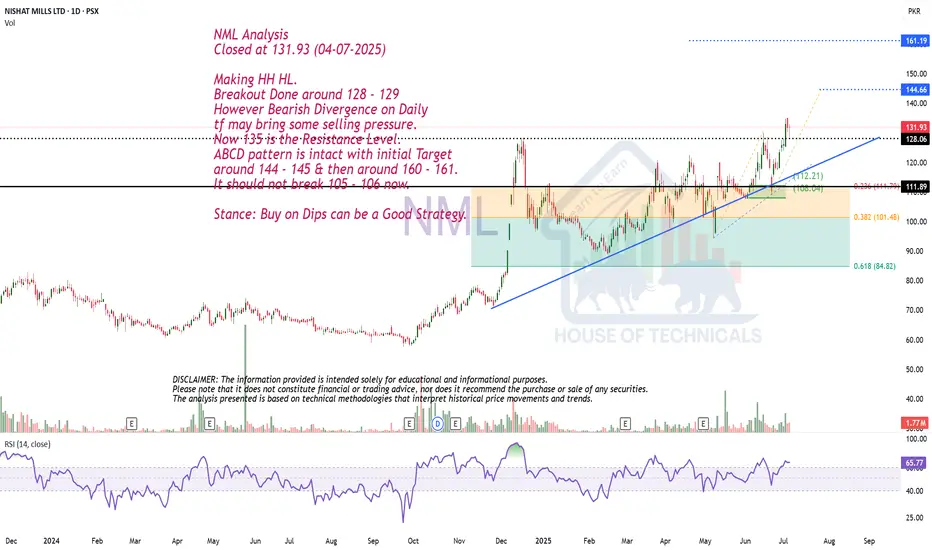
Making HH HL.NML Analysis
Closed at 131.93 (04-07-2025)
Making HH HL.
Breakout Done around 128 - 129
However Bearish Divergence on Daily
tf may bring some selling pressure.
Now 135 is the Resistance Level.
ABCD pattern is intact with initial Target
around 144 - 145 & then around 160 - 161.
It should not break 105 - 106 now.
Stance: Buy on Dips can be a Good Strategy.
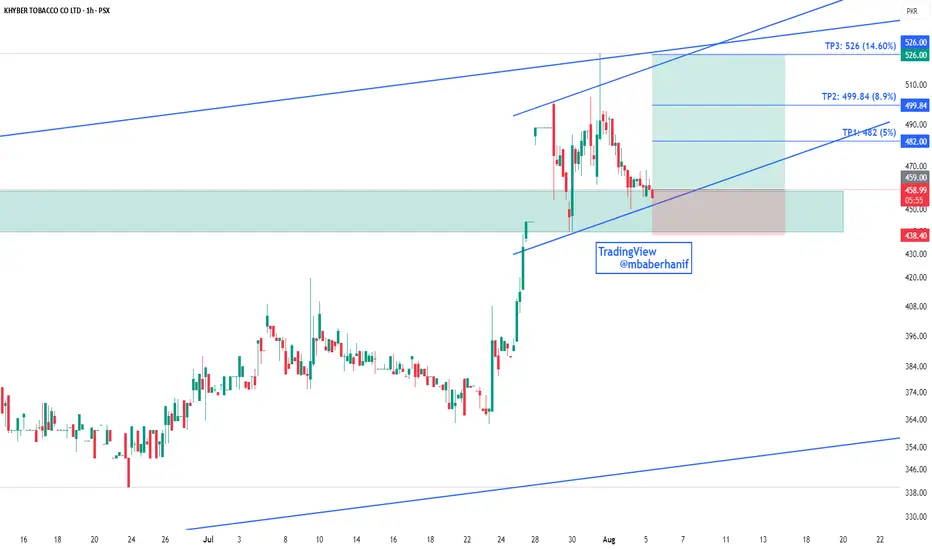
KHTC – Bullish Momentum BuildingKHTC on the 1-hour timeframe shows a healthy bullish structure, with the price currently retesting a previously broken resistance zone that has now turned into a strong support area. This retest aligns with the lower boundary of an ascending channel, increasing the probability of a bounce. The recent pullback appears corrective, and the setup offers a favorable risk-to-reward ratio with clearly defined targets. If the support holds, price can potentially rally towards TP1: 482 (+5%), followed by TP2: 499.84 (+8.9%), and an extended target of TP3: 526 (+14.6%). The structure suggests bullish continuation, making this an attractive opportunity for short-term traders.
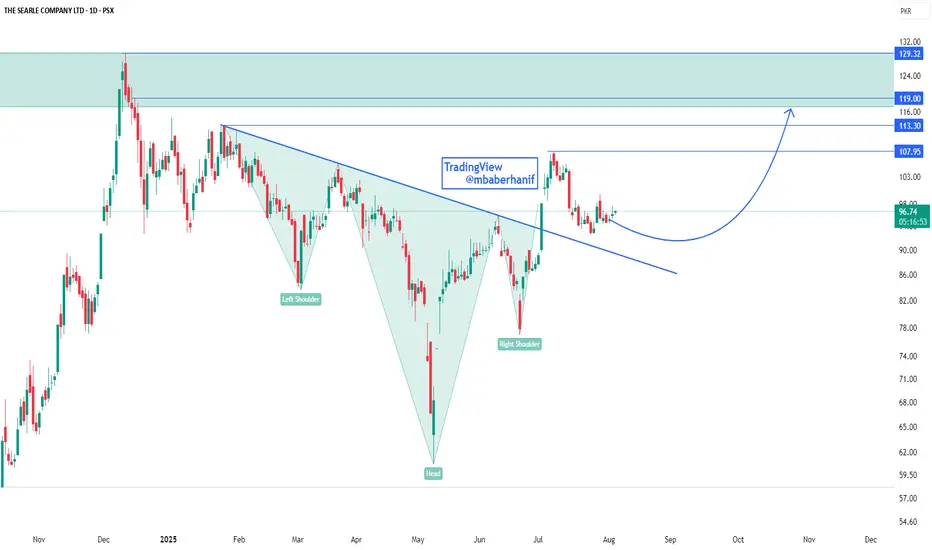
Trend Reversal Confirmed: SEARL Targets 129+SEARL on daily timeframe displays a classic inverse head and shoulders pattern, which is a strong bullish reversal signal. The stock has broken out of the neckline resistance with healthy momentum and is now consolidating above it, indicating strength and potential for a continued uptrend. The breakout also coincides with a falling trendline breach, adding further confirmation to the bullish sentiment. Key resistance levels to watch on the upside are 107.95, 113.30, and 119.00, with the ultimate supply zone target around 129.32. The curved projection suggests a gradual upward move, and any pullback toward the trendline may offer a good re-entry opportunity for long positions.
Packages StationsPackages broke its previous high of Dec 20' last month. Now the immediate resistance it will face is around 650 which is the trendline resistance.
Then it will face resistance at 680 (Fib 0.618 level of all-time high).
Then 730 - 750 (another trendline resistance).
Then around 800 (Fib 0.786 level of all-time high).
Once it surpasses all these, it may touch its previous all-time high.

Hidden Bullish Divergence on Bigger tf.IMAGE
Closed at 21.94 (27-05-2025)
Hidden Bullish Divergence on Bigger tf.
Monthly Closing above 20.70 will be a
positive sign.
Upside Targets can be around 26 - 26.50
On the flip side, 20.50 - 20.68 is a Good
Support zone and then around 19.
Should not break 17.30, otherwise we may
witness nd Reversal.

BOP PROBABLY IN WAVE ' 5 ' - LONGBOP is most probably in wave 5
If our wave count is correct then we are in wave 3 of 5 which has almost completed or will complete within this week, giving one more leg up before it starts to decline. Our buy zone is at 13 - 12 level (Ideally 12.65 - 12.50).
Incase price makes another leg up then it will target price level 14.70 - 15 level and should start declining toward our buy zone from there, if this happens than our target will be 17 level. On the other hand if price do not go above 14.36 and start declining directly then the 1st target from buy zone will be 14.70 & 2nd target will be 17.
Our preferred scenario suggests that price might go toward 14.70 and 15 level and then decline toward our buy zone, whatever the case maybe we are anticipating a sharp decline not a sideward consolidation.
Trade Setup:
Entry level: 12.65 - 12.50
Stop loss: 10.24
Target:
T1: 14.70 (if price decline directly)
T2: 17
Let see how this plays, Good Luck!
Disclaimer: The information presented in this wave analysis is intended solely for educational and informational purposes. It does not constitute financial or trading advice, nor should it be interpreted as a recommendation to buy or sell any securities.

NICLALL Time High Broke
Heavy buy back in this year
72% groth in revenu in 9 months as per comapanylast 3 quarters resluts.


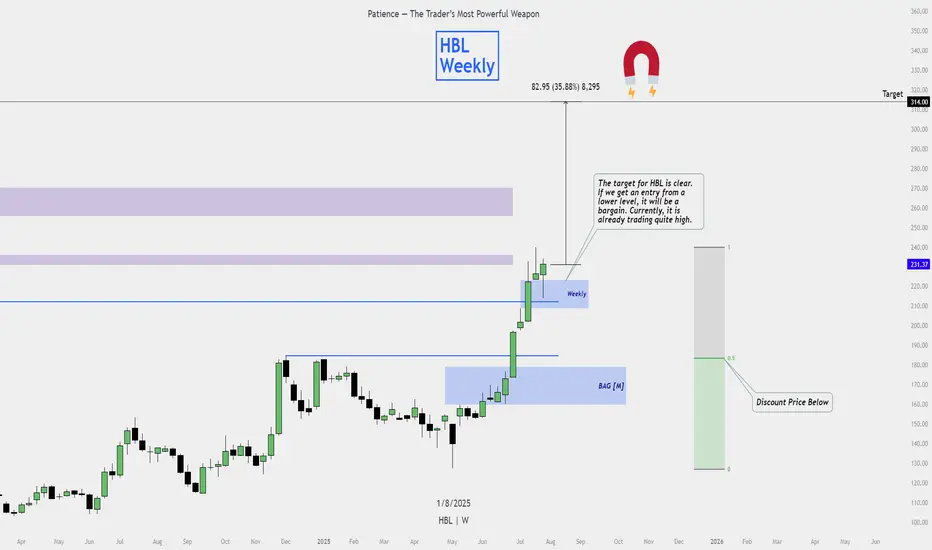
HBL Analysis – Smart Entry Matters📊 HBL Analysis – Smart Entry Matters
🎯 Target is Clear:
HBL has a well-defined upside target based on our analysis. The overall structure supports a bullish outlook.
💰 Cheap Entry is Key:
Ideally, we want to catch an entry from a lower price level to make it a cost-effective and high-probability trade — what we call a “sasta sauda”.
📈 Current Price Action:
However, HBL is already trading at elevated levels, so buying here could involve more risk and less reward. Waiting for a retracement or dip might offer a better risk-reward opportunity.
📌 Plan:
Patience is essential. Let price come to your zone — don’t chase. Focus on value and protect your capital.
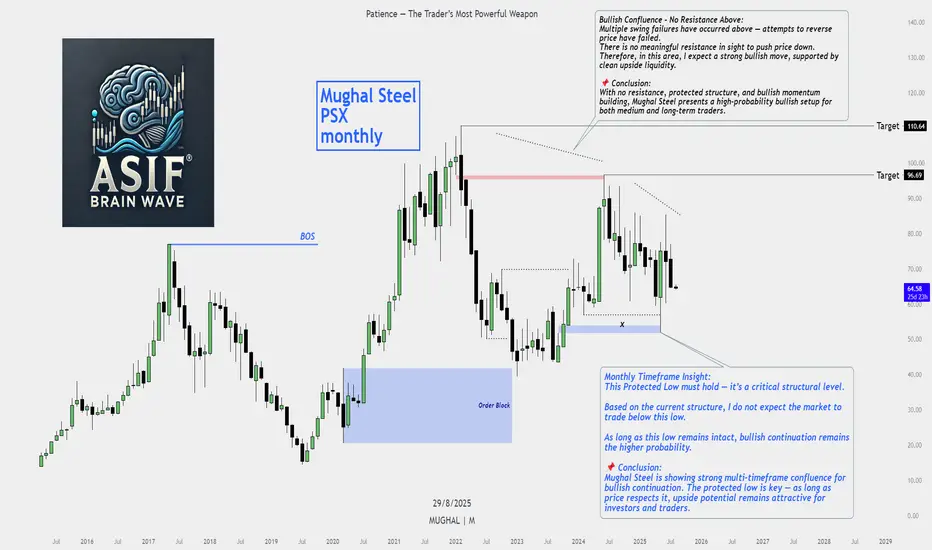
Mughal Steel – Multi-Timeframe Technical Analysis🔍 Mughal Steel – Multi-Timeframe Technical Analysis
I’ve been closely analyzing Mughal Steel, and the current structure across Yearly and Monthly timeframes is showing a strong bullish setup with significant upside potential. Here's a quick breakdown:
📅 Yearly Timeframe Insights:
Price has reacted from a Yearly Bullish Fair Value Gap (FVG) — a key zone where institutional buying often occurs.
A Protected Swing Low is now in place. Based on the structure, I do not expect price to trade below this low.
2023 swept 2022’s low, but closed inside the FVG, suggesting accumulation by smart money.
2024 closed above 2023’s high, confirming a bullish shift.
2025 has swept 2024’s low and is now aggressively moving toward upside liquidity.
Upside Target: 2024 high at 96.69, which would represent a potential 48% move from current levels.
📆 Monthly Timeframe Confirmation:
The protected low must hold — it serves as a critical level for bullish continuation.
I believe price will not revisit this low due to strong structural support.
We’ve seen multiple failed attempts by sellers (swing failures) above — indicating weakening bearish pressure.
No significant resistance exists above, clearing the path for a strong bullish move.
📈 Conclusion:
With no resistance overhead, a protected structure, and bullish momentum building, Mughal Steel is presenting a high-probability opportunity for upside expansion. I'm watching closely as price targets 96.69 in the coming months.
#TechnicalAnalysis #MughalSteel #StockMarket #TradingInsights #PriceAction #Investing #PakistanStockExchange
PPL Share buying StrategyPPL share Buying Strategy
PPL Showing us buying momentum with volume end a bearish trend.
Buying around 181- 174
Stop loss 160
Target 190
Target 213
Is sustain above 213 theb Use trailing stop loss to minimise your risk

SLGL – BUY SIGNAL (REVISIT) | 03 AUGUST 2025SLGL – BUY SIGNAL (REVISIT) | 03 AUGUST 2025
Our previous call on SLGL remains valid. The stock had been consolidating within a light blue channel and entered a pullback in a bearish channel (light pink) after hitting a high of Rs. 18.40. It has now broken out of this bearish channel, signaling renewed strength. This revisit setup offers a fresh opportunity for entry with clearly defined targets and strong risk-to-reward potential.


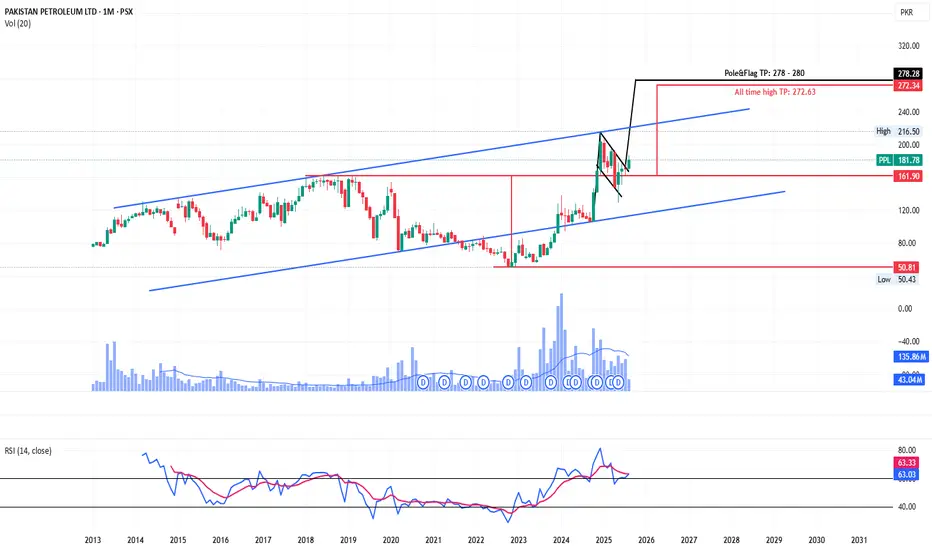
Monthly Breakout.PPL Analysis
Closed at 181.78 (01-08-2025)
Monthly Breakout.
Extremely Bullish; potential to touch 240+
However, it should not break 128 now.
174 - 175 & then 165 - 167 seems to be a
Good Support level.

Beautiful Monthly Closing.SNGP Analysis
Closed at 123.46 (01-08-2025)
Beautiful Monthly Closing.
However, immediate Resistance is
around 130 - 131.
Crossing & Sustaining this level with
Good Volumes may result in upside
move targeting 145 - 150 & then around 190.
It should not Break 105, otherwise we may
witness further selling pressure.

PSX: Systems Limited IdeaTrade Plan for Systems Ltd (SYS) — Monthly Chart
✅ Trade Type: Swing Trade (Position trade with multiple months’ holding horizon)
⚙️ Technical Setup Summary:
Price is in a bullish breakout structure after testing key Fibonacci levels.
Break above 0.618 Fibonacci retracement (128.55 PKR) confirms bullish momentum.
Price currently retesting the 0.786 Fib level (138.34 PKR).
Clear trendline support.
Bullish price action and increasing volume confirm accumulation.
🔸 Entry Plan
Entry Zone: Between 128.50 – 133.50 PKR
Ideal scenario: Entry on a bullish reversal from the purple support box (~128.50 area), near the 0.618 Fib level.
Alternatively: Add partially now, and scale into position if the price dips toward support.
🛑 Stop Loss (SL)
SL Level: 121.60 PKR
Below the recent support structure and 0.5 Fib retracement level.
Protects against trend reversal and false breakout.
Tight but logical based on structure.
🎯 Take Profit (TP) Targets
TP1: 150.80 PKR (1.0 Fibonacci Extension)
TP2: 170.00 PKR (1.414 - 1.618 Fib Extension Zone)
⚖️ Risk-to-Reward Ratio (RRR)
RR: ~1:3
SL = ~12 PKR
TP1 = ~17 PKR gain
TP2 = ~37 PKR gain
🔍 Trade Justification
Price action broke key resistance near 128.50 with volume.
Monthly candle structure shows strength; previous resistance now acting as support.
Long-term trendline intact.
Fibonacci cluster and historical price action align for confluence.
Positive momentum with potential continuation toward TP2.
🧠 Trade Management
Partial Profit: Take 50% at TP1, trail SL to break-even.
Trail Remainder: Use monthly candle lows or 20 EMA as dynamic trailing stop.
Re-evaluation: If price consolidates between 138–145 for several weeks, reassess risk and possible breakout re-entry.
🗓️ Time Horizon
Expected Holding Period: 2 to 6 months
Review price action on weekly closes for confirmation or exit signs.
