Eurasia Mining: A Strategic Opportunity in Precious MetalsExpanding Market Presence with Dual Listing
Eurasia Mining PLC (LON:EUA), a London-based mining company, has established itself in the exploration and production of platinum group metals (PGMs) and gold, recently expanding its reach through a dual listing on the Astana International Exchange (AIX) in Kazakhstan. The accomplishment was achieved in this year's July, builds on its long-standing presence on the London Stock Exchange's Alternative Investment Market (AIM), where it has been listed since 1996. The AIX listing, finalized with the appointment of SQIF Capital as market maker, enhances liquidity and broadens access, particularly in emerging markets. With no new shares issued, the shares remain fully fungible between London and AIX, ensuring seamless trading. Eurasia is capitalizing on growing global demand for critical minerals, driven by automotive and renewable energy sectors.
Diversified Portfolio of Critical Metals
The company’s asset portfolio centers on PGMs - iridium, osmium, palladium OANDA:XPDUSD , platinum OANDA:XPTUSD , rhodium LSE:XRH0 , and ruthenium—alongside gold TVC:GOLD , copper CAPITALCOM:COPPER , and nickel $CAPITALCOM:NICKEL. These metals are integral to technologies like catalytic converters and hydrogen fuel cells, which benefit from tightening emissions regulations and the expanding hydrogen economy. Eurasia’s operations emphasize cost efficiency, with open-pit mining techniques that reduce expenses compared to traditional underground methods. For instance, production costs at its key sites are among the lowest in the PGM sector, approximately $300 per ounce, due to streamlined processes that avoid costly drilling and blasting.
Key Projects Driving Growth
One notable project in Eurasia’s portfolio - the Tylai-Kosvinskoye deposit. It’s one of the world’s largest alluvial PGM and gold reserves. With over 11 tons of PGMs and gold currently estimated, and total resources exceeding 20 tons under JORC standards, this group of 12 assets has seen substantial progress. In 2025, five of these sites entered commercial production, supported by five operational processing plants, with a sixth slated for launch in the second half of the year. Eurasia is capable of scaling up its operations, backed by existing infrastructure such as roads, power lines, and maintenance facilities, which minimizes the need for large-scale capital investment.
Advancing the "Monchetundra" Project
Another crucial component is the so called "Monchetundra" project, a cluster of licenses hosting approximately 60 tons of PGMs and gold, plus 258,000 tons of copper and 390,000 tons of nickel. A contract with Sinosteel for a turnkey processing plant, expected to be completed within two years, also signals further growth potential. These metals are critical for electric vehicle batteries and renewable energy applications, align with global trends toward decarbonization. Eurasia’s diversified portfolio, spanning PGMs, gold, and battery metals, positions it to benefit from both traditional and emerging demand drivers.
Strong Financial and Institutional Support
The company’s financial strategy supports its operational ambitions. In March 2025, Eurasia raised £3.2 million through a private placement of 72 million shares to U.S. and U.K. institutional investors at 4.37 pence per share, reinforcing its capital base. Institutional ownership now accounts for 58% of Eurasia’s shares, a signal of confidence from major investors like BlackRock, often viewed as a marker of asset reliability. The funds are earmarked for maintaining the London listing and supporting the AIX launch, enhancing marketability without diluting existing shareholders. As of August, Eurasia’s market capitalization stands at approximately £140 million, with 80.51% of its stock in free float, reflecting strong liquidity.
Experienced Management and Strategic Partnerships
Eurasia’s management team brings extensive experience in mining, with a track record of advancing projects from exploration to production. Strategic partnerships, such as with Sinosteel, and government-backed incentives like tax breaks and loan subsidies, strengthens the company’s outlook. For example, the Monchetundra project has already received 70% of its required capital investment, reducing future funding needs and accelerating development timelines.
Navigating Market Opportunities and Risks
Market dynamics further enhance Eurasia’s appeal. The PGM market is buoyed by robust demand, particularly for palladium and platinum in automotive catalytic converters and hydrogen technologies. Gold prices, a key component of Eurasia’s portfolio, continue their upward trajectory. Analysts project Eurasia’s share price could range from £0.03 to £0.06 in 2025, potentially reaching £0.08 to £0.15 by 2030, driven by production growth and market trends. However, risks remain. Including commodity price volatility, potential technological shifts reducing PGM demand, and the need for additional financing, which could lead to dilution.
Positioning for Global Investor Access
Eurasia’s dual listing on AIX opens access to a broader investor base, particularly in Central Asia and the Global South, where interest in critical minerals is rising. The company's focus on transparency, backed up by regular updates and resource estimates in line with JORC, should strengthen investor trust. Investors are advised to conduct thorough research, considering both the growth potential and inherent risks of the mining sector, as Eurasia continues to develop its assets and navigate global market trends.

Marks & Spencer: A Rocky Start to Fiscal 2026Despite a strong start to the year, Marks & Spencer’s momentum has been overshadowed by a major cyberattack, disrupting online operations from April through July. While their reshaping strategy continues to deliver gains in volume, market share, and profitability, the breach is expected to dent fiscal 2026 operating profit by ~£300M.
An analyst warns of short-term reputational damage, and shares are down ~12% YTD.
📊 Technical View:
The price remains under pressure. A weekly close below 319.20 (Jan low) would complete a sizeable double top, with a potential 100-point downside target. The 200-week moving average at 239 is our initial target.
Upside resistance? The 55-week moving average at 359. Unless that’s cleared, pressure likely remains.
Disclaimer:
The information posted on Trading View is for informative purposes and is not intended to constitute advice in any form, including but not limited to investment, accounting, tax, legal or regulatory advice. The information therefore has no regard to the specific investment objectives, financial situation or particular needs of any specific recipient. Opinions expressed are our current opinions as of the date appearing on Trading View only. All illustrations, forecasts or hypothetical data are for illustrative purposes only. The Society of Technical Analysts Ltd does not make representation that the information provided is appropriate for use in all jurisdictions or by all Investors or other potential Investors. Parties are therefore responsible for compliance with applicable local laws and regulations. The Society of Technical Analysts will not be held liable for any loss or damage resulting directly or indirectly from the use of any information on this site.

British Banks Dodge a Legal BulletBritish Banks Dodge a Legal Bullet, but Still Face Billion-Pound Costs
Ion Jauregui – Analyst at ActivTrades
The UK Supreme Court relieves financial institutions from paying up to £44 billion over the car finance scandal. The FCA is preparing compensation plans that could cost up to £18 billion.
British banks have narrowly avoided a legal blow that threatened one of the largest payouts in their recent history. The UK Supreme Court ruled against applying broad compensations for inflated commissions on car finance agreements—a case that could have cost the sector up to £44 billion.
The decision was met with relief by the market. Shares of Close Brothers Group, Lloyds Banking Group, Barclays, and Bank of Ireland, all with direct or indirect exposure to auto loans, posted significant gains following the verdict.
However, the legal outcome does not mark the end of the matter. The Financial Conduct Authority (FCA) has announced it is working on a more limited compensation plan, which could result in payouts between £9 billion and £18 billion. Lloyds, one of the most affected entities, currently holds a provision of £1.2 billion, which its management believes will not need to be significantly increased.
Moody’s has rated the situation as credit negative for the UK banking sector, warning that despite the favorable ruling, regulatory and reputational risks remain.
Fundamental Analysis of Lloyds
Lloyds Banking Group (LSE: LLOY) remains a cornerstone of the UK financial system. Backed by strong capital ratios and a diversified portfolio, the bank has managed to weather regulatory and macroeconomic challenges in the post-Brexit, inflationary environment.
In its latest quarterly report, Lloyds posted a net profit of £1.63 billion, beating market expectations. The bank reported a ROTE of 15.3% and a CET1 ratio of 13.9%, providing a solid buffer to absorb potential future shocks. Additionally, the board announced an interim dividend of 0.92 pence per share, underscoring its commitment to shareholder returns despite ongoing uncertainties.
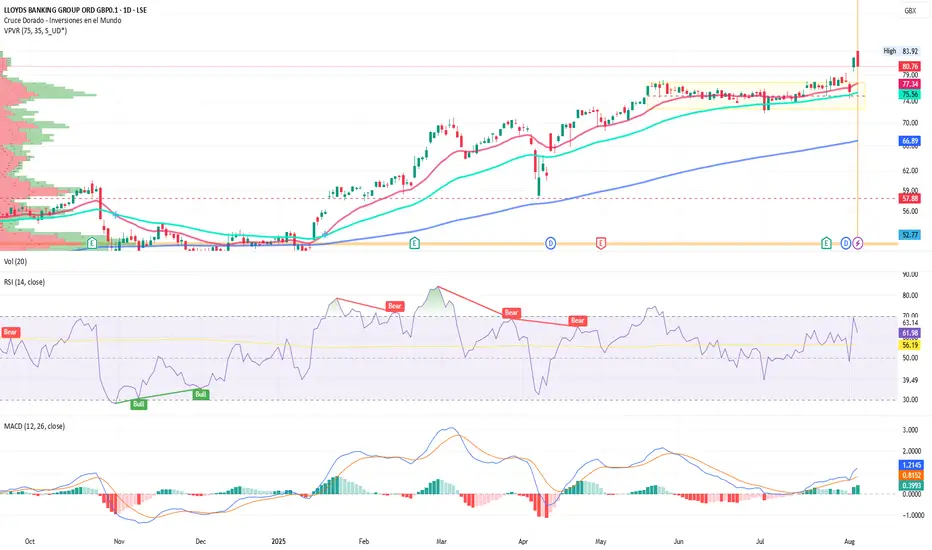
Technical Analysis of Lloyds (LSE: LLOY)
Lloyds has shown remarkable technical momentum so far this fiscal year. After hitting lows of £49.93 in January and forming a base that led to a golden cross of moving averages, the stock experienced a temporary dip to £57.88 following the announcement of new US tariffs.
Since then, the share price has advanced steadily, recently touching a new all-time high of £83.92 after forming a clear accumulation zone between May and July. This week, the stock decisively broke out of that range, entering what appears to be a potential “blue-sky” scenario, with no defined resistance levels above.
The move is supported by a bullish MACD crossover and increased trading volume, signaling momentum strength.
On the other hand, the RSI, currently at 61.98, indicates a slight moderation in the trend, especially after Tuesday's bearish candle, which could hint at a short-term correction toward the point of control (POC) at £75.20.
Key Indicators:
• MACD: Expanding, confirming strong upward momentum.
• RSI: At 61.98, suggesting moderate overbought conditions and possible pullback.
• Moving averages: Diverging, reinforcing the bullish trend structure.
Levels to Watch:
• Support: £77.50 – a break below this level could trigger a return to the accumulation zone.
• Resistance: With no clear ceiling in place, a continuation of the current breakout could see the stock approach the £90 mark.
In summary, while a short-term pullback is possible if regulatory pressure intensifies, Lloyds' technical outlook remains firmly bullish, supported by growing volume and strong momentum signals.
Dodging the Bullet
The Supreme Court ruling provides short-term relief for the UK banking sector, but the financial impact of the car finance scandal remains unresolved. As the FCA outlines its compensation plan, Lloyds stands out for its solid fundamentals and bullish technical setup—albeit with room for short-term corrections. The UK banking industry, although momentarily having dodged a bullet, still faces unresolved regulatory challenges and market scrutiny. The case has reignited the debate around sales practices in the UK auto finance market, a segment that until recently had avoided the level of oversight applied to other financial products.
*******************************************************************************************
The information provided does not constitute investment research. The material has not been prepared in accordance with the legal requirements designed to promote the independence of investment research and such should be considered a marketing communication.
All information has been prepared by ActivTrades ("AT"). The information does not contain a record of AT's prices, or an offer of or solicitation for a transaction in any financial instrument. No representation or warranty is given as to the accuracy or completeness of this information.
Any material provided does not have regard to the specific investment objective and financial situation of any person who may receive it. Past performance and forecasting are not a synonym of a reliable indicator of future performance. AT provides an execution-only service. Consequently, any person acting on the information provided does so at their own risk. Political risk is unpredictable. Central bank actions can vary. Platform tools do not guarantee success.
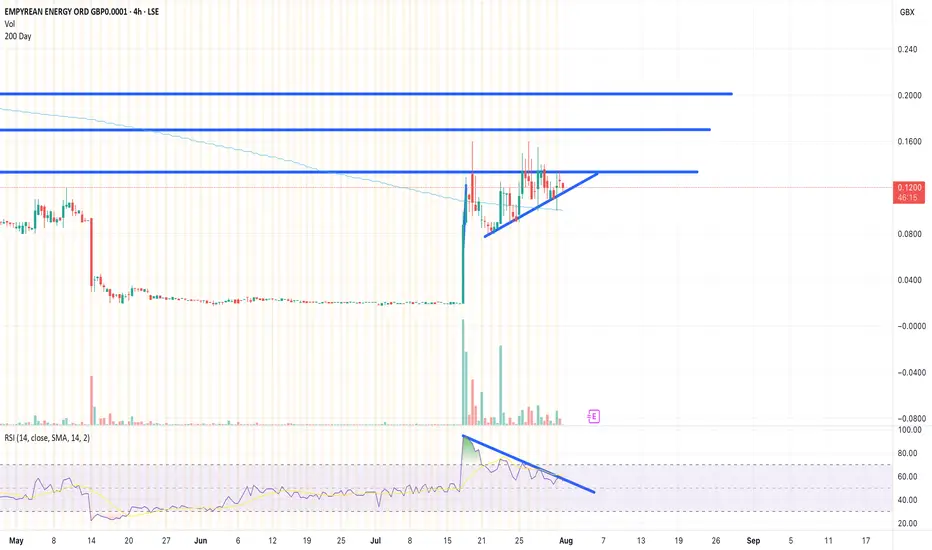
Strong Buy EME Targets Targets for EME over the next 2 weeks. Once a candle closes above the top line of the ascending triangle, it will start moving north... Fast
ATG forming a right shoulder?Is this a textbook H&S pattern being formed? 643 is break out/neck line and 912 is the target. Looks like it and reversal will be know by September to November 2025.
This is not a solicitation to trade in ATG shares.

Breakout on Vodafone?Looks like a Head and shoulders reversal, plus breakout this week. Too early to say though as it still needs confirmation. Could still be a fake-out?
This is not a solicitation to trade in Vodafone shares.

Short WISE as leading diagonal has been completedWISE can be shorted with the first target at the lower edge of the diagonal and then, at around 800 pence (start of wave 5), if move lower confirmed.
Clear RSI divergence shows trend reversal in the short-term at least (until touching lower band of the diagonal). So the lowest upside is around 14-16% here.
SL can be set to 1230 pence.

POWER METALHello guys, good ?
POW idea.
Large bullflag breakout. For safe enter, you need to wait monthly candle close.
This stabilisation is very very a good sign.
Levels are clean now.
RSI breakout too.
Good luck :)


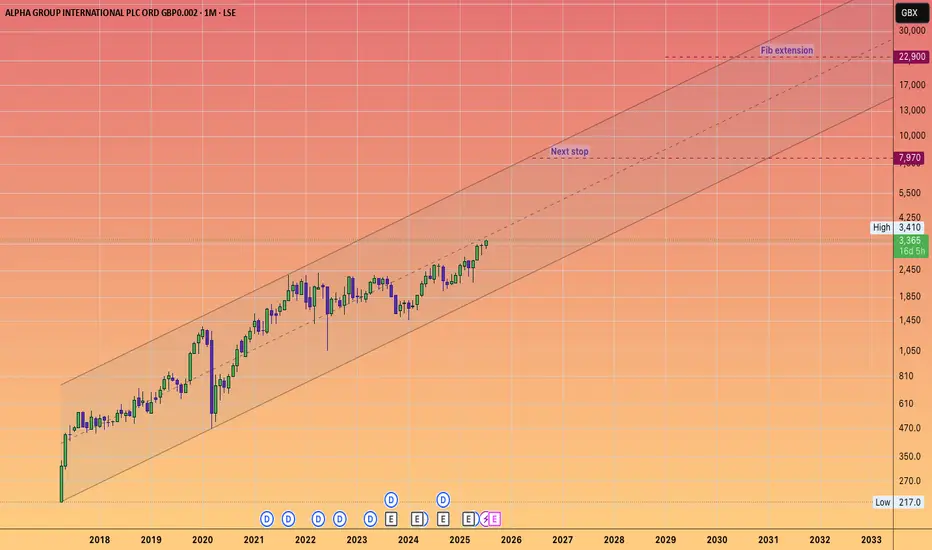
ALPHA GROUP INTERNATIONAL will keep its momentum going!#ALPHA is a fintech company that offers currency risk management and payment solutions.
With a price-to-earnings ratio of approximately 12,
it signifies a solid investment for a growth-oriented fintech firm that is increasing its earnings by about 20 to 25% annually.
In light of the #UKX breaking through and reaching new highs, and beginning to accelerate towards my long-standing projections that the FTSE would hit 5 figures, ALPHA appears to be a unique opportunity in the UK markets, which, as we know, are relatively sparse compared to the USA.
Given the inability to purchase shares of #Revolut, it is likely that capital will flow into this ticker.
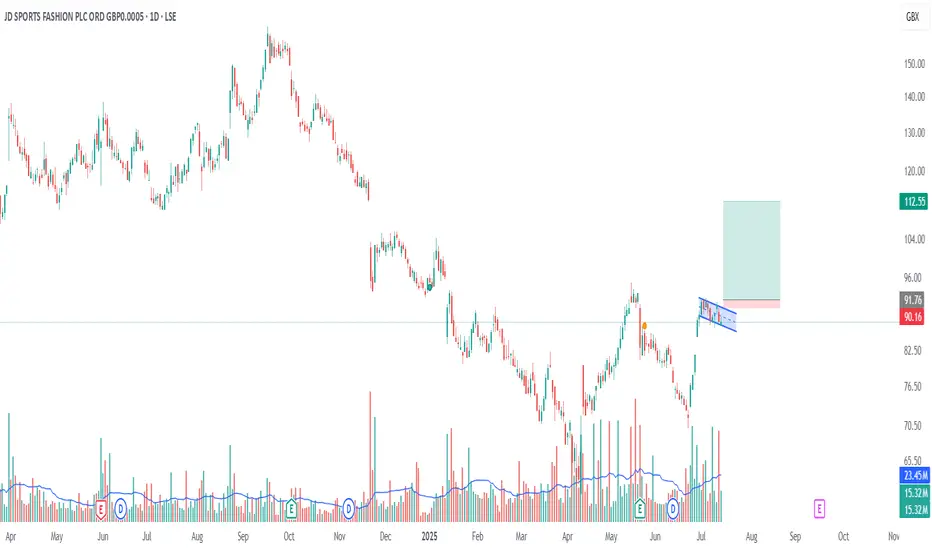
Bull Flag Formation on the Daily ChartA bull flag pattern is forming on the 1-day chart, supported by a steady increase in volume—suggesting growing bullish momentum.
Flagpole base: ~72
Potential breakout level: ~92
First price target (PT1): ~100 (next key resistance level)
Measured move target (PT2): ~112 (based on flagpole height)
This setup indicates a strong potential for continuation if price breaks above the 92 level with volume confirmation.
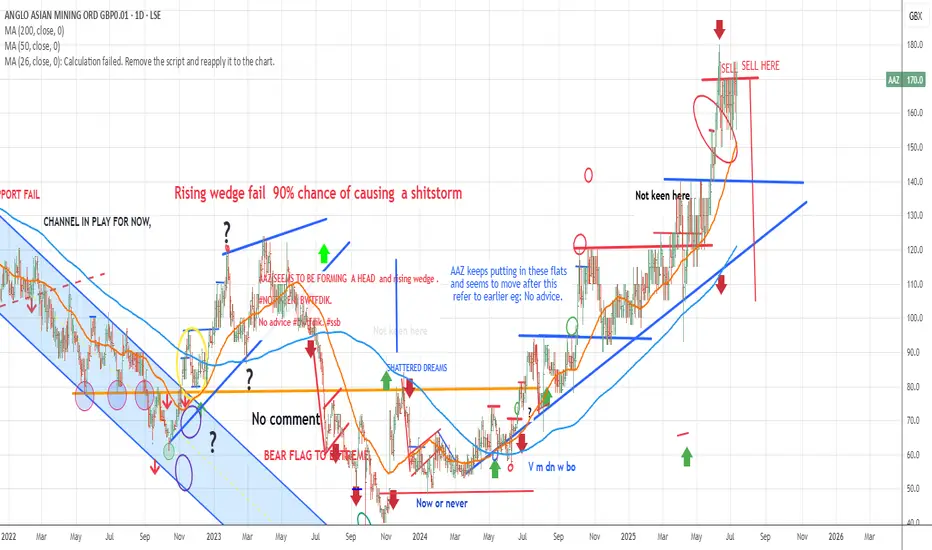
"AAZ" SHORT AAZ have really won on the no liquid play.
Chart is very top heavy and the location worries my investors.
BWTFDIK
SSB
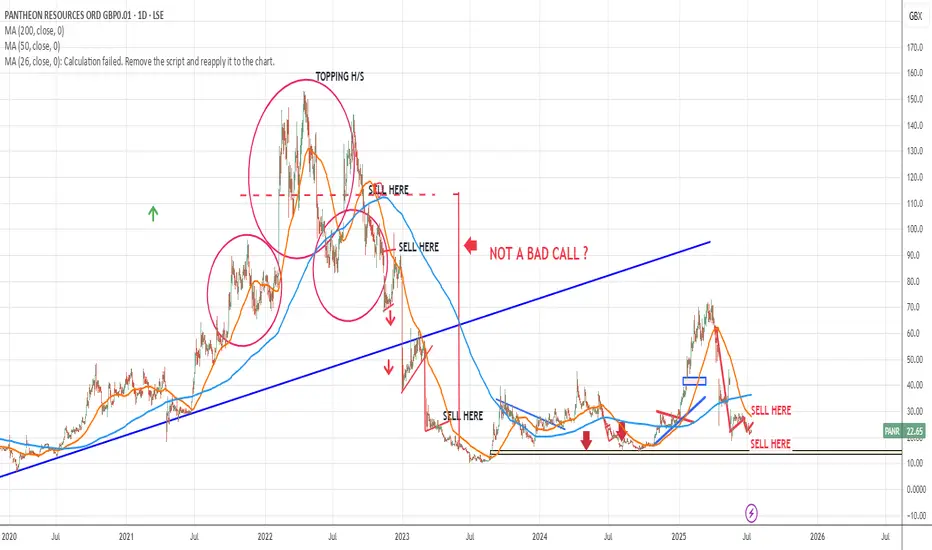
"PANR" shortI gave a sell signal around November 2022.
Look back..
No way this is a real share,,
BWTFDIK
SSB
Once every 2 years Opportunity!The price has been respecting a bullish weekly trendline since 2013. On average, the price was touching and rejecting the trendline every 2.2 years since 2013. Following rejection it took the stock approx 1.75 years to reach an averaged gain of 160%. Now we are at that opportunity again and there's high potential for a rejection and continuation. In the next 1.5 years it's highly probable to reach a conservative gain of 70% from where the stock currently sits at.

Silver Bear together with equity crash (SPX/NDX/DAX)Ride the wave down on your surf board. Fresnille will kneel a 20 % where tech firms might go down 40-50% (e.g. Apple)


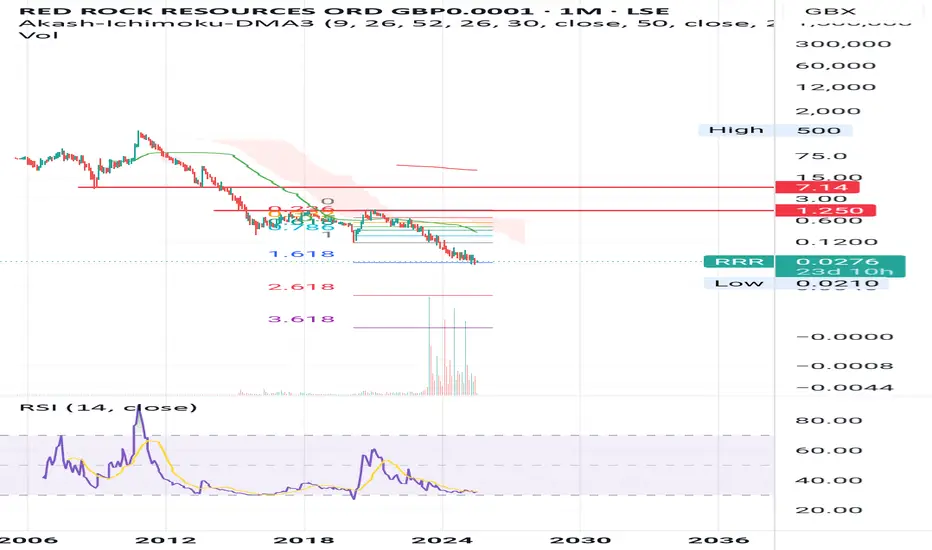
RRR potential reversal point TA view only
I haven't checked their statements or current position
Not financial advice
#FTC Filtronic. UK stock exchange Interesting point in timeI don't hold but Filtronic is an expanding company in RF (Radio Frequency) Innovation and Engineering.
Its price has increased eleven times over last two years!👍
Now it has fallen out of the rising orange channel for the first time in 2mths BUT is forming nice blue continuation flag.
Which will win? We'll have to wait and see. Key pure ion nit.
PDYOR

ARB update Deadly news.
But I will buy like £100 of ARB at approx 0.3 as I believe they will pull out once Bitcoin starts moving further.
Not financial advice

Head and Shoulders Pattern on the 1H and Daily TimeframesKey Observations:
1. **Bullish Gartley Pattern on the 2-Day Timeframe**
- This is a strong reversal pattern, indicating potential upside.
2. **Head and Shoulders Pattern on the 1H and Daily Timeframes**
- The **inverted head and shoulders** suggests a bullish breakout, especially after a long consolidation phase.
3. **Consolidation for Almost 3 Years**
- If this consolidation is ending, a breakout could be significant.
4. **Indicators Showing Bullish Divergence**
- **MACD turning up**
- **RSI divergence (lower price, higher RSI)**
### Potential Upside Target: **178 GBX**
- If the reversal plays out, your projection to **178 GBX** is possible.
However, keep an eye on key resistance levels like **116.4**, **127.3**, and **151.5**. If price struggles at these levels, short-term retracements might occur before a full breakout.
As of June 2024, Alphawave IP Group plc (LON:AWE) reported the following financial figures:
- **Debt-to-Equity Ratio**: 49.6%, with total debt of US$217.9 million and total equity of US$439.2 million. citeturn0search0
- **Cash and Cash Equivalents**: US$76.3 million. citeturn0search0
Additionally, the company's total assets were US$873.0 million, and total liabilities amounted to US$433.8 million. citeturn0search0
These figures indicate that Alphawave IP Group has a moderate level of debt relative to its equity and maintains a cash position that contributes to its financial flexibility.
⚠ **Not Financial Advice** – Always manage risk and confirm signals before trading.

RECORD long!The fundamentals are attractive, and price is testing key monthly horizontal support. Seems like a good opportunity.
LSE:REC
