$CRWD double top off W into overbought, $400 pullbackNASDAQ:CRWD on watch for put swing. We have a possible double top off accelerated upswing momentum. Expecting a pullback into the 50 and 20 EMAs.
WSL

HOOD – Inverse Head & Shoulders + Ichimoku Cloud BreakoutRobinhood (HOOD) has broken out of a strong inverse head and shoulders pattern and cleared the Ichimoku Cloud, confirming a bullish trend shift. Both price structure and trend indicators support continuation.
Trade Setup:
Entry: $52.50
Stop Loss: $49
Target: $80
Risk–Reward: ~1:7.8
With volume picking up and bullish technical confluence, this breakout could trigger a move toward the $80 level — a major psychological and structural target.
#HOOD #IchimokuBreakout #InverseHeadAndShoulders #TrendReversal #BullishMomentum #SwingTrade NASDAQ:HOOD

Azul Brazilian Airlines S.A Stock completed falling wedge pattern ( ending diagonal ) ... it is near target price after breaking up Resistance level 0.7720 , is between 0.9000 $ - 1.000 $ , Today or Tomorrow is proposed to reach it .
Stock for Buy NOT for Sell.

QBTS worked s plannedI was publishing my portfolio review, where IONQ and QBTS were listed.
Today QBTS made +26,71% in 1 day.
The best is yet to come.

AKAM heads up at $84: Major Resistance should cause a Dip AKAM recovering nicely but just hit a resistance at $83.76-84.25
Second attempt to break, see if it gets above and Retest for buy.
If we get a dip bulls need to hold the Golden Covid fib at $81.88.

NVDA Trade Setup Eyeing the Bounce After the PullbackNVIDIA (NVDA) is currently trading around $117.06, pulling back from its recent highs of $153.13. With volatility kicking in and macro pressure (including renewed tariff talk from the Trump camp), NVDA is setting up for what could be a powerful rebound opportunity.
Here’s how I’m looking at it:
📥 Buy Zones (Scaling In):
$104 – Technical support zone where buyers may start stepping in.
$95 – Key psychological and chart-based support.
$90–$80 – Deep correction zone for high-conviction entries.
🎯 Profit Targets:
TP1: $125 – Strong short-term resistance.
TP2: $145 – Reclaiming mid-term momentum.
TP3: $153+ – All-time high retest if sentiment recovers.
💡 Why It Matters:
NVIDIA’s fundamentals are on fire: strong revenue, record margins, and leadership in AI and data center growth. Add in $25B+ in cash and minimal debt, and you've got a long-term juggernaut. Yes, it's volatile. Yes, it's overvalued on paper. But growth like this doesn’t come cheap.
📊 Risk Management:
Always use stops—especially in this kind of market. I’m keeping an eye on $90 as a make-or-break level and adjusting sizing to weather volatility.
Disclaimer: This is not financial advice. All trading involves risk. Do your own research or speak to a licensed financial advisor before making any financial decisions.

Pull Back is RequiredAMZN Sell Setup - GETTEX:AMZ
Bearish Momentum on Daily Chart
Instrument: AMZN
Timeframe: Daily
Direction: Sell
Confidence: 75%
Setup Overview:
AMZN is showing bearish signals after a recent pullback. MACD has a bearish crossover, and RSI is overbought at 61.25, indicating potential for a downward move. VIX is rising, and 10-year yields are increasing, adding to market pressure. Social sentiment on X is mixed, but news sentiment leans bearish.
Trade Details:
Entry Price: $198.82
Profit Target: $182.23 (~5% downside)
Stop Loss: $205.61 (2:1 risk-reward ratio)
Position Size: 4% of portfolio
Expected Move: -5%
Key Indicators:
MACD: Bearish crossover
RSI: Overbought at 61.25
Market Context: Rising VIX, increasing 10-year yields
Follow for Best AI Signals on the market

Spotify’s Steady UptrendSpotify Technology has climbed steadily for several quarters, and now some traders may think it’s ready to extend the uptrend.
The first pattern on today’s chart is the new high in mid-February, followed by a double bottom on March 10 and April 7. The resulting W formation may signal continuation of the longer-term advance.
Second, SPOT just closed above its previous high. Does that confirm a breakout in the streaming-media stock?
Third, MACD is rising.
Fourth, the 8-day exponential moving average (EMA) crossed above the 21-day EMA last month. The stock subsequently rose above the 50-day simple moving average (SMA) and has stayed there since. Meanwhile, the 100-day SMA has steadily risen from below.
Those patterns may be consistent with bullishness resuming in the short and intermediate terms, while remaining intact over the longer term.
TradeStation has, for decades, advanced the trading industry, providing access to stocks, options and futures. If you're born to trade, we could be for you. See our Overview for more.
Past performance, whether actual or indicated by historical tests of strategies, is no guarantee of future performance or success. There is a possibility that you may sustain a loss equal to or greater than your entire investment regardless of which asset class you trade (equities, options or futures); therefore, you should not invest or risk money that you cannot afford to lose. Online trading is not suitable for all investors. View the document titled Characteristics and Risks of Standardized Options at www.TradeStation.com . Before trading any asset class, customers must read the relevant risk disclosure statements on www.TradeStation.com . System access and trade placement and execution may be delayed or fail due to market volatility and volume, quote delays, system and software errors, Internet traffic, outages and other factors.
Securities and futures trading is offered to self-directed customers by TradeStation Securities, Inc., a broker-dealer registered with the Securities and Exchange Commission and a futures commission merchant licensed with the Commodity Futures Trading Commission). TradeStation Securities is a member of the Financial Industry Regulatory Authority, the National Futures Association, and a number of exchanges.
TradeStation Securities, Inc. and TradeStation Technologies, Inc. are each wholly owned subsidiaries of TradeStation Group, Inc., both operating, and providing products and services, under the TradeStation brand and trademark. When applying for, or purchasing, accounts, subscriptions, products and services, it is important that you know which company you will be dealing with. Visit www.TradeStation.com for further important information explaining what this means.

$OKTA is ready to RIP! 58% UpsideNASDAQ:OKTA was a big name I was talking about end of last year before we took a big dip in the markets...well we are back at the CupnHandle breakout level now and this trade looks ready to RIP!
Warning earnings on May 27th!
- Looking for a close on Friday above the breakout level for an entry here
- Green H5_L inidcator
- CupnHandle breakout
- Volume shelf launch
- Bullish Wr%
$139 First target
Measured Move is $186 for the cupnhandle
Not financial advice

Uptrend Stock / Swing and Run Trend / SE (NYSE)Uptrend Stock / Swing and Run Trend
SE (NYSE)
Fundamental
Sea Limited operates in three highly attractive business segments:
Sea Money – The company’s digital financial services arm offers consumer and SME lending, mobile wallets, and payment processing services.
Shopee – The largest e-commerce platform in Southeast Asia and Taiwan, with strong market presence and growth.
Garena – The company’s digital entertainment division, providing access to popular mobile and PC games. It also promotes eSports. Garena has developed its own successful game titles such as Free Fire, a globally popular battle royale game.
Sea Limited's key strength lies in its integrated platform that combines e-commerce, digital finance, and digital entertainment under one umbrella. This synergy allows the company to cross-leverage its customer base—for example, using Shopee users to promote Sea Money's financial services.
Technical
The price has been forming accumulation patterns at the bottom and gradually rallying upwards.
It’s showing a sideways-up structure, where the price bases sideways and then continues to rally upward in steps.
This setup allows for buy-the-dip opportunities using an indicator called Regression Trend to identify the trading channel.
For swing trading, one could buy on dips near the lower support band and sell at resistance on the upper band.
As shown in the chart (with circles marked), I’ve been buying on dips along the way.
In the most recent phase, you can consider buying around $139. If the price breaks out, the next support levels to watch would be around $143 and $147.
Target prices:
First target: $150
Next targets: $160 and $170
Stop Loss:
If the price drops below $120 and breaks the price structure, that would be the stop level.
As the quarterly earnings announcement approaches, the price is rallying in anticipation, and it's showing strong momentum within an uptrend—very positive sign.

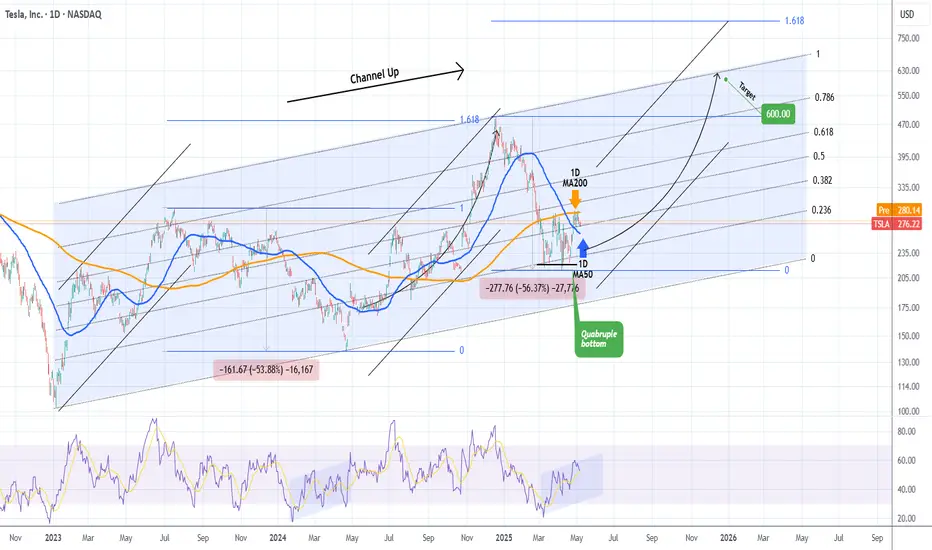
TESLA Is a $600 price tag a pipe dream?Tesla (TSLA) is seeing a steady recovery from the April 21 2025 Low, which has been a Quadruple Bottom, and has found itself consolidating the last 10 days within the 1D MA200 (orange trend-line) and the 1D MA50 (blue trend-line).
The 2.5 year pattern is a Channel Up and this Quadruple Bottom took place exactly on its 0.236 Fibonacci level, with a 1D RSI sequence that resembles the Bullish Divergence of its previous bottom on April 22 2024. The similarities don't stop there as the Bearish Legs that led to those bottoms have almost been identical (-53.88% and -56.37% respectively).
As a result we can technically assume that the current Bullish Leg that will be confirmed with a break above the 1D MA200, will be symmetrical to the previous one, which made a Higher High on the 1.618 Fibonacci extension from the bottom. That is now at $823 but falls outside of the 2.5-year Channel Up, so our long-term Target for the end of the year is $600, which is right at the top of the pattern.
-------------------------------------------------------------------------------
** Please LIKE 👍, FOLLOW ✅, SHARE 🙌 and COMMENT ✍ if you enjoy this idea! Also share your ideas and charts in the comments section below! This is best way to keep it relevant, support us, keep the content here free and allow the idea to reach as many people as possible. **
-------------------------------------------------------------------------------
💸💸💸💸💸💸
👇 👇 👇 👇 👇 👇
Chapter 2: “The Siege of $113” (BUY) (LONG)As the sun rose over the battlefield of the premarket, a new fire ignited in the heart of $NASDAQ:PLTR. No longer crawling beneath the walls, no longer whispering hope in the shadows — this morning, it stood tall, armor glinting, sword raised, its banner flying at $112.44.
The crowd of traders watched, holding their breath. For the first time in days, the warrior had not just broken the outer defenses…
…it was now staring down the gatekeepers of $113.
Above it loomed the yellow dashed ramparts — the fortified resistance of the bears, the final barricade before reclaiming the highlands of $114 and beyond.
Behind those walls, the bears sharpened their claws, watching the advancing price with growing unease. Their fortress had once been impenetrable. But today… cracks were showing.
And then — a surge.
The premarket volume roared like a war horn. Green candles marched forward, beating against the yellow line like a battering ram. Each tick upward was a shout:
“We’re not backing down.”
“We’re taking back what’s ours.”
The price hovered at $112.44 — tense, ready, coiled like a spring. Every trader, every algorithm, every fund manager watching knew:
This was the moment. The critical battle.

Coinbase Strengh Into Earnings (BTC)Coinbase with a clean head and shoulders pattern as we head into earnings after the bell today.
Bitcoin strength as it re-approaches $100k adds fuel to the flame.
Notice the fresh green tag into the cup/right shoulder indicating heavy buying momentum on COIN - wait for a close above the range for confirmation - preferably a momo candle.

My buy view for NVDAMy buy view for NVDA.
If positive fundamentals continue to outweigh bad news, we are likely to see NVDA push further up towards $120, $130, $140, and then its previous peak of $150.
Trade with care if you are day trading, but this baby is still selling at discount in my view

Nvidia long on 2 paths to 117 Great R/R on NVidia here .. that's it really easy trade, Hard part is do you sell it all at 117 or keep some

DELL on the daily forming Inverse H&SDELL on the daily timeframe shows Inverse Head and Shoulders. If this were to play out then expecting the gap fill above to complete.
See chart for gap start and gap finish.
100 pysch level test would act as resistance. Once we clear that, gap fill completion is possible

ASST: Trade write-up / 07 MayDaily Time-Frame Context
1h Chart
ASST gapped up over 300% pre-market on news of transitioning to a crypto holding company (a strong hype theme).
Despite being in a long-term downtrend, ASST had a history of prior gap-ups in 2023–2025.
Highest daily trading volume (HDW) ever recorded, with 80M shares traded pre-market.
Low short interest (0.5 days) and a relatively small float of 10.9M.
5-Min Time-Frame Analysis
Pre-Market Action:
Gap-up to Jan’25 highs, followed by shallow consolidation to the rising 8 EMA and VWAP (1h 8 EMA)
Opening Price Action:
Price posted a failed breakdown setup, finding support at VWAP, Jan’25 highs, and the pre-market base.
Selling volume remained low, while reversal volume showed substantial buying interest, with most bars closing at the highs.
MACD signaled bearish posture during this reversal, hinting at potential upcoming consolidation.
Mid-Day Movement
Price reached a mid-day top with increased selling volume, reduced buying, bearish MACD, and flattening short-term EMAs.
Pullback Phase
Price pulled back for 4 hours to early morning support (Jan’25 highs, pre-market top, morning reversal), with gradually decreasing volume, indicating drying-up selling interest.
Pullback had a textbook three-wave structure with ideal Fibonacci proportions.
Consolidation and Breakout
Established a solid consolidation at the key support zone, featuring:
Several shake-outs
Buying volume dominating selling
Sequance of higher lows formation
Inside bars prior to breakout
MACD turning bullish
Possible Entries
Aggressive Entry:
Failed breakdown and V-shaped reversal with an 11% stop at LOD.
Ideal Entry/Aggressive add-on:
After the shake-out/inside bars sequence on low volume, breakout confirmed by bullish convergence of EMAs and VWAP. Full stop could be placed bellow higher low.
Active Uptrend Phase
Price respected the 8 EMA during the active advance phase, pausing only during halts.
(!) Gradually increasing buying volume without a sudden spike - a sign of steady buying rather than stop-loss coverage.
Noticeably lower selling volume compared to buying volume.
Price approached the next significant daily resistance zone at Jan’24 highs - a potential profit-trimming target.
Swing-Trading Thesis
Strong crypto-related hype (becoming a crypto holding company).
Crypto sector showing relative strength since the market top and recovery phase.
Price maintained above key short-term moving averages into the close and post-market, supporting the bullish case.
Bitcoin pullback and altcoin breakout setups further enhance the thesis.

Disney Stock Pops on Strong Earnings Data. Turnaround Working?The Magic Kingdom just pulled a rabbit out of its hat — and Wall Street’s loving it.
Disney stock NYSE:DIS surged 11% on Wednesday, not just for its best day in a year, but for the kind of earnings beat that makes analysts reconsider their entire valuation model while retail traders tweet “ NYSE:DIS to the moon.”
Is the House of Mouse finally finding its footing? Just a day ago, Disney shares were languishing 60% below their 2021 record. Let’s break it down.
♫ Earnings That Deserve Their Own Theme Song
Starting with the headline: adjusted earnings per share clocked in at $1.45 , stomping the $1.20 consensus estimate. Revenue came in at $23.62 billion, a 7% jump from last year’s earnings performance and another beat that sent traders racing for their mouse ears.
After a year of streaming skepticism, cost-cutting, and investor hand-wringing over whether Bob Iger’s encore CEO tour could work magic, this quarter delivered. Bigly.
💪 Streaming Had No Business Going That Hard — But It Did
Wall Street was braced for a Disney+ subscriber drop. Instead, the company added 1.4 million new subscribers to 126 million, easily topping expectations of 123 million.
Not only are people still subscribing despite price hikes, but the direct-to-consumer segment (Disney+, Hulu, ESPN+) posted revenue growth of 8% to $6.12 billion, powered by both higher prices and surprise stickiness. Operating profit in streaming? A cool $336 million, up from $47 million a year ago.
Disney even raised its full-year adjusted EPS guidance to $5.75, a 16% gain from fiscal 2024 — a confident flex in a market where most companies are still managing expectations with surgical pessimism.
⏫ Mickey’s New Best Friend: Margin Expansion
It wasn’t just top-line fireworks — the net income boom was one for the books: $3.28 billion in profits, compared to a $20 million loss a year ago.
Operating margins in streaming are on the rise. Profitability, once seen as an elusive dream for all the big streaming platforms, is suddenly in sight. Disney is guiding toward $875 million in streaming profit for this fiscal year — and based on this quarter, that may end up conservative.
🎡 Parks Still Pay the Bills — With a Sprinkle of Magic
Now let’s talk about the real engine behind Disney’s machine: the parks and experiences division.
Domestic parks posted a 13% profit increase, powered by higher visitor spending and the launch of a shiny new cruise ship.
That’s important in an economy where every other headline screams “recession imminent.” Disney’s park guests are ignoring macro headwinds and enjoying the fantasy — and that’s music to shareholders’ ears.
Worried about tariffs? Sure, but they haven’t shown up on Disney’s balance sheet just yet. And until they do, Disney’s parks remain a cash printer with castles.
🏟️ A Park in Abu Dhabi — Why It May Be Big
Tucked in among the streaming buzz and EPS upgrade was something that made global investors raise an eyebrow: a new Disney theme park in Abu Dhabi.
On the surface, this sounds like a headline for 2031. And sure, it’ll take a few years to plan and build, and a few more to create the commemorative popcorn bucket. But long-term investors should pay attention.
Abu Dhabi isn’t just a tourist destination — it’s a capital backed by one of the world’s largest sovereign wealth funds and a keen interest in diversifying the revenue streams beyond oil. A Disney park there isn’t just another expansion — it’s a geopolitical bet on premium travel.
As Iger put it, it may seem modest now, but it’s quietly huge for the brand’s future footprint.
👀 What’s Behind the Magic? And Can It Last?
So the big question: is this a one-time sugar rush, or the start of a sustained turnaround?
There are reasons to be optimistic. Disney's streaming growth looks increasingly sustainable. Its content pipeline (including ESPN's evolving digital presence) is improving. The parks continue to defy economic gravity. And Iger seems to be rebalancing the business with a more profitable, investor-friendly mix.
But let’s not forget: content costs are still high, competition in streaming hasn’t gone anywhere, and park margins may come under pressure if consumer sentiment shifts. The macro backdrop remains complicated, and even Mickey can't outwit the Fed forever.
Still, this quarter wasn’t just “less bad than feared.” It was actually good — and that's a narrative shift that could power momentum.
🐭 The Mouse Still Got It
Disney’s earnings report, delivered in the heat of the earnings calendar , could be interpreted as a signal that the entertainment giant isn’t just navigating the new entertainment landscape — it might actually be mastering it.
And in a market starved for upside surprises, Disney just reminded investors that storytelling is its business — and this one’s finally got a happy twist.
The question now is whether traders and long-term holders believe in the next chapter. For now, with the stock back above $102 and the Magic Kingdom delivering financial magic, the bulls are back in the castle.
Your turn: Are you buying into Disney’s turnaround? Holding for the next golden age? Or still side-eyeing that subscriber chart? Let’s hear your play on NYSE:DIS below.

An Example Of How To Trade When You Live A Busy LifeIn this video, I demonstrate a swing trading approach that requires very little time in your day.
This type of trading, using limit orders, allows you to locate a strategy set-up, place your order in the market, set an alert, and then just let the market do it's thing.
I hope it's insightful!
The Meditrader

$UMAC Unusual Machines just locked in a FWB:40M CMPO, offering 8M shares at $5 each. This stealthy capital raise let them gauge institutional appetite before going public
and the market bit. Strong demand signals confidence in the company’s equity story.

GOOGL SUPPORT AND RESISTANCEGOOGL is trading near the $154.50 level after rejecting the $170 resistance zone, where a sell block (2B) is marked.
There’s a visible gap acting as near-term support around $150.
Below, major buy zones (4B) are aligned at $150–$140, with deeper support at $130, which coincides with the weekly support level.
As long as price holds above the $150 gap, buyers may attempt to regain control.
A break below $150 could push the stock toward the $140 and $130 supports.
#Alphabet #GOOGL #Trading #StockMarket #VolumeProfile #TechnicalAnalysis #Investing #WallStreet
#globaltrade #investment #investing #stockmarket #wealth #realestate #markets #economy #finance #money #forex #trading #price #business #currency #blockchain #crypto #cryptocurrency #airdrop #btc #ethereum #ico #altcoin #cryptonews #Bitcoin #ipo


MARA Holdings Options Ahead of EarningsIf you haven`t bought MARA before the recent rally:
Now analyzing the options chain and the chart patterns of MARA Holdings prior to the earnings report this week,
I would consider purchasing the 13usd strike price Calls with
an expiration date of 2025-5-30,
for a premium of approximately $1.38.
If these options prove to be profitable prior to the earnings release, I would sell at least half of them.
