Adam Mancini ES Game Plan LevelsThis script plots Support & Resistance levels from Adam Mancini's newsletter.
You can copy and paste levels from Adam's Newsletter to Indicator settings.
You can also add custom text after the support level. For e.g 6550 : Your custom text
Bands and Channels

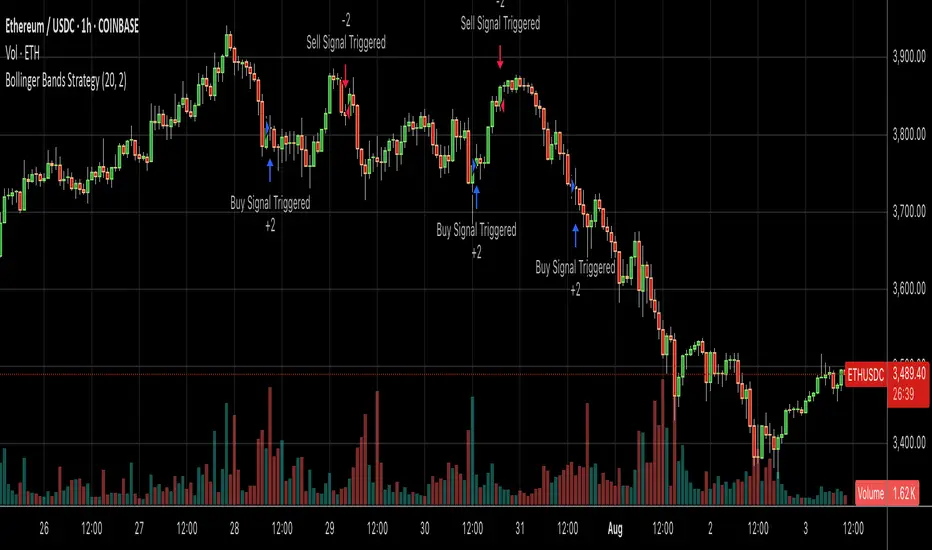
Bollinger Bands SMA 20_2 StrategyMean reversion strategy using Bollinger Bands (20-period SMA with 2.0 standard deviation bands).
Trade Triggers:
🟢 BUY SIGNAL:
When: Price crosses above the lower Bollinger Band
Logic: Price has hit oversold territory and is bouncing back
Action: Places a long position with stop at the lower band
🔴 SELL SIGNAL:
When: Price crosses below the upper Bollinger Band
Logic: Price has hit overbought territory and is pulling back
Action: Places a short position with stop at the upper band

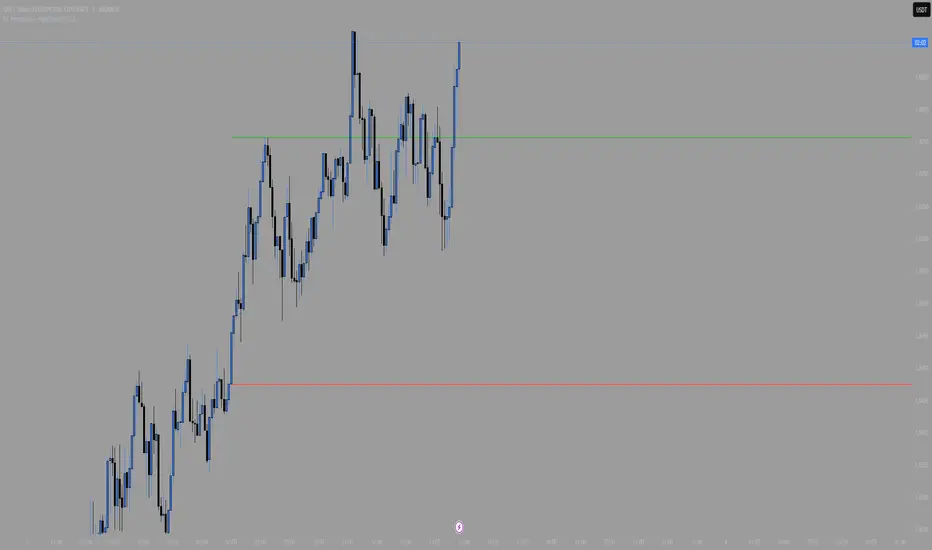
NY Premarket – High/LowNY Premarket – High/Low
Displays two horizontal lines for the last completed New York pre‑market session (07:00–09:30 America/New_York):
Premarket High (top wick of the session)
Premarket Low (bottom wick of the session)
Both lines are anchored to the exact candles that formed the session’s high/low and remain aligned with those candles regardless of zooming or panning.ng or panning.
Hunting Bollinger Bands for scalping📌 Bollinger Band Reversal BUY/SELL Indicator
Name: Hunting Bollinger Bands for scalping
Purpose: Displays reversal signals for short-term scalping in range-bound markets.
Target Users: Scalpers and day traders, especially for trading Gold (XAU/USD).
Recommended Target: Works well for scalping approximately $3 price movements on Gold.
Core Logic:
Detects excessive price deviation using Bollinger Bands (±2σ).
Filters out excessive signals with a bar interval limiter.
Displays clear and simple BUY/SELL labels for entry timing.
📌 Signal Conditions
BUY
Price closes below the Lower Bollinger Band.
At least the specified number of bars has passed since the previous signal.
Displays a “BUY” label below the bar.
SELL
Price closes above the Upper Bollinger Band.
At least the specified number of bars has passed since the previous signal.
Displays a “SELL” label above the bar.
📌 Parameters
Parameter Description Default
Bollinger Band Length (bbLength) Period for Bollinger Band calculation 20
Standard Deviation (bbStdDev) Standard deviation multiplier for band width 2.0
Signal Interval (barLimit) Minimum bar interval to avoid repeated signals 10
📌 How to Use
Add the indicator to your chart; Bollinger Bands and BUY/SELL labels will appear.
When a signal appears, confirm price reaction and enter a scalp trade (around $3 for Gold is recommended).
Adjust the “Signal Interval (barLimit)” to control signal frequency.
Avoid using it during high-impact news events or strong trending markets.
📌 Best Market Conditions
Range-bound markets
Scalping small price movements (~$3)
Low-volatility sessions (e.g. Asian session for Gold)
📌 Notes
May generate frequent signals during strong trends, leading to potential losses.
Can be combined with other indicators (e.g. 200 MA, RSI, VWAP) for higher accuracy.
Signals are for reference only and should not be used as the sole trading decision factor.
📌 ボリンジャーバンド逆張りBUY/SELL インジケーター解説
名前:Hunting Bollinger Bands for scalping
目的:レンジ相場での短期的な反発を狙った逆張りシグナルを表示
対象ユーザー:スキャルピングやデイトレードで、特にゴールド(XAU/USD)での小幅な値動きを狙うトレーダー
推奨利幅:ゴールドでおよそ 3ドル前後 を目安にスキャルピングを行うと有効
メインロジック:
ボリンジャーバンド(±2σ)で過剰な価格乖離を検出
バー間隔フィルターで過剰シグナルを制御
BUY/SELLラベルで視覚的にシンプルなエントリーポイントを表示
📌 シグナル条件
BUY(買いシグナル)
現在価格が ボリンジャーバンド下限(Lower Band)を下回った時
前回シグナルから指定したバー数以上経過
この条件を満たした場合、ローソク足下に「BUY」ラベルを表示します。
SELL(売りシグナル)
現在価格が ボリンジャーバンド上限(Upper Band)を上回った時
前回シグナルから指定したバー数以上経過
この条件を満たした場合、ローソク足上に「SELL」ラベルを表示します。
📌 パラメータ
項目 説明 初期値
ボリンジャーバンド期間 (bbLength) ボリンジャーバンド計算の期間 20
標準偏差 (bbStdDev) バンド幅を決める標準偏差 2.0
シグナル間隔 (barLimit) シグナルの連続表示を防止する最小バー間隔 10
📌 使い方
インジケーターをチャートに追加すると、ボリンジャーバンドとBUY/SELLラベルが表示されます
シグナルが出たら、反発確認後にスキャルピングエントリー(ゴールドなら約3ドルを目安に)
「シグナル間隔(barLimit)」を調整して、シグナルの過剰表示を防ぐ
経済指標発表や強いトレンド発生時は使用を控える
📌 このインジケーターが向いている相場
レンジ相場
小さな値幅(約3ドル前後)を狙うスキャルピング
トレンドが弱い横ばいの時間帯(例:アジア時間のゴールドなど)
📌 注意点
強いトレンド相場では、逆張りシグナルが連続的に発生し、損切りが増える可能性あり
200MAやRSI、VWAPなど他の指標と組み合わせることで精度を高められる
シグナルは参考用であり、単独での売買判断は推奨されない

EMA9, EMA200 with Bollinger BandsThe indicator includes the EMA9 line, the EMA200 line and the Bollinger Bands into a single indicator plot.

Double Bollinger Bands - SF2000twin BB's. One bb can be set for , eg 20 period. The other set for - eg - 50 period. compare the channels.
3 EMA trong 1 NTT CAPITALThe 3 EMA in 1 NTT CAPITAL indicator provides an overview of the market trend with three EMAs of different periods, helping to identify entry and exit points more accurately, thus supporting traders in making quick and effective decisions.

TOT Strategy, The ORB Titan (Configurable)This is a strategy script adapted from Deniscr 's indicator script found here:
All feedback welcome!

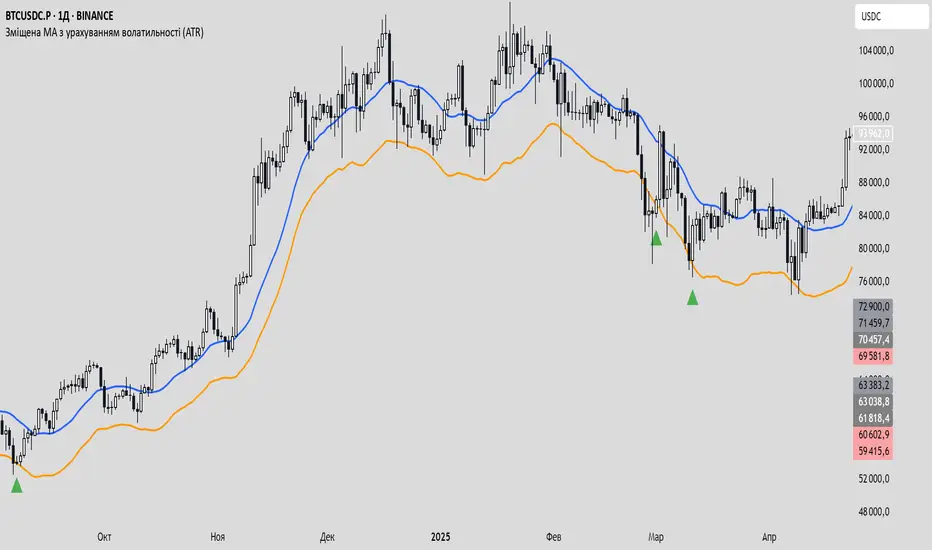
Зміщена MA з урахуванням волатильності (ATR)This is an experimental script designed to mark potential entry points for spot or long futures trades.
It uses a moving average (SMA or EMA) that is dynamically shifted downward based on current ATR (volatility). When the price crosses above this adjusted MA, a potential long entry signal is generated.
A stoploss line is plotted below the adjusted MA — offset
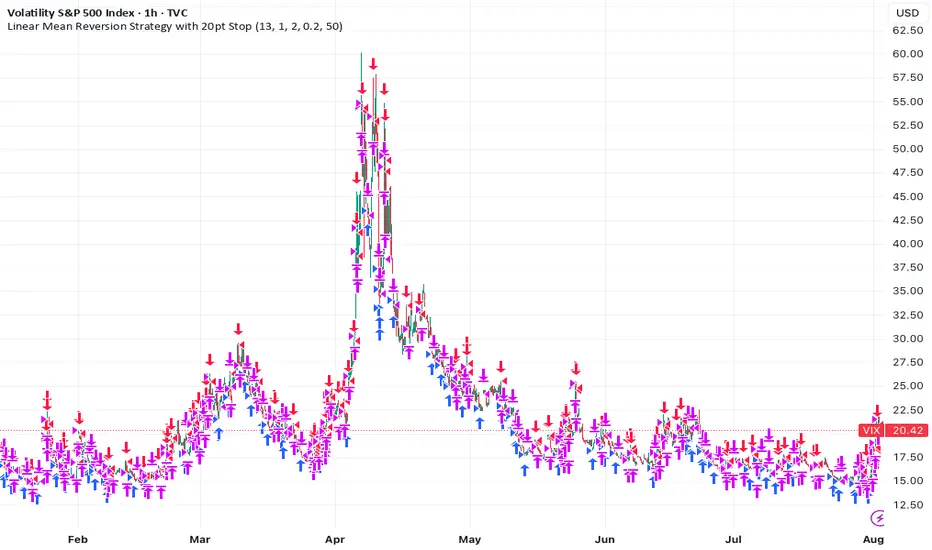
Linear Mean Reversion Strategy📘 Strategy Introduction: Linear Mean Reversion with Fixed Stop
This strategy implements a simple yet powerful mean reversion model that assumes price tends to oscillate around a dynamic average over time. It identifies statistically significant deviations from the moving average using a z-score, and enters trades expecting a return to the mean.
🧠 Core Logic:
A z-score is calculated by comparing the current price to its moving average, normalized by standard deviation, over a user-defined half-life window.
Trades are entered when the z-score crosses a threshold (e.g., ±1), signaling overbought or oversold conditions.
The strategy exits positions either when price reverts back near the mean (z-score close to 0), or if a fixed stop loss of 100 points is hit, whichever comes first.
⚙️ Key Features:
Dynamic mean and volatility estimation using moving average and standard deviation
Configurable z-score thresholds for entry and exit
Position size scaling based on z-score magnitude
Fixed stop loss to control risk and avoid prolonged drawdowns
🧪 Use Case:
Ideal for range-bound markets or assets that exhibit stationary behavior around a mean, this strategy is especially useful on assets with mean-reverting characteristics like currency pairs, ETFs, or large-cap stocks. It is best suited for traders looking for short-term reversions rather than long-term trends.
Power candle_v3.......Power candle_v3................Power candle_v3................Power candle_v3................Power candle_v3................Power candle_v3................Power candle_v3................Power candle_v3................Power candle_v3................Power candle_v3................Power candle_v3................Power candle_v3................Power candle_v3................Power candle_v3................Power candle_v3................Power candle_v3.........

Power candle_V2Power candle_V2Power candle_V2Power candle_V2Power candle_V2Power candle_V2Power candle_V2Power candle_V2Power candle_V2Power candle_V2Power candle_V2Power candle_V2Power candle_V2Power candle_V2Power candle_V2

TZtraderTZtrader
This is a TrendZones version with features to set stoploss and targets in short and long positions meant for use in intraday charts. It aims to provide signals for opening and closing long and short positions. In the comments under the TrendZones publication several people expressed a need for features for a short position similar to those for a long position as implemented in TrendZones, some want to use it for scalping, some asked for alerts. When I proposed to create a version for day trading with target lines based on ATR, several people liked the idea.
Full disclosure: I don’t do day trading, because, after I lost a lot of money, I had to promise my wife to stay away from it. I restrict myself to long term investing in stocks which are in uptrend. However I understand what a day trader needs. I gather from my experience that day trading or scalping is an attempt to earn something by opening a position in the morning and close, reopen and close it again during the day with a profit. It is usually done with leveraged instruments like CFD’s, futures, options, and what have you. Opening and closing positions is done within minutes, so the trader needs a quick and efficient way to set proper stoploss and target. TZtrader supports this by showing only three or four numbers on the price bar: The price of the instrument, The logical stop level (gray or green or maroon dots), and the target level (navy). All other numbers are suppressed to prevent mistakes. Also a clear feedback for current settings at the top-center of the pane and an alert feedback at bottom that flashes alerts during the development of the current bar and gives suppression status.
The script
First I made a bare bones version of TrendZones to which I added code for long and short trading setups and a bare setup for no position. The code for the logical stops in long setup had to be reviewed, after which this became the basis for stops in short setup.
Then I added code for 10 alert messages, which was a hassle, because this is the first time I coded alerts and the first time I used an array as a stack to avoid a complicated if-then construction. During testing the array caused a runtime error which I solved by adding ‘array.clear’ to the code, also I discovered that in TradingView separate alerts have to be created for all three setups - short, long and bare. Flipping setups is done in the inputs with a dropdown menu because Pine Script has no function for a clickable button.
One visual with three setups.
The visual has the TrendZones structure: Three near parallel very smooth curves, which border the moderate uptrend (green) and downtrend (orange) zone over and under the curve in the middle, the COG (Center Of Gravity). Where the price breaks out of these curves, strong trend zones show up over and under the curves, respectively strong uptrend (blue) and strong downtrend (red).
Three setups were made clearly different to avoid confusion and to provide oversight in case of multiple trades going on simultaneously which I imagine are monitored in one screen. You have to see which one is long, which short and which have no position. The long setup should not trigger short signals, nor should the short trigger long signals nor the bare setup exclusive long or short signals.
The Long setup is default, shown on the example chart. In this setup the Stoploss suggestions (green, gray and maroon dots) are under the price bars and the target line (navy) at a set distance above the High Border. A zone with a width of 1 ATR is drawn under the Low Border. In this setup 5 specific alerts are provided
The Short setup has the Stoploss suggestions over the price bars, the target line at a set distance under the Low Border. A zone with a width of 1 ATR is drawn above the High Border. This setup also has 5 specific alerts.
The Bare setup has no Stoploss suggestions, no target line and supports 4 alerts, 2 in common with the Long setup and 2 with Short.
The table below gives a summary of scripted alerts:
Setup = Where = When = Purpose
Long, Bare = Green Zone = Bars come from lower zones = Uptrend starts
Long, Bare = Green Zone = Sideways ends in uptrend = Uptrend resumes
Long = COG = First crossing = Uptrend might end warning
Long = Orange Zone = Bars come from higher zones = Uptrend ended take care
Long = Red Zone = Bars come from higher zones = Strong downtrend->close Long
Short, Bare = Orange Zone = Bars come from higher zones = Downtrend starts
Short, Bare = Orange Zone = Sideways ends in downtrend = Downtrend resumes
Short = COG = First crossing = Downtrend might end warning
Short = Green Zone = Bars come from lower zones = Downtrend ended take care
Short = Blue Zone = Bars come from lower zones = Strong uptrend -> close short
You can use script alerts in TradingView by clicking the clock in the sidebar, then ‘create alert’ or plus, as condition you choose ‘Tztrader’ in the dialog box, then the “Any alert() function call” option (the first item in the list). The script lets the valid alert trigger by TradingView after the bar is completed, this can differ from the flashed messages during its formation.
When you create alerts in Tradingview, I advice to do that for each setup, then to make only the alert active which matches the current setup, pause the other ones.
Suppressing false and annoying signals
The script has two ways to suppress such signals, which have to do with the numbers in the alert feedback. The numbers left and right of the message with a colored background, depict the zones in which the previous (left) and current (right) bar move. 1 is the strong downtrend zone (red), 2 the moderate downtrend zone (orange), 3 the sideways zones (gray), 4 the COG (gray), 5 the moderate uptrend zone (green), 6 the strong uptrend zone (blue), 7 something went wrong with assigning a zone (black). In extensive testing the number 7 never occurs, because I catch that error in the code. The idea is that an alert is only triggered if the previous bar was in a different zone. When the bars are in the same zone, no alert is possible. This way all annoying signals are suppressed and long, short and bare get the appropriate alerts.
The third number is a counter. It counts how often the COG is crossed without touching the outer curves. The counter will reset to zero when the upper or lower curve is touched. When the count is 1 you have zone situation 4 and appropriate alerts are flashed. When the count is 2 or higher, a sideways situation (3) is called and while the recrossings are going on, no alerts can be flashed. This suppresses false signals. The ATR zone and curves are brownish-gray where sideways happens(ed). When the channel is narrowed down to just the three curves, some false signals still might occur.
Inputs
“Setup”, default is long, drop down menu provides long, short and bare.
“Target ATR”, default is 2, sets the amount of ATR for the target line. In 1 minute charts 4 seems an appropriate setting, you have to learn by experience which setting works.
“show feedback …” default is on, This creates two feedback labels, a Setup feedback on top of the pane, which shows charted instrument, Setup type, Trend and timeframe of the chart. Background color of Trend feedback is green when it matches the setup, red when mismatches and gray when no match. The alert feedback at the bottom of the pane shows a number, a message and two numbers. The numbers will be explained in the chapter about false and annoying signals below. During formation of the bar, valid alerts are flashed with a blue background, otherwise the message ‘alerts for current bar suppressed’.
Logical Stops
The curves are the logical place to put stops, because, as these are averages of the high and low border of a Donchian channel, they signify the ‘natural’ current highest, lowest and main level in the lookback period that fit the monitored trend setup. A downtrend turns into an uptrend when a breakout of the upper curve occurs. If you are short, that is where you want to close position, so the logical place for the stoploss is the upper curve. Vice versa, when you are long, the logical stop is on the lower curve. The stops show up as green or gray dots on the curves, the green dots signify a nice entry level, the gray stops are there to suggest levels where unrealized profits might be secured, the maroon dots indicate that the trend mismatches the setup.
COG versus other lines
Any line used to identify a trend, be it some MA or some other line, is interpreted the same way: When the bars move above the line there is an uptrend and when below, a downtrend. COG is not different in that sense. If you put such a line in the same chart as TZtrader, you can see situations in which the other line shows uptrend or downtrend earlier than COG, also some other lines, e.g. Hull MA, are very good at showing tops and bottoms, while COG ignores these. On the other hand the other lines are usually a little nervous and let you shake out of position too soon. Just like the other lines, COG gives false signals when it is near horizontal. The advantage of the placement COG is the tolerance for pull backs. This way TZtrader keeps you longer in the trend. Such pull backs are often ‘flags’ which are interpreted in TA as confirming the trend. Tztrader aims to get you in position reasonably soon when a trend begins and out of position as soon as the trend turns against you. The placement of COG is done with a fundamentally different algorithm than other lines as it is not an average of prices, but the middle of two averages of borders of a Donchian channel. This gives the two zones between the curves the same quality as the two zones above and below the middle line of a standard Donchian Channel.
A multi timeframe application.
In this scenario you put a 5 minutes and 1 minute chart with Tztrader side by side. If the 5 minutes shows uptrend, set the 1 minute on long trading and open positions when the trend matches uptrend en close when it mismatches. Don’t open short positions. Once the 5 minute changes to downtrend, set Tztrader in the 1 minute to short trading and open positions when the trend matches downtrend and close when it mismatches.
The idea is that in a long ‘context’, provided by the 5 minutes, the uptrends in the 1 minute will last longer and go further, vice versa for the short ‘context’. This way you do swing trading in the 5 minute in a smart way, maximizing profits.
You can do this with any timeframe pairs with a proportion of around 5:1, 4:1, 6:1, like e.g. 60 minutes and 15 minutes or weeks and days (5 trading days in a week).
Dear day-traders, may this tool be helpful and may your days be blessed.
Take care

EMA 10/20/60/120// This script plots four Exponential Moving Averages (10, 20, 60, 120)
// for trend-following analysis. Crossovers and the order of the EMAs can
// help identify the strength and direction of the trend.

BTC 1m Chop Top/Bottom Reversal (Stable Entries)Strategy Description: BTC 5m Chop Top/Bottom Reversal (Stable Entries)
This strategy is engineered to capture precise reversal points during Bitcoin’s choppy or sideways price action on the 5-minute timeframe. It identifies short-term tops and bottoms using a confluence of volatility bands, momentum indicators, and price structure, optimized for high-probability scalping and intraday reversals.
Core Logic:
Volatility Filter: Uses an EMA with ATR bands to define overextended price zones.
Momentum Divergence: Confirms reversals using RSI and MACD histogram shifts.
Price Action Filter: Requires candle confirmation in the direction of the trade.
Locked Signal Logic: Prevents repaints and disappearing trades by confirming signals only once per bar.
Trade Parameters:
Short Entry: Above upper band + overbought RSI + weakening MACD + bearish candle
Long Entry: Below lower band + oversold RSI + strengthening MACD + bullish candle
Take Profit: ±0.75%
Stop Loss: ±0.4%
This setup is tuned for traders using tight risk control and leverage, where execution precision and minimal drawdown tolerance are critical.

PSAR LRC [CRT Trader]
SAR (Stop and Reverse) is a technical indicator used in financial markets to track trends and identify potential reversal points.
The indicator plots SAR calculations at three different speeds as dot markers above or below the candlesticks. If all three dots are below, it is considered a bullish signal; if they are above, it is considered a bearish signal.
In addition to the indicator, a Linear Regression Channel has been added. These lines can provide information such as trend direction, support, resistance, and potential breakouts.

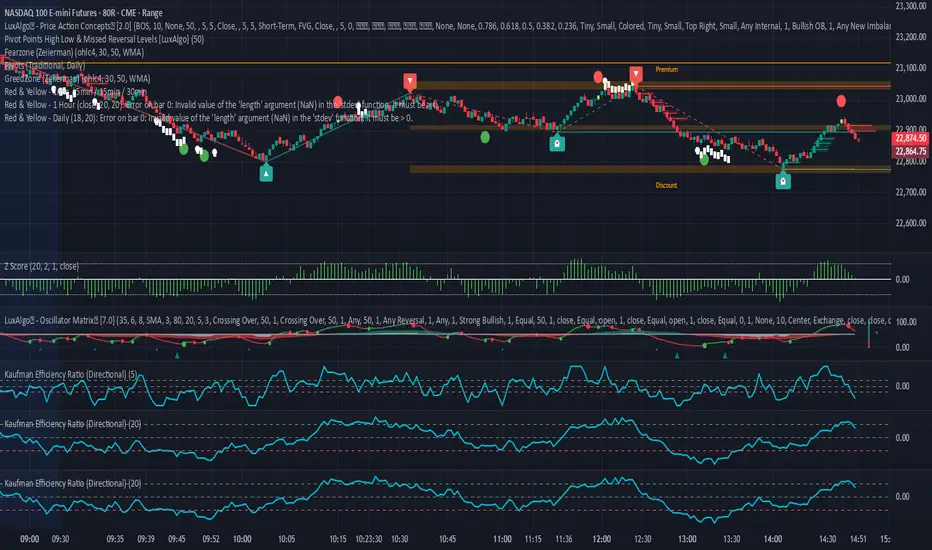
Kaufman Efficiency Ratio (Directional)Kaufman Indicator with negative and positive, i use 30 and negative 30 as trend indicators, some can use it as counter trend...a lot of other kaufman efficiency indicators are only at the positive level so even a short trend has a positive 30 value can be confusing.
High/Low Premarket & Previous Day This scripts adds lines for previous day and premarket high/low with labels that you can toggle on and off. The lines extend through current premarket and trading session

Auto Channel [SciQua]Auto Channel
Purpose
Auto Channel finds the single best parallel price channel from recent price action and keeps it updated in real time. It uses ZigZag pivots to build candidate channels, scores each candidate for quality, then plots the winner. When price closes outside the channel, the script flags a breakout and can fire alerts.
How it works
1. ZigZag pivots
The script uses TradingView’s TradingView/ZigZag/7 library to generate a stream of swing highs and lows based on a percentage reversal threshold and a leg depth. These pivots are the only points the channel logic evaluates, which keeps the search fast and focused on structure rather than noise.
2. Channel candidates
From the most recent pivots, the script forms all combinations of two swing highs and two swing lows.
It computes a slope for the high line and a slope for the low line and requires that they be nearly parallel within a user-defined tolerance.
3. Quality scoring and selection
For every valid candidate, the script checks the recent pivot segments against the trial channel and computes:
Inside ratio: fraction of tested pivots that sit fully inside the channel after applying the tolerance buffer.
Violation sum: total magnitude of the breaches for any pivots outside the channel.
Current width: distance between upper and lower lines at the current bar.
The “best” channel is chosen by:
1. highest inside ratio
2. then widest current width
3. then smallest violation sum
4. Plot and projection
The upper and lower lines are anchored to the chosen pivot pairs and extend to the left. The script also projects each line to the current bar to compute the live upper and lower channel prices. Those levels drive the breakout checks and alerts.
5. Breakouts and alerts
A breakout is detected when the bar closes above the projected upper line or closes below the projected lower line, after applying the tolerance buffer. Triangle markers highlight fresh breakouts, and you can enable alert conditions to automate notification or strategy handoff.
Inputs:
ZigZag
Price deviation for reversals (%)
Default 0.2. Larger values produce fewer, larger swings. Smaller values produce more, smaller swings.
Pivot legs
Default 2. Controls the lookback depth ZigZag uses to confirm pivots.
ZigZag Color
Visual only.
Tip: If you are not seeing a stable channel, increase the ZigZag percentage to reduce minor swings.
Channel search
Number of recent pivots to consider
Default 12. Higher values search more history and try more channel combinations. Lower values make the search faster and more reactive.
Max slope difference for parallel
Default 0.0005. Maximum allowed difference between the upper and lower line slopes. Smaller values enforce stricter parallelism.
Max price tolerance outside channel
Default 0.0. A buffer added to the channel boundaries during validation and breakout checks. Use this to ignore tiny wicks that poke the lines.
Minimum inside to outside pivots ratio for valid channel (0.00–1.00)
Default 1.00. Require that at least this fraction of checked pivots lie inside the channel. For a more permissive fit, try 0.60 to 0.85.
Styling
Upper Line Color
Lower Line Color
Breakout Above Color
Breakout Below Color
Plots and visuals
Upper channel line
Lower channel line
Triangle markers on the bar that first confirms a close outside the channel, above or below.
Lines extend left from their pivot anchors. Projection to the current bar is used internally to test for breakouts and to set alerts.
Alerts
The script defines two alert conditions:
Close Above Channel
Triggers when the bar closes above the projected upper line plus tolerance.
Close Below Channel
Triggers when the bar closes below the projected lower line minus tolerance.
Practical usage
Trend channels
In a steady trend, a high inside ratio with a moderate width often highlights the dominant channel. Consider trend entries near the lower line in an uptrend or near the upper line in a downtrend, with exits or stops beyond the opposite boundary.
Breakout trades
Combine the channel breakout alert with volume or a separate momentum filter. The tolerance input helps avoid false triggers from small wicks.
Tuning for timeframe and symbol
• Faster markets or lower timeframes usually benefit from a larger ZigZag percentage and a smaller pivot count.
• Slower markets or higher timeframes can use more pivots and a tighter slope difference to enforce cleaner geometry.
Notes and limitations
Channels are derived from ZigZag pivots. If your ZigZag settings change, the detected channel will also change.
The script plots only the single best channel at any time to keep the chart clean.
Breakout markers appear on confirmed bars. For historical bars, markers appear only where a breakout would have been confirmed at that time.
Lines extend left from their anchors. The script projects the lines internally to the current bar for checks and alerts.
License and attribution
License
Creative Commons Attribution-NonCommercial 4.0 International (CC BY-NC 4.0).
Open source for educational and personal use only. Commercial use requires written permission.
Attribution
© 2025 SciQua — Joshua Danford
Libraries
Uses TradingView/ZigZag/7.
Changelog
v1.0
Initial release. Automatic parallel channel detection from ZigZag pivots, quality scoring, live plotting, and close-based breakout alerts.
FAQ
Why do I not see any channel sometimes?
There may not be a valid pair of highs and lows that pass the slope, inside ratio, and tolerance checks. Loosen the constraints by increasing Max slope difference, lowering Minimum inside ratio, or increasing the ZigZag percentage.
The channel looks too narrow or too wide?
Adjust Number of recent pivots and Minimum inside ratio. A higher inside ratio tends to favor cleaner, sometimes wider channels. A lower ratio may admit narrower, more reactive channels.
How can I reduce false breakout alerts?
Increase Max price tolerance outside channel to ignore small wicks. Add a volume or momentum confirmation in your personal alert workflow.
Thank you for using Auto Channel . Feedback and improvements are welcome.

DEMACROSSOVA BY FLACODouble EMAs for entry signals
ATR Bands for stoploss
Fibonacci bollinger bands for early exit confirmation

Kairi Trend Oscillator [T3][T69]📌 Overview
The Kairi Trend Oscillator is a Japanese-inspired hybrid oscillator combining Heikin-Ashi trend clarity with the Kairi (乖離率) indicator — a measure of price deviation from a moving average. This dual-layer system gives you both trend direction and trend strength/health, designed to highlight trend maturity and avoid overextended entries.
✨ Features
Heikin-Ashi or normal candlestick input modes
Multiple moving average options: SMA, EMA, DEMA, VWMA, and Kijun
Visual color-coded trend zones: overbought, oversold, healthy, weak, and reversal conditions
Full Kairi column plot with dynamic coloring
Adaptive logic for trend detection (linear regression or Heikin-Ashi structure)
Built-in reversal detection based on divergence between Kairi and trend direction
⚙️ How to Use
Choose Candle Type: Select Heiken Ashi or Normal Candlesticks via the Candle Mode dropdown.
Select Source: Choose open, high, low, or close as the input for Kairi computation.
Set MA Type & Length: Configure the moving average mode and its length under Moving Average Settings.
Interpret the Plot:
Green/Red bars: Show Kairi oscillator values above/below 0
Background color: Shows current trend (green = uptrend, red = downtrend)
Candle color overlays:
🟩 Teal = Overextended Bulls
🟥 Maroon = Overextended Bears
✅ Green = Healthy Uptrend
🔻 Red = Healthy Downtrend
🟨 Light tones = Weak trends
🔄 Blue/Fuchsia = Possible reversal detected
🔧 Configuration
Inputs:
Candle Mode: Heiken Ashi or Normal Candle Sticks
Source: Open, High, Low, Close
MA Mode: SMA, EMA, DEMA, VWMA, or Kijun
MA Length: Default is 29
🧪 Advanced Tips
Use Heikin-Ashi mode for better trend smoothing.
Kairi divergence (e.g., bullish Kairi in a downtrend) may signal upcoming reversal — watch for blue or fuchsia bars.
Combine with momentum indicators (e.g. RSI or MACD) for confluence-based setups.
For mean reversion strategies, fade extreme Kairi readings (> ±5%).
⚠️ Limitations
Not suited for ranging markets without trend.
Kairi extremes may remain elevated in strong trends — avoid early counter-trend entries.
Reversal logic is not a confirmation signal; use with caution.
📌 Disclaimer
This script is educational and illustrative. Always backtest thoroughly before using in live markets.

Power candle addPower candle add++++Power candle add++++Power candle add++++Power candle add++++Power candle add++++Power candle add++++Power candle add++++Power candle add++++Power candle add++++Power candle add++++Power candle add++++Power candle add++++Power candle add++++
