Sabina's TRAMA Crossover MTF📊 Sabina's TRAMA Crossover MTF
Trend Regularity Adaptive Moving Average (TRAMA) is a dynamic smoothing algorithm that adjusts based on trend consistency. Unlike traditional moving averages like EMA or SMA, TRAMA speeds up in strong trends and slows down during consolidation, reducing noise and lag.
This script plots two TRAMA lines (short and long) and dynamically colors them based on crossover direction:
🟢 Green: Bullish crossover (short TRAMA crosses above long TRAMA)
🔴 Red: Bearish crossover (short TRAMA crosses below long TRAMA)
✅ Multi-Timeframe Enabled
You can run the indicator on your current chart while calculating TRAMA from any higher or lower timeframe. This gives you flexibility to track trend strength across different contexts.
Use cases:
Trend-following entries with adaptive confirmation
Scalping with higher-timeframe filters
Visual clarity of market regime (consolidation vs expansion)
Bands and Channels

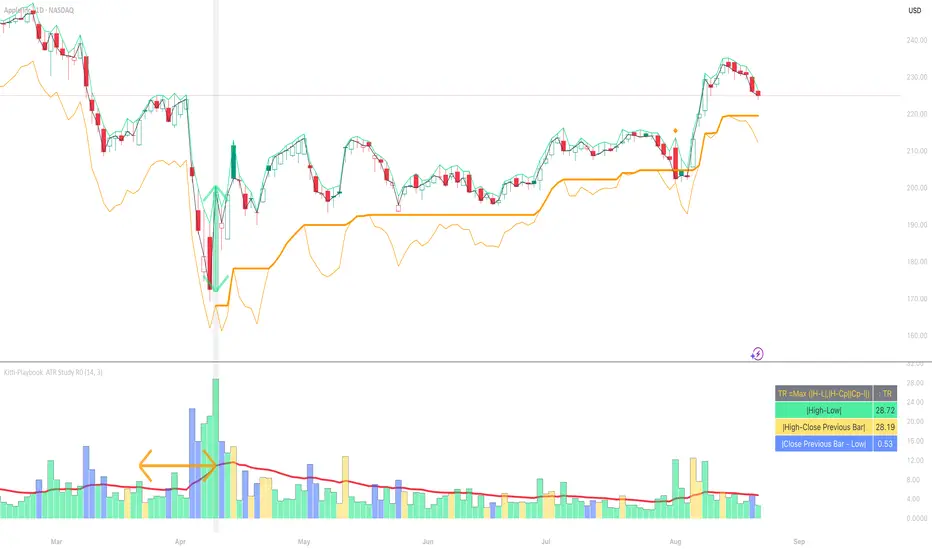
Kitti-Playbook ATR Study R0
Date : Aug 22 2025
Kitti-Playbook ATR Study R0
This is used to study the operation of the ATR Trailing Stop on the Long side, starting from the calculation of True Range.
1) Studying True Range Calculation
1.1) Specify the Bar graph you want to analyze for True Range.
Enable "Show Selected Price Bar" to locate the desired bar.
1.2) Enable/disable "Display True Range" in the Settings.
True Range is calculated as:
TR = Max (|H - L|, |H - Cp|, |Cp - L|)
• Show True Range:
Each color on the bar represents the maximum range value selected:
◦ |H - L| = Green
◦ |H - Cp| = Yellow
◦ |Cp - L| = Blue
• Show True Range on Selected Price Bar:
An arrow points to the range, and its color represents the maximum value chosen:
◦ |H - L| = Green
◦ |H - Cp| = Yellow
◦ |Cp - L| = Blue
• Show True Range Information Table:
Displays the actual values of |H - L|, |H - Cp|, and |Cp - L| from the selected bar.
2) Studying Average True Range (ATR)
2.1) Set the ATR Length in Settings.
Default value: ATR Length = 14
2.2) Enable/disable "Display Average True Range (RMA)" in Settings:
• Show ATR
• Show ATR Length from Selected Price Bar
(An arrow will point backward equal to the ATR Length)
3) Studying ATR Trailing
3.1) Set the ATR Multiplier in Settings.
Default value: ATR Multiply = 3
3.2) Enable/disable "Display ATR Trailing" in Settings:
• Show High Line
• Show ATR Bands
• Show ATR Trailing
4) Studying ATR Trailing Exit
(Occurs when the Close price crosses below the ATR Trailing line)
Enable/disable "Display ATR Trailing" in Settings:
• Show Close Line
• Show Exit Points
(Exit points are marked by an orange diamond symbol above the price bar)
Advanced Price Ranges ICTThis indicator automatically divides price into fixed ranges (configurable in points or pips) and plots important reference levels such as the high, low, 50% midpoint, and 25%/75% quarters. It is designed to help traders visualize structured price movement, spot confluence zones, and frame their trading bias around clean range-based levels.
🔹 Key Features
Custom Range Size: Define ranges in points (e.g., 100, 50, 25, 10) or in Forex pips.
Forex Mode: Automatically adapts pip size (0.0001 or 0.01 for JPY pairs).
Dynamic Anchoring: Price ranges automatically align to the current price, snapping into blocks.
Multiple Ranges: Option to extend visualization above and below the current active block for a complete grid.
Level Types:
High / Low of the range
50% midpoint
25% and 75% quarters
Custom Styling: Adjustable line colors and widths for each level type.
Labels: Optional right-edge labels showing level type and exact price.
Alerts: Built-in alerts for when price crosses the range high, low, or 50% midpoint.
🔹 Use Cases
Quickly map out 100/50/25/10 point structures like Zeussy’s advanced price range method.
Identify key reaction levels where liquidity is often built or swept.
Support ICT-style concepts like range-based bias, fair value gaps, and liquidity pools.
Works for indices, futures, crypto, and forex.
🔹 Customization
Range increments can be set to any size (default 100).
Toggle which levels are shown (High/Low, Midpoint, Quarters).
Adjustable line widths, colors, and label visibility.
Extend ranges above and below for broader market context.

Custom Support & Resistance LevelsThe Smart Auto Trendline Indicator is designed to help traders quickly identify key market trends without the need for manual drawing. It automatically detects swing highs and lows, plots dynamic trendlines, and updates them in real-time as price evolves.
This tool is especially useful for traders who rely on trendline breakouts, pullback entries, or reversal confirmations. By simplifying chart analysis, it saves time and ensures more consistent results.
Key Features:
🔹 Automatic detection of valid swing highs and lows
🔹 Dynamic trendline plotting (auto-adjusts as price moves)
🔹 Highlights potential breakout and breakdown zones
🔹 Works on all timeframes and instruments (Forex, Stocks, Indices, Crypto)
🔹 Clean, non-intrusive design to keep charts clear
🔹 Customizable settings (line color, style, sensitivity)
How to Use:
Apply the indicator to your chart.
Observe automatically drawn trendlines.
Watch for breakouts above/below trendlines for trade entries.
Use in combination with other tools like RSI, MACD, or support/resistance for stronger confirmation.
Best For:
Breakout traders
Swing traders
Trend followers
Forex, Stocks, Crypto, Indices
Range FinderRange Finder Strategy for TradingView
Overview
The Range Finder Strategy is a sophisticated trading system designed for forex and cryptocurrency markets, leveraging dynamic range detection, wick-based rejection patterns, and EMA confluence to execute high-probability trades. This strategy identifies key price ranges using pivot points and triggers trades when price rejects from these boundaries with significant wick formations, aligning with the broader market trend as confirmed by EMA crossovers. It incorporates robust risk management, customizable parameters, and visual aids for clear trade visualization, making it suitable for both manual and automated trading on platforms like Bitget via webhook alerts.
Strategy Components
1. Dynamic Range Detection
Pivot Points: The strategy identifies range boundaries using pivot highs and lows, calculated with a user-defined Pivot Length (default: 5 bars left/right). These pivots mark significant swing points, defining the upper (range high) and lower (range low) boundaries of the price range.
Visualization: The range high is plotted as an orange line, and the range low as a purple line, using a broken line style (plot.style_linebr) to show only confirmed pivot levels, providing a clear visual of the trading range.
2. Wick-Based Rejection Pattern
Wick Detection: The strategy looks for rejection candles at the range boundaries, characterized by significant wicks. A wick is considered valid if its size is at least the user-defined Wick to Body Ratio (default: 1.1, or 10% larger than the candle body).
Sell Signal: Triggered when the high exceeds the range high, the candle closes bearish (close < open), and the upper wick meets the ratio requirement.
Buy Signal: Triggered when the low falls below the range low, the candle closes bullish (close > open), and the lower wick meets the ratio requirement.
Purpose: These wicks indicate strong rejection at key levels, often signaling a reversal back into the range, providing high-probability entry points.
3. EMA Trend Confirmation
EMA Calculation: Uses two Exponential Moving Averages (EMAs) calculated on a user-selectable timeframe (default: 5-minute):
EMA 200: Long-term trend indicator (plotted in red).
EMA 50: Short-term trend indicator (plotted in green).
Crossover Logic:
A bullish trend is confirmed when the EMA 50 crosses above the EMA 200 (ema_trend_up = true).
A bearish trend is confirmed when the EMA 50 crosses below the EMA 200 (ema_trend_down = true).
Confluence Requirement: Trades are only executed when the wick rejection aligns with the EMA trend (e.g., sell signals require close < ema200 and bearish trend; buy signals require close > ema200 and bullish trend).
4. Risk Management
Position Sizing: Calculated based on the user-defined Account Balance (default: $10,000) and Risk Per Trade (default: 2%). The position size is determined as risk_amount / stop_distance, where stop_distance is derived from the Average True Range (ATR, default period: 14).
Stop Loss (SL): Set using an ATR-based multiplier (SL Multiplier, default: 9.0). For sells, SL is placed above the high; for buys, below the low.
Take Profit (TP): Set using an ATR-based multiplier (TP Multiplier, default: 6.0) scaled by the Risk:Reward Ratio (default: 6.0), ensuring a favorable reward-to-risk profile.
Example: For a $10,000 account with 2% risk, if ATR is 0.5, the position size is 400 units, with SL and TP dynamically adjusted to market volatility.
5. Trade Execution
Sell Entry: Triggered on a wick rejection above the range high, with bearish EMA confluence (ema_trend_down and close < ema200). Enters a short position with calculated SL and TP.
Buy Entry: Triggered on a wick rejection below the range low, with bullish EMA confluence (ema_trend_up and close > ema200). Enters a long position with calculated SL and TP.
Exit Logic: Uses strategy.exit to set SL and TP levels, closing trades when either is hit.
6. Visual Feedback
Lines and Labels: Upon trade entry, the strategy plots:
Red SL line and label (e.g., "SL: 123.45").
Green TP line and label (e.g., "TP: 120.00").
Entry line (red for sell, green for buy) labeled with "Sell (Range Rejection)" or "Buy (Range Rejection)".
Customization: Users can adjust the Line Length (default: 25 bars) for how long lines persist and Label Position (left or right) for optimal chart visibility.
7. Alert Conditions
Webhook Integration: Generates alerts for Bitget webhook integration, providing JSON-formatted messages with trade details (action, contracts, market position, size, price, symbol, and timestamp).
Usage: Traders can set up automated trading by connecting these alerts to trading bots or platforms supporting webhooks.


SMC Yardımcısı - TR (Optimize v2.1)BOS (Break of Structure)
Labels when price closes above/below a previous swing high/low.
Shows continuation of the current trend.
CHOCH (Change of Character)
Appears when trend direction shifts (from bullish to bearish or vice versa).
Marks possible market reversals.
FVG (Fair Value Gap)
Highlights price imbalance zones (3-candle gaps).
These are often areas where price later returns to “fill” liquidity.
OTE (Optimal Trade Entry, 62–79% retracement)
Uses the last swing high and swing low.
Draws the Fibonacci retracement zone (62–79%), considered a common institutional entry area.
BSL (Buy Side Liquidity – Equal Highs)
Detects equal highs and plots them as liquidity pools.
Shows where buy-side liquidity/stop hunts may occur.
SSL (Sell Side Liquidity – Equal Lows)
Detects equal lows and plots them.
Indicates sell-side liquidity levels.
Inducement / Liquidity Sweep
If price wicks above BSL or below SSL but closes back inside, a “sweep” label is shown.BOS (Break of Structure – Yapı Kırılımı)

Dove Capital – Psych Levels 000/250/500/750 (safe build)Market makers use psychological numbers to validate support and resistance. This being said, I've mapped out a system that will navigate the support and resistance areas

Universal MA Cloud It's a highly customizable MA with a Cloud around the precise value to dynamically account for high/low market volatility environments. Have fun.

20W SMA (true 20W or 140D match)Modified SMA to reflect true 20W Smooth Moving Average.
Choose between different TF's and the price remains the same
Custom ATR BandsThis indicator provides a customisable, easy to view band around the price, based on the ATR. The ATR length and multiplier can be adjusted.
SCTI-D1SCTI-D1 Indicator Introduction / 指标简介
The SCTI-D1 (Smart Composite Trading Indicator - Daily) is a comprehensive, multi-feature trading tool designed for serious traders who demand depth, flexibility, and clarity in their market analysis. This indicator combines several powerful concepts into one seamless workflow, including:
Multiple EMA Systems with customizable lengths and visibility
PMA (Projected Moving Average) with fill options between lines
VWAP with configurable anchors and deviation bands
Divergence Detection for MACD and Histogram
Volume Profile with node detection (peaks, troughs, highs, lows)
Smart Money Concepts including order blocks, fair value gaps, equal highs/lows, and market structure shifts
Whether you trade stocks, forex, or cryptocurrencies, the SCTI-D1 helps you identify key levels, track institutional activity, and spot high-probability reversal signals—all in one clean, customizable interface.
SCTI-D1 指标简介
SCTI-D1(智能综合交易指标 - 日线版)是一款功能全面的交易工具,专为需要深度、灵活性和清晰市场分析的专业交易者设计。该指标将多种强大概念融合在一个流畅的工作流程中,包括:
多组EMA系统,可自定义长度和显示
PMA(投影移动平均线),支持均线间填充色
VWAP,可配置锚定周期和偏差带
背离检测,支持MACD和柱状图
成交量分布,支持节点检测(峰值、谷值、最高、最低)
聪明钱概念,包括订单块、公允价值缺口、等高/等低和市场结构转换
无论您交易股票、外汇还是加密货币,SCTI-D1 都能帮助您识别关键水平、跟踪机构资金动向并发现高概率反转信号——所有功能均集成在一个清晰可定制的界面中。

Ichimoku Trading Signals 2Swing Trading (Strategy 1, H4+ timeframes)
Use the Kumo Cloud to identify the trend: price above a green cloud = uptrend; price below a red cloud = downtrend.
Entry signals occur when price or the Tenkan-sen line crosses the Kijun-sen line, confirmed by Chikou Span momentum.
Exit triggers when price crosses back through the Kijun-sen or when Tenkan-sen crosses back below (for long positions) or above (for short positions).
Place stop-loss orders just beyond the nearest swing low/high candle cluster to manage risk tightly.

PDH/PDL (prev RTH) + Current ETH High/LowDescription:
This indicator automatically plots the key levels of PDH/PDL (Previous Day High/Low from regular trading hours – RTH) and ETH High/Low (Extended Hours: pre-market + after-hours) in real time.
• PDH/PDL: calculated at the close of RTH (09:30–16:00 NYSE) and anchored until the next day.
• ETH High/Low: updated live during extended hours (04:00–09:29 and 16:00–20:00 NYSE) and “frozen” at the RTH open for reference during the regular session.
• Customization options: colors, line styles (solid/dashed/dotted), thickness, labels, and the ability to extend lines to the right.
• Levels can also be displayed directly on the price scale.
This script is designed for traders who want a quick visualization of the most relevant levels from the previous day and extended hours, making it easier to identify supports, resistances, and potential reaction zones in price action.
By: Miguel Arenas

Custom Session High/Low Horizontal levelsThis Custom Session High/Low Horizontal levels will display for each day the lower and higher horizontal levels for the custom session interval programmed.
This is mainly userfull in some charts like DE30 but can be tested as well in others.
We look for rejections from this level like before london session if price rejects from Low of custom session or if price rejects from High of custom session.
For example one custom session can be End of Ny sesion and asia session going into begining of london session to moitor it for this levels.

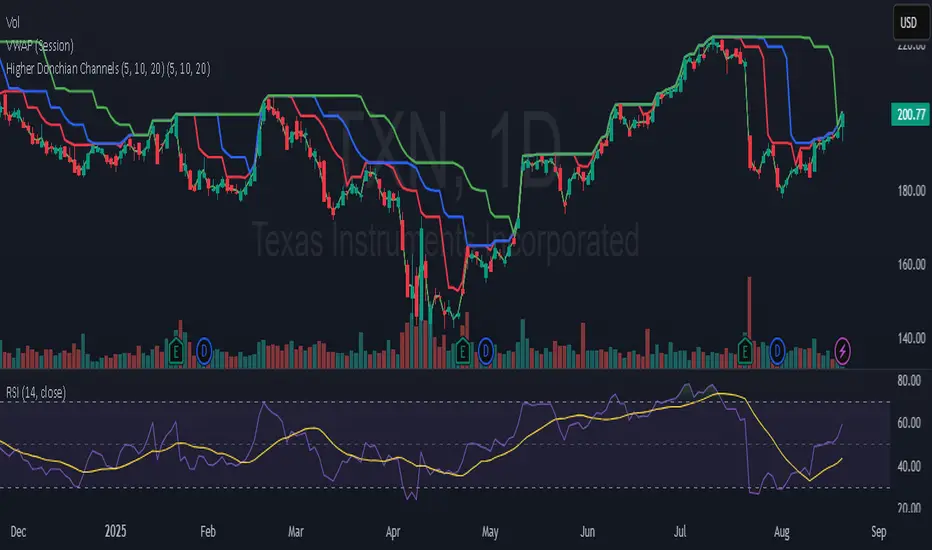
3x Donchian Upper BandsPlot only the upper Donchian bands (no lower or middle line).
Show 5-day (red), 10-day (blue), and 20-day (green) Donchian highs.
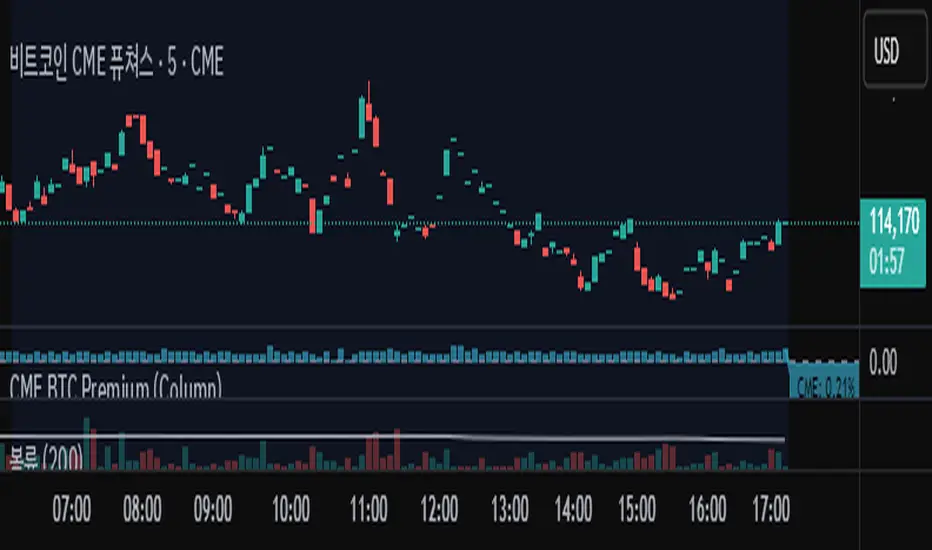
Bitcoin cme gap indicators, BINANCE vs CME exchanges premium gap
# CME BTC Premium Indicator Documentation CME:BTC1!
## 1. Overview
Indicator Name: CME BTC Premium
Platform: TradingView (Pine Script v6)
Type: Premium / Gap Analysis
Purpose:
* Visualize the CME BTC futures premium/discount relative to Binance BTCUSDT spot price.
* Detect gap-up or gap-down events on the daily chart.
* Assess short-term market sentiment and potential volatility through price discrepancies.
## 2. Key Features
1. CME Premium Calculation
* Formula:
CME Premium(%) = ((CME Price - Binance Price) / Binance Price) X 100
* Positive premium: CME futures are higher than spot → Color: Blue
* Negative premium: CME futures are lower than spot → Color: Purple
2. Premium Visualization Options
* `Column` (default)
* `Line`
3. Daily Gap Detection (Daily Chart Only)
* Gap Up: CME open > previous high × 1.0001 (≥ 0.01%)
* Gap Down: CME open < previous low × 0.9999 (≤ 0.01%)
* Visualization:
* Bar Color:
* Gap Up → Yellow (semi-transparent)
* Gap Down → Blue (semi-transparent)
* Background Color:
* Gap Up → Yellow (semi-transparent)
* Gap Down → Blue (semi-transparent)
4. Label Display
* If `Show CME Label` is enabled, the last bar displays a premium percentage label.
* Label color matches premium color; text color: Black.
* Style: `style_label_upper_left`, Size: `small`.
## 3. User Inputs
| Option Name | Description | Type / Default |
| -------------- | ------------------------- | --------------------------------------- |
| Show CME Label | Display CME premium label | Boolean / true |
| CME Plot Type | CME premium chart style | String / Column (Options: Column, Line) |
## 4. Data Sources
| Data Item | Symbol | Description |
| ------------- | ---------------- | ----------------------------- |
| Binance Price | BINANCE\:BTCUSDT | Spot BTC price |
| CME Price | CME\:BTC1! | CME BTC futures closing price |
| CME Open | CME\:BTC1! | CME BTC futures open price |
| CME Low | CME\:BTC1! | CME BTC futures low price |
| CME High | CME\:BTC1! | CME BTC futures high price |
## 5. Chart Display
1. Premium Column/Line
* Displays the CME premium percentage in real-time.
* Color: Premium ≥ 0 → Blue, Premium < 0 → Purple
2. Zero Line
* Indicates CME futures are at parity with spot for quick visual reference.
3. Gap Highlight
* Applied only on daily charts.
* Gap-up or gap-down is highlighted using bar and background colors.
4. Label
* Shows the latest CME premium percentage for quick monitoring.
## 6. Use Cases
* Analyze spot-futures premium to gauge CME market sentiment.
* Identify short-term volatility and potential trend reversals through daily gaps.
* Combine premium and gap analysis to support altcoin trend analysis and position strategy.
## 7. Limitations
* This indicator does not provide investment advice or trading recommendations; it is for informational purposes only.
* Data delays, API restrictions, or exchange differences may result in calculation discrepancies.
* Gap detection is meaningful only on daily charts; other timeframes may not provide valid signals.
BTC Evaluation IndicatorBTC Evaluation Indicator
The BTC Evaluation Indicator is a volatility-based tool designed to help traders evaluate Bitcoin’s price behavior relative to its moving average trend. It combines customizable moving averages with dynamic standard deviation bands to identify overbought and oversold conditions.
Key Features
Flexible Moving Averages: Choose between SMA, EMA, WMA, VWMA, HMA, or RMA for the baseline trend.
Dynamic Volatility Bands: Upper and lower bands are calculated using standard deviation, scaled by a user-defined multiplier.
Visual Clarity:
Orange line = central moving average (trend mean)
Green line = upper band (potential overbought zone)
Red line = lower band (potential oversold zone)
Shaded gray area = volatility range
Automatic Highlights: Background shading marks when price breaks above the upper band (overbought) or below the lower band (oversold).
How to Use
When price pushes above the upper band, it may indicate overextension or potential local overbought conditions.
When price falls below the lower band, it may signal undervaluation or potential oversold conditions.
The mean line acts as a dynamic equilibrium, often serving as short-term support/resistance.
This indicator is designed for Bitcoin evaluation, but it can be applied to any asset. By combining trend analysis with volatility context, it helps traders better understand when price may be stretched and when conditions are reverting to the mean.

RSI Dynamic Bands█ OVERVIEW
The "RSI Dynamic Bands" indicator is a variant of the Relative Strength Index (RSI) oscillator that brings its signals directly onto the price chart. It displays dynamic bands around the price, adjusted based on RSI levels, enabling easy identification of potential overbought or oversold conditions. The indicator also integrates a multi-timeframe RSI table, facilitating the analysis of trend strength across different timeframes.
█ CONCEPTS
The "RSI Dynamic Bands" indicator is designed to simplify the interpretation of price levels in the context of support and resistance zones, which can be correlated with other technical indicators and RSI values. Since the price itself does not display RSI values, a table showing RSI for four selected timeframes has been added, allowing traders to quickly assess trend strength across different time intervals. The most effective approach is to combine the indicator with other technical analysis tools, such as Fibonacci levels or pivot points, to confirm signals when the price approaches the bands and RSI values indicate a potential reversal.
Band Calculation
The bands are calculated based on the current closing price and RSI values, incorporating dynamic scaling to better adapt to market conditions. The formulas for the bands are as follows:
• Upper Band: close + (rsiUpper - rsi) * scaleFactor, where rsiUpper is the upper RSI level (default: 70), and scaleFactor accounts for market volatility.
• Lower Band: close + (rsiLower - rsi) * scaleFactor, where rsiLower is the lower RSI level (default: 30).
• Midline: The arithmetic average of the upper and lower bands: (upperBand + lowerBand) / 2.
Why Scaling? Without scaling, the bands would be chaotic and jagged, making them difficult to interpret. Scaling smooths the bands, making them wider during periods of high volatility and narrower during consolidation, better reflecting potential support and resistance levels.
Indicator Features
• Dynamic Price Bands: The bands adapt to market conditions, facilitating the identification of key price levels.
• Multi-Timeframe RSI Table: Displays RSI values for four selected timeframes (default: 15m, 1h, 4h, Daily), enabling comparison of trend strength across different perspectives.
• Style Customization: Users can adjust band colors, line thickness, and toggle the visibility of bands, fills, and the table.
How to Set Up the Indicator
1 — Add the "RSI Dynamic Bands" indicator to your TradingView chart.
2 — Configure parameters in the settings, such as RSI length, upper/lower levels, and scaling multiplier, to match your trading style.
3 — Enable or disable the display of bands, fills, or the RSI table based on your needs.
4 — Adjust band and table colors in the input section and line thickness in the "Style" section to better align the indicator with your chart.
█ OTHER SECTIONS
FEATURES
• RSI Length: The period for calculating RSI (default: 14).
• RSI Levels: Thresholds for overbought (default: 70) and oversold (default: 30).
• Scaling Multiplier: Adjusts bands based on market volatility (default: 0.15).
• Table Timeframes: Select four timeframes for the RSI table (default: 15m, 1h, 4h, Daily).
• Style Options: Customize band colors, fills, table, and line thickness.
HOW TO USE
Add the indicator to your chart, configure the parameters, and observe price interactions with the bands to identify potential entry and exit points. The RSI table allows you to compare RSI values across different timeframes, aiding in trading decisions. The most effective approach is to combine the indicator with other technical analysis tools, such as Fibonacci levels or pivot points, to confirm signals when the price approaches the bands and RSI values indicate a potential reversal.
Trading Strategies:
• Scalping: Use lower timeframes (e.g., 5m, 15m) in the RSI table to quickly identify short-term lows and highs. Wait for the price to approach the lower band in the RSI oversold zone, with RSI on lower timeframes starting to rise, and other tools, such as Fibonacci levels (e.g., 38.2%) or pivot points, confirming support.
• Medium-Term Trading: Focus on 1h and 4h timeframes. Look for confirmation of a low on a lower timeframe (e.g., 1h), where RSI indicates oversold conditions or starts rising, then check if RSI on a higher timeframe (e.g., 4h) confirms the trend. Confirmation from other tools, such as a Fibonacci level (e.g., 50%) or pivot point near the bands, strengthens the signal.
• Long-Term Trading: Use Daily and higher timeframes (e.g., Weekly). Wait for all relevant timeframes to confirm a low (e.g., RSI near oversold and price at the lower band), with lower timeframes (e.g., 4h) showing rising RSI. Other tools, such as Fibonacci levels (e.g., 61.8%) or pivot points near the bands, can further confirm a trend reversal signal.

Pure Price Zone Flow🔎 What this indicator is
It’s a price-action-based zone indicator. Unlike moving average systems, this one relies only on:
1. Swing Highs & Swing Lows → The highest and lowest points within a recent lookback period (like "mini support & resistance").
2. ATR (Average True Range) → A volatility measure that expands the zone, making it more adaptive to different market conditions.
3. Breakouts & Retests → When price breaks above a swing high (bullish) or below a swing low (bearish), the indicator marks it and highlights the new trend.
👉 The goal is to spot clean structure shifts and define clear trend zones where traders can position themselves.
________________________________________
⚙️ How it is calculated
1. Swing High & Swing Low
o We look back len candles (default 20).
o Find the highest high (swingHigh) and the lowest low (swingLow) in that window.
o This forms the price range zone.
2. ATR Expansion
o We calculate ATR over the same len.
o Add/subtract it (multiplied by atrMult) to the zone edges to expand them.
o This ensures the zones breathe with volatility (tight in quiet markets, wide in choppy ones).
3. Mid-Zone
o Simply the average of swingHigh and swingLow.
o If price is above mid → bullish bias.
o If below mid → bearish bias.
o This gives us the trend color for candles.
4. Breakouts
o If the close crosses above swingHigh, we mark a bullish breakout with a label.
o If the close crosses below swingLow, we mark a bearish breakdown.
________________________________________
📊 How it helps traders
This indicator helps by:
1. Identifying Structure Shifts
o Many traders watch swing highs/lows for breakouts or reversals.
o This automates the process and visually confirms when structure is broken.
2. Dynamic Zone Trading
o Instead of fixed support/resistance, the ATR expansion adapts to volatility.
o This avoids false signals in high-volatility conditions.
3. Trend Bias at a Glance
o Candle coloring instantly tells you whether price is in bullish or bearish territory relative to the mid-zone.
4. Breakout Confirmation
o The labels show when a breakout has occurred, so traders can react quickly (e.g., enter with trend, wait for retest, or avoid fading moves).
________________________________________
🌍 Markets it works best in
• Crypto (Bitcoin, Ethereum, etc.): Very effective since crypto is breakout-driven and respects swing levels.
• Forex: Good for volatility-adaptive structure analysis, especially in trending pairs.
• Indices (SPX, NASDAQ, DAX, NIFTY): Useful for breakout trading during session opens or key news events.
• Commodities (Gold, Oil, Silver): Works well to define intraday ranges and breakout levels.
⚠️ Less useful in low-volatility, mean-reverting assets (like some penny stocks or sideways ranges), because breakouts may be rare or fake.
________________________________________
💡 How it adds value
• Strips away unnecessary complexity (no lagging averages).
• Focuses directly on what price is doing structurally.
• Adaptive → works across different markets & timeframes.
• Easy visualization → zones, trend coloring, breakout markers.
• Helps traders trade with the flow of the market, instead of guessing tops/bottoms.
________________________________________
👉 In short:
This indicator turns raw price action into clear, actionable zones.
It highlights when the market shifts from balance to breakout, so traders can align with momentum rather than fighting it.

Deviation from Mid MA5 & MA10 (%)Title:
Deviation from Mid-Price MA5 & MA10 (%)
Description:
This script calculates and displays the percentage deviation of the current mid-price from its 5-day and 10-day simple moving averages.
The mid-price is defined as the average of the open and close prices: (Open + Close) / 2
Instead of relying on traditional close-based MAs, this version uses mid-price to better reflect actual price flow by incorporating both the opening and closing values.
Main features:
Displays % deviation from both 5-day and 10-day mid-price moving averages
Better alignment with intraday reality due to gap-sensitive mid-price base
Smooths out erratic closing spikes for clearer signals
Helps identify overextended moves and potential pullback zones
Included lines:
Deviation from 5-day Mid MA
Deviation from 10-day Mid MA
Zero baseline for reference
Recommended for:
Traders seeking a cleaner measure of price deviation
Short-term pullback or re-entry strategy users
Anyone analyzing steady, low-volatility uptrends

Triple DEMA (Editable)3 Double exponential moving averages. (DEMA) are an improvement over Exponential Moving Average (EMA) because they allocate more weight to recent data points. The reduced lag results in a more responsive moving average, which helps short-term traders spot trend reversals quickly.

Imbalance RSI Divergence Strategy# Imbalance RSI Divergence Strategy - User Guide
## What is This Strategy?
This strategy identifies **imbalance** zones in the market and combines them with **RSI divergence** to generate trading signals. It aims to capitalize on price gaps left by institutional investors and large volume movements.
### Main Settings
- **RSI Period (14)**: Period used for RSI calculation. Lower values = more sensitive, higher values = more stable signals.
- **ATR Period (10)**: Period for volatility measurement using Average True Range.
- **ATR Stop Loss Multiplier (2.0)**: How many ATR units to use for stop loss calculation.
- **Risk:Reward Ratio (4.0)**: Risk-reward ratio. 2.0 = 2 units of reward for 1 unit of risk.
- **Use RSI Divergence Filter (true)**: Enables/disables the RSI divergence filter.
### Imbalance Filters
- **Minimum Imbalance Size (ATR) (0.3)**: Minimum imbalance size in ATR units to filter out small imbalances.
- **Enable Lookback Limit (false)**: Activates historical lookback limitations.
- **Maximum Lookback Bars (300)**: Maximum number of bars to look back.
### Visual Settings
- **Show Imbalance Size**: Displays imbalance size in ATR units.
- **Show RSI Divergence Lines**: Shows/hides divergence lines.
- **Divergence Line Colors**: Colors for bullish/bearish divergence lines.
### Volatility-Based Adjustments
- **Low volatility markets**:
- Minimum Imbalance Size: 0.2-0.4 ATR
- ATR Stop Loss Multiplier: 1.5-2.0
- **High volatility markets**:
- Minimum Imbalance Size: 0.5-1.0 ATR
- ATR Stop Loss Multiplier: 2.5-3.5
### Risk Tolerance
- **Conservative approach**:
- Risk:Reward Ratio: 2.0-3.0
- RSI Divergence Filter: Enabled
- Minimum Imbalance Size: Higher (0.5+ ATR)
- **Aggressive approach**:
- Risk:Reward Ratio: 4.0-6.0
- Minimum Imbalance Size: Lower (0.2-0.3 ATR)
###Market Conditions
- **Trending markets**: Higher RSI Period (21-28)
- **Sideways markets**: Lower RSI Period (10-14)
- **Volatile markets**: Higher ATR Multiplier
## Recommended Testing Procedure
1. **Start with default settings** and backtest on 3-6 months of historical data
2. **Adjust RSI Period** to see which value produces better results
3. **Optimize ATR Multiplier** for stop loss levels
4. **Test different Risk:Reward ratios** comparatively
5. **Fine-tune Minimum Imbalance Size** to improve signal quality
## Important Considerations
- **False positive signals**: Imbalances may be less reliable during low volatility periods
- **Market openings**: First hours often produce more imbalances but can be riskier
- **News events**: Consider disabling strategy during major news releases
- **Backtesting**: Test across different market conditions (trending, sideways, volatile)
## Recommended Settings for Beginners
**Safe settings for new users:**
- RSI Period: 14
- ATR Period: 14
- ATR Stop Loss Multiplier: 2.5
- Risk:Reward Ratio: 3.0
- Minimum Imbalance Size: 0.5 ATR
- RSI Divergence Filter: Enabled
## Advanced Tips
### Signal Quality Improvement
- **Combine with market structure**: Look for imbalances near key support/resistance levels
- **Volume confirmation**: Higher volume during imbalance formation increases reliability
- **Multiple timeframe analysis**: Confirm signals on higher timeframes
### Risk Management
- **Position sizing**: Never risk more than 1-2% of account per trade
- **Maximum drawdown**: Set overall stop loss for the strategy
- **Market hours**: Consider avoiding low liquidity periods
### Performance Monitoring
- **Win rate**: Track percentage of profitable trades
- **Average R:R**: Monitor actual risk-reward achieved vs. target
- **Maximum consecutive losses**: Set alerts for strategy review
This strategy works best when combined with proper risk management and market analysis. Always backtest thoroughly before using real money and adjust parameters based on your specific market and trading style.
