Bands and Channels

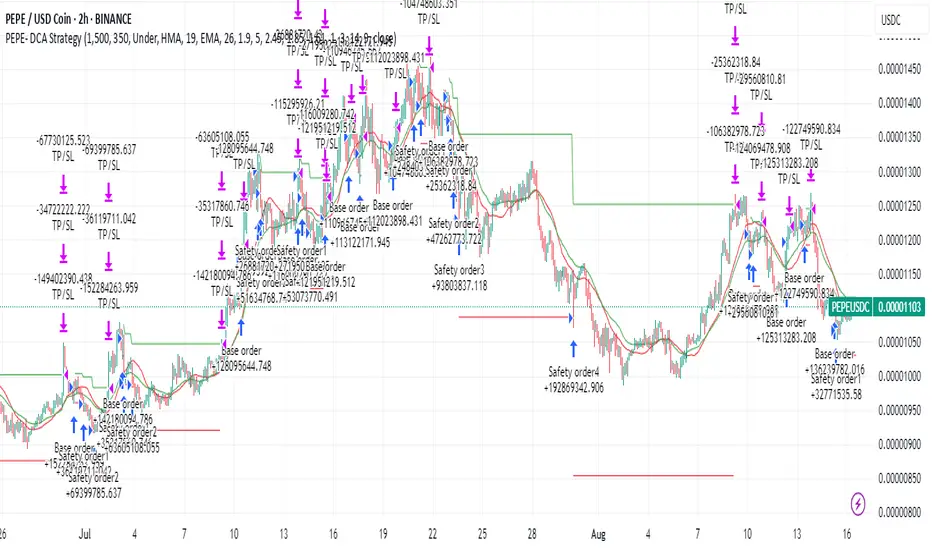
DCA Strategy on Steroids for CryptoThis strategy getting only in Long position for Crypto
Using Fast and Slow moving Averages and Stochastic RSI to get in Long position
Fast and Slow moving Averages - cross-under - I Prefer - or opposite for Bull Market
Stochastic RSI cross-over - 5 and Trend Determined by the Fast moving Average
There is no Stop loss is not for one with small tolerance to getting under
Fast and Slow moving Averages and Stochastic RSI Parameters can be adjust
The bot Use Safe Trades and Price Deviation Determined from the User
Max Safe Trades = 10
Take profit Parameters can be adjust in %
Pepe-USDC is just a example What the bot Can do
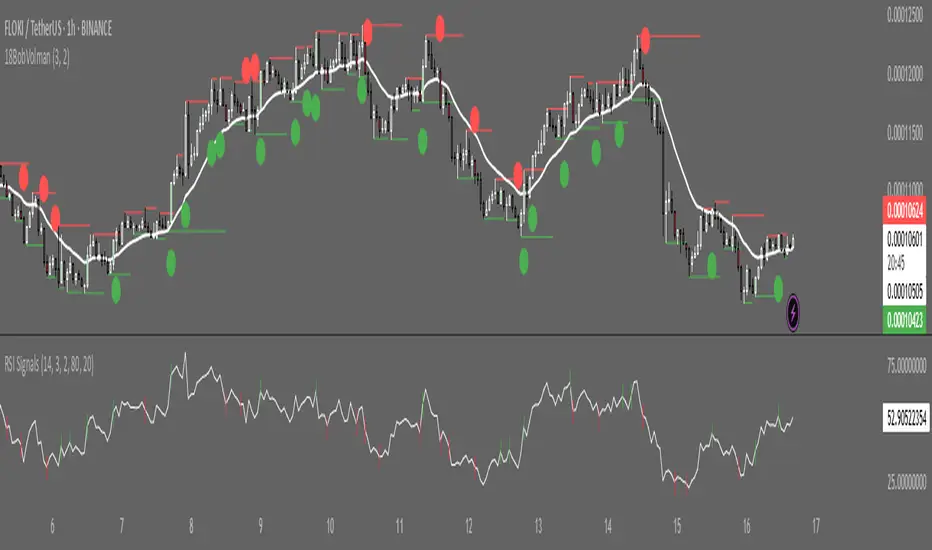
PenguintrendThe PenguinTrend is a momentum oscillator that identifies optimal buy and sell opportunities by detecting oversold and overbought market conditions. When the background turns green (oversold) it suggests a potential buying opportunity. When the background turns red (overbought) it signals a potential selling opportunity. The indicator automatically adjusts for market volatility and only generates signals when both extreme conditions are present and momentum is shifting, helping filter out false signals in ranging markets.

ATR-limited Donchian ChannelThe ATR-limited Donchian Channel is a modified version of the classic Donchian Channel that adapts more quickly to changing market conditions.
While a traditional Donchian Channel is based only on the highest high and lowest low over a given lookback period, this version introduces an ATR-based constraint that prevents the channel lines from extending too far away from price. This makes the channel more responsive and reduces lag compared to the standard Donchian Channel.
How it works
The upper band is based on the highest high of the last N candles, but it cannot exceed a maximum distance of ATR × Factor above the current median price (midpoint of high and low).
The lower band is based on the lowest low of the last N candles, but it cannot drop more than ATR × Factor below the median price.
If the Donchian Channel would normally extend further than this ATR-limited boundary, the line is capped and marked in blue .
Otherwise, the upper band is drawn in red and the lower band in green .
A middle line is also plotted as the average of the modified upper and lower bands.
An optional offset allows you to shift the channel backward or forward in time for easier visual alignment.
Why use this version?
Faster reaction: By constraining the channel with ATR, the indicator adapts quicker to volatility changes and avoids long periods of overextended levels.
Noise control: ATR filtering prevents extreme spikes or outlier highs/lows from stretching the channel unnecessarily.
Visual clarity: Color-coding highlights when ATR filtering is active, making it easy to distinguish capped vs. natural Donchian levels.
Typical use cases
Trend-following breakout systems, but with volatility-aware limits.
Identifying dynamic support and resistance zones that adjust to market conditions.
Filtering false breakouts by monitoring when the Donchian channel is capped by ATR.
✅ This indicator is designed for traders who want the structure of a Donchian Channel but with an adaptive, volatility-sensitive adjustment that makes it react faster and more reliably than the classic version.

Trader Marks Trailing SL + TP (Long & Short, mirrored)📌 Trader Marks Trailing SL + TP (Long & Short, mirrored)
This script implements an advanced trailing stop and take-profit system for both long and short trades.
It combines fixed entry/TP levels with a progressive looping mechanism that dynamically adjusts the trailing stop.
🔑 Key Features
Long & Short mirrored
The script works symmetrically for both long and short setups.
Fixed or percentage-based Take-Profit
You can either set a fixed TP price or have it calculated automatically as entry ± percentage distance.
Progressive Trailing Stop with Looping Mechanism
The stop-loss moves progressively towards the take-profit depending on price development.
For longs, the SL only moves upward (never lower).
For shorts, the SL only moves downward (never higher).
The looping exponent (tightPower) controls how strongly the gap between price and SL “tightens” over time:
Smaller values (e.g. 1.0) → gentle tightening, SL follows loosely.
Larger values (e.g. 3.0) → aggressive tightening, SL closes in on price faster.
Dynamic Minimum Distance
Default: 0.9 % distance from price.
As soon as the stop-loss touches the current or previous candle → automatic switch to 1.5 %.
Once the next candle no longer touches the SL → it reverts back to 0.9 %.
Lock at TP
Option to pull the SL exactly to the TP level once it is reached.
Automatic Reset
If any inputs change (Entry, TP, Trade Direction), the SL can be re-initialized automatically.
🎨 Visualization
Blue line → Entry level
Teal line → Take-profit level
Red line → Dynamic trailing stop
The data window also shows whether the tight mode (1.5 %) is currently active.

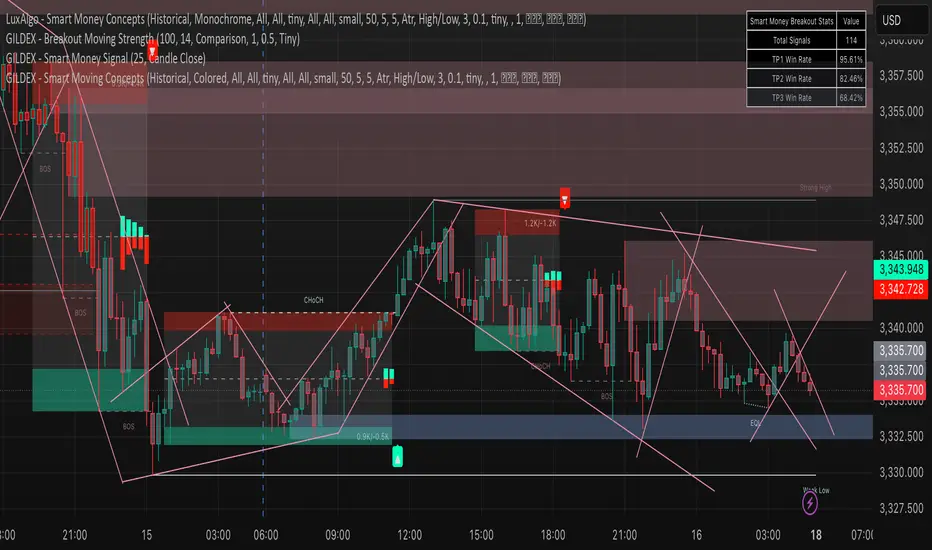
Smart Moving Concepts [GILDEX]This all-in-one indicator displays real-time market structure (internal & swing BOS / CHoCH), order blocks, premium & discount zones, equal highs & lows, and much more...allowing traders to automatically mark up their charts with widely used price action methodologies. Following the release of our Fair Value Gap script, we received numerous requests from our community to release more features in the same category.
"Smart Money Concepts" (SMC) is a fairly new yet widely used term amongst price action traders looking to more accurately navigate liquidity & find more optimal points of interest in the market. Trying to determine where institutional market participants have orders placed (buy or sell side liquidity) can be a very reasonable approach to finding more practical entries & exits based on price action.
The indicator includes alerts for the presence of swing structures and many other relevant conditions.
Features
This indicator includes many features relevant to SMC, these are highlighted below:
Full internal & swing market structure labeling in real-time
Break of Structure (BOS)
Change of Character (CHoCH)
Order Blocks (bullish & bearish)
Equal Highs & Lows
Fair Value Gap Detection
Previous Highs & Lows
Premium & Discount Zones as a range
Options to style the indicator to more easily display these concepts
Settings
Mode: Allows the user to select Historical (default) or Present, which displays only recent data on the chart.
Style: Allows the user to select different styling for the entire indicator between Colored (default) and Monochrome.
Color Candles: Plots candles based on the internal & swing structures from within the indicator on the chart.
Internal Structure: Displays the internal structure labels & dashed lines to represent them. (BOS & CHoCH).
Confluence Filter: Filter non-significant internal structure breakouts.
Swing Structure: Displays the swing structure labels & solid lines on the chart (larger BOS & CHoCH labels).
Swing Points: Displays swing points labels on chart such as HH, HL, LH, LL.
Internal Order Blocks: Enables Internal Order Blocks & allows the user to select how many most recent Internal Order Blocks appear on the chart.
Swing Order Blocks: Enables Swing Order Blocks & allows the user to select how many most recent Swing Order Blocks appear on the chart.
Equal Highs & Lows: Displays EQH/EQL labels on chart for detecting equal highs & lows.
Bars Confirmation: Allows the user to select how many bars are needed to confirm an EQH/EQL symbol on chart.
Fair Value Gaps: Displays boxes to highlight imbalance areas on the chart.
Auto Threshold: Filter out non-significant fair value gaps.
Timeframe: Allows the user to select the timeframe for the Fair Value Gap detection.
Extend FVG: Allows the user to choose how many bars to extend the Fair Value Gap boxes on the chart.
Highs & Lows MTF: Allows the user to display previous highs & lows from daily, weekly, & monthly timeframes as significant levels.
Premium/Discount Zones: Allows the user to display Premium, Discount, and Equilibrium zones on the chart
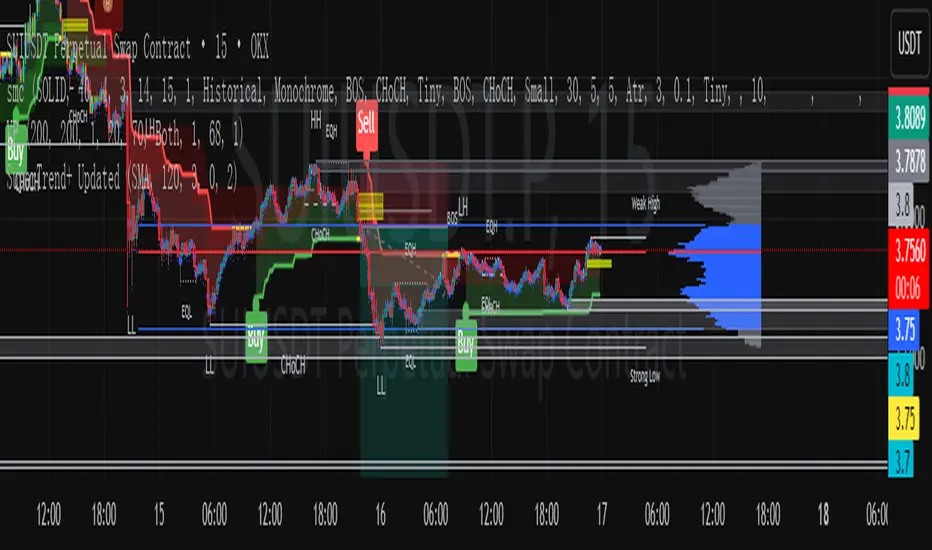
SuperTrend+ UpdatedSuperTrend+ with SL/TP is a technical analysis tool designed to identify market trends and potential trading opportunities. Based on the SuperTrend indicator, it incorporates additional features including stop loss and take profit level calculations.
The indicator visually displays uptrends and downtrends through colored lines and background highlighting, making trend direction easy to identify. It generates buy and sell signals when trend reversals are detected, with optional volume filtering to reduce false signals.
Key features include customizable ATR parameters, multiple calculation methods for stop loss and take profit levels (ATR-based or fixed percentage), and clear visual markers for entry points and target levels.
Ideal for traders looking to identify trend directions and manage risk with predefined exit levels, this indicator works across various timeframes and financial instruments.
SONIC R BREAK FINAL (VER5)
Purpose: Capture breakouts through Support/Resistance (S/R) zones based on Pivot and filter signals using EMA 34 (High/Low/Close), EMA 89, volume, and candle structure. Includes a Higher Timeframe (H4) RSI risk warning (visual only, does not block entries).
How it works
S/R zones from Pivot
Draws Resistance and Support using ta.pivothigh/ta.pivotlow with Left/Right Bars.
S/R lines are locked with offset to reduce repaint.
EMA trend filters
EMA34 High/Low/Close build a “EMA 34 band”.
EMA89 works as the main trend filter.
Trend conditions:
Long: close above all EMA34 High/Low/Close and EMA89.
Short: close below all EMA34 High/Low/Close and EMA89.
Volume filter (optional)
Signal valid only if Volume > SMA(Volume, n).
Wick filter
Each wick (upper/lower) ≤ 50% of candle range to avoid weak breakouts.
Higher TF RSI risk (H4)
Fetches RSI from a higher timeframe (default H4).
If RSI exceeds threshold, breakout labels turn gray (risk warning only).
Anti-repeat mechanism
Each new pivot resets trigger.
Each S/R level triggers only once until the next pivot is formed.
Signals & Alerts
Label “B” (green) below candle: breakout above Resistance, valid EMA/Volume/Wick conditions.
Label “S” (red) above candle: breakout below Support, valid EMA/Volume/Wick conditions.
Gray labels = H4 RSI risk warning.
Unified alert: “S/R Breakout (Unified)” with message B=Buy, S=Sell, Gray=Risk.
Parameters
Show Breaks: toggle breakout detection.
Left/Right Bars: pivot sensitivity.
Require Volume > Average + Volume MA Length: volume filter.
Use H4 RSI Risk Warning: enable higher TF RSI check.
RSI Length, Higher TF (minutes), RSI thresholds for Buy/Sell risk.
Usage tips
Prioritize trades in the same direction as EMA89 and EMA34 trend.
Works on M5 to H4; best combined with RSI H4 when trading M15/M30.
Place SL behind the S/R just broken, TP by fixed RR or EMA trailing.
Increase Left/Right Bars for stronger zones and less noise in sideways markets.
Notes
Pivot still has repaint element (mitigated by offset).
This indicator is not financial advice. Always combine with proper risk management.
Version
Clean v4: added wick ≤50% filter, H4 RSI risk coloring, volume filter, anti-repeat pivot trigger, unified alert, EMA34 H/L/C background shading.
[QD] RSI Signal DetectionUpdate my script related to RSI
Update my script related to RSI
Update my script related to RSI
Update my script related to RSIUpdate my script related to RSIUpdate my script related to RSI
Rolling Volatility BandsMake sure to view it from the 1D candlestick chart.
The Rolling Volatility Bands indicator provides a statistically-driven approach to visualizing expected daily price movements using true volatility calculations employed by professional options traders. Unlike traditional Bollinger Bands which use price standard deviation around a moving average, this indicator calculates actual daily volatility from log returns over customizable rolling periods (20-day and 60-day), then annualizes the volatility using the standard √252 formula before projecting forward-looking probability bands. The 1 Standard Deviation bands represent a ~68% probability zone where price is expected to trade the following day, while the 2 Standard Deviation bands capture ~95% of expected movements. This methodology mirrors how major exchanges calculate expected moves for earnings and FOMC events, making it invaluable for options strategies like iron condors during low-volatility periods (narrow bands) or directional plays when volatility expands. The indicator works on any timeframe while always utilizing daily candle data via security() calls, ensuring consistent volatility calculations regardless of your chart resolution, and includes real-time annualized volatility percentages plus daily expected range statistics for comprehensive market analysis.

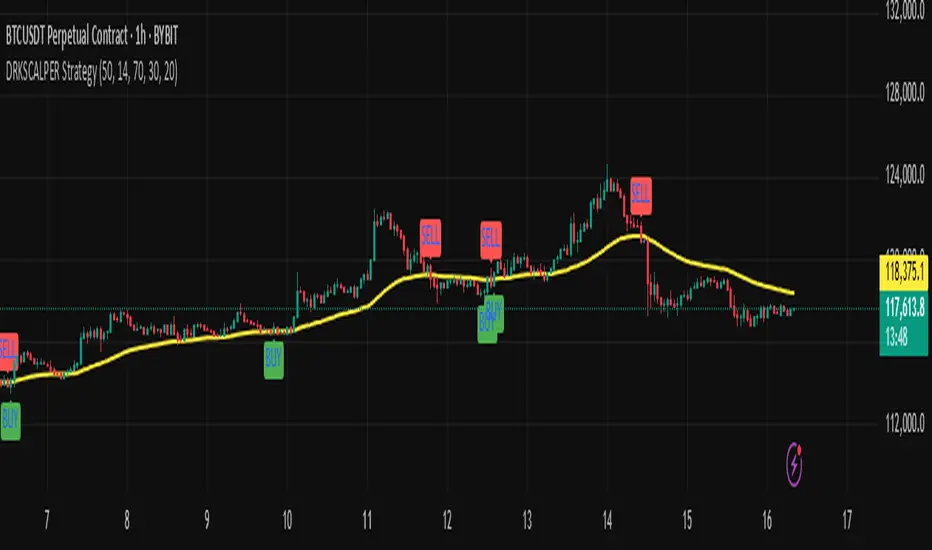
DRKSCALPER Strategy"This indicator is designed to help traders identify market structure shifts, order blocks, and liquidity zones. It is useful for scalping and swing trading, and works on multiple timeframes."
CleanBreak Lines (Break + First Retest)CleanBreak lines draws one robust support line (green) from swing lows and one robust resistance line (red) from swing highs, then optionally signals a confirmed break and the first clean retest back to that line. Lines are scored with a transparent W-Score (0–100) so traders can judge quality at a glance. The script is non-repainting and uses only confirmed bar data.
What it does
Auto-builds two trendlines that aim to represent meaningful support and resistance.
Uses a median-based slope so outliers and single spikes do not distort the line.
Computes a W-Score per line from three things: touches, span (how long it held), and respect (staying on the correct side).
Optionally triggers a single, tightly-gated signal on Break + First Retest.
How it works (plain English)
Detect recent swing highs and swing lows.
Fit one line through highs and one through lows using a robust, median-style slope estimate.
Score each line: more clean touches and longer span raise the W-Score; frequent violations lower it.
A break requires a candle close beyond the line by a small ATR margin.
A first retest requires price to come back to the line within a limited number of bars and hold on close.
A single arrow may print on that confirmed retest, with optional alerts.
What it is not
Not a prediction model and not a promises-of-profit tool.
Not a multi-signal spammer: by design it aims to allow one retest entry per break.
Not a regression channel or machine-learning system.
How to use
At a glance: treat the green line as candidate support and the red line as candidate resistance.
Conservative approach: wait for a break on close and then the first retest to hold; use the arrow as a prompt, not a command.
Context-only mode: hide arrows in Style if you want the lines and W-Score only.
Inputs (brief)
Core: Swing Length, Max Pivots, Min Touches, Min Span Bars.
Scoring: Touches Max (cap), Weights for touches vs span, Min W-Score to arm.
Break and Retest: Break Margin x ATR, Retest Tolerance x ATR, Retest Window (bars).
Visuals: Show Labels, Show Table, Line Width, Fade When Refit.
Recommended presets
Cleaner, fewer signals: Min Touches 4–5, Min Span Bars 100–150, Min W-Score 70–80, Break Margin 0.40–0.60 ATR, Retest Tolerance 0.10–0.15 ATR, Retest Window 8–12 bars.
Lines-only: keep defaults and uncheck the two plotshapes in Style.
Alerts
CB Long Retest: break above the red line and first retest holds.
CB Short Retest: break below the green line and first retest holds.
Use “Once per bar close” for consistency.
On-chart table (if enabled)
RES / SUP: W-Score and distance from price in ATR terms.
Status: “Waiting Long RT”, “Waiting Short RT”, or “Idle”.
Thresholds: MinScore and Retest bars for quick context.
Timeframes
Works well on 1h to 1D. On very low timeframes, raise Break Margin x ATR to reduce whipsaw effects. On higher timeframes, increase Min Touches and Min Span Bars.
Non-repainting policy
All logic uses confirmed pivots and confirmed bar closes.
Breaks and retests are validated on close; alerts reference only confirmed conditions.
No lookahead in any request.security call.
Original implementation focused on a median-based robust slope for auto trendlines, plus a transparent W-Score and a single retest gate.
Disclosure
This script is for education and charting. It does not guarantee outcomes, and past behavior does not imply future results. Always validate on historical data and practice risk management.

[L2] Enhanced MACD Support-Kisslooking for support line, before pumping, script can find where possible points for enter

Previous High/Low Range (D,W,M)Previous High/Low Range (D,W,M)
This indicator displays the previous period’s High, Low, and 50% Midpoint levels for the Day, Week, and Month. It visually extends these levels into the future for easy reference, helping traders identify key support and resistance zones. Users can customize the visibility, colors, and line styles for each timeframe, and optionally show labels and a dashed midpoint line for clearer analysis. Ideal for trend analysis and spotting potential reversal points.

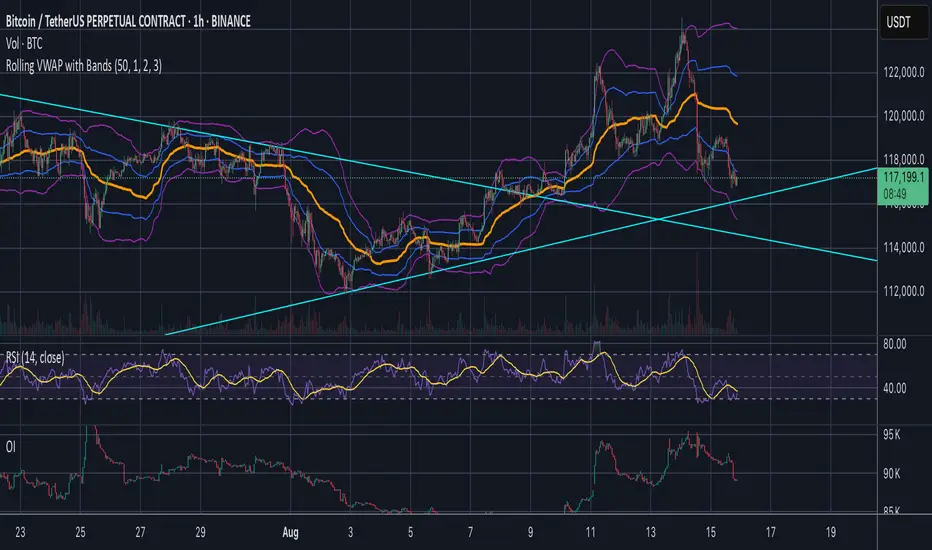
Jose's Rolling VWAP with BandsRolling VWAP with Customizable Deviation Bands
This indicator plots a rolling Volume Weighted Average Price (VWAP) over a user-defined lookback period, rather than resetting each day or from a fixed anchor point. The rolling calculation makes it act more like a moving average — but weighted by volume — providing a smoother, more adaptive central price line.
It also includes up to three optional deviation bands, which can be independently toggled on/off and assigned their own multipliers. These bands are calculated using the chosen lookback’s standard deviation, giving traders a quick visual of price dispersion around VWAP.
Features:
Adjustable rolling VWAP lookback length
Up to 3 customizable standard deviation bands
Individual checkboxes for enabling/disabling each band
Independent multiplier control for each band
Works on any timeframe and symbol
Uses:
Identify overextended price moves relative to VWAP
Spot dynamic support/resistance zones
Gauge mean reversion opportunities
Confirm trend strength when price hugs or breaks away from VWAP
Multiple Session Pre-market High/LowThis indicator marks each day’s pre-market range and projects it into the opening move so you can see how price reacts after the bell. It tracks the **pre-market high/low** within a user-defined window (default **04:00–09:29 ET**) and, at **09:30 ET**, draws two solid horizontal lines from **09:30 to 11:00 ET** at those levels. For additional context, you can optionally show matching **dotted lines** across the pre-market window itself. Everything is anchored to **America/New\_York** time (DST-safe), and colors/widths for both the RTH and pre-market lines are fully customizable.
It’s built for **back testing and review**: levels are finalized at 09:30 and **do not repaint**, so what you see historically is what you would have had live. Use it to study opening drive behavior, VWAP/OR confluence, gap fills, and rejection/acceptance around the pre-market extremes. Works on any intraday timeframe; for stocks, enable **Extended Hours** so the 04:00–09:29 bars are available (futures usually include them by default). Adjust the pre-market start/end inputs to match your playbook (e.g., 07:00–09:29) and evaluate your strategies consistently across months of data.

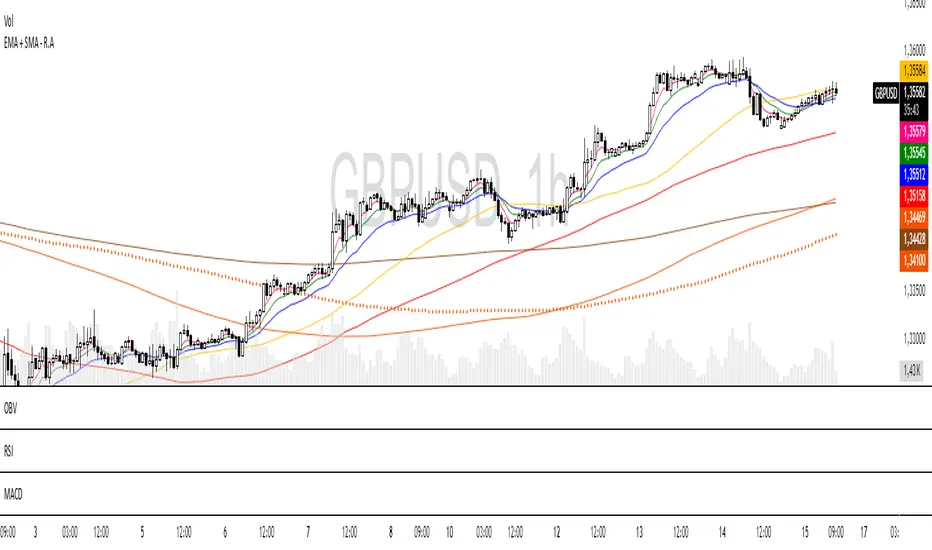
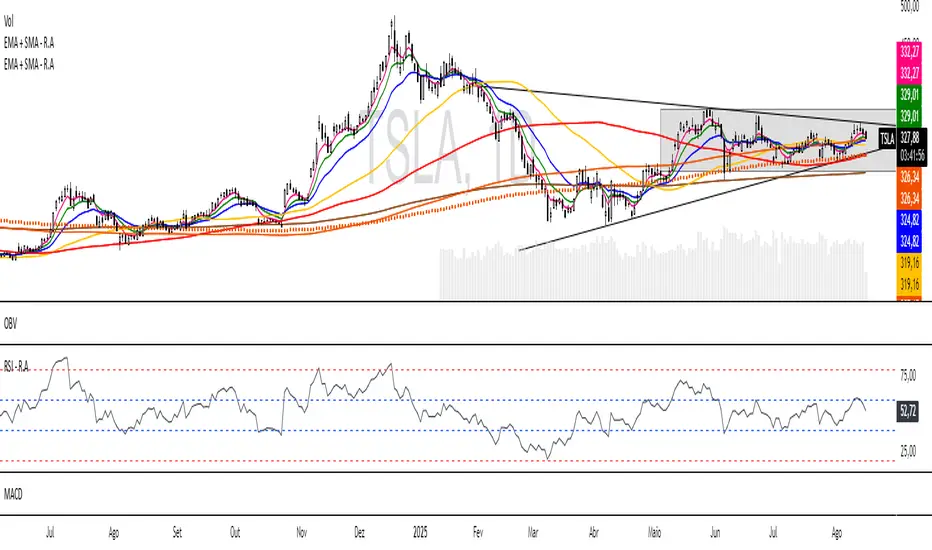
EMA + SMA - R.AR.A. Trader - Multi-MA Suite (EMA & SMA)
1. Overview
Welcome, students of R.A. Trader!
This indicator is a powerful and versatile tool designed specifically to support the trading methodologies taught by Rudá Alves. The R.A. Trader Multi-MA Suite combines two fully customizable groups of moving averages into a single, clean indicator.
Its purpose is to eliminate chart clutter and provide a clear, at-a-glance view of market trends, momentum, and dynamic levels of support and resistance across multiple timeframes. By integrating key short-term and long-term moving averages, this tool will help you apply the R.A. Trader analytical framework with greater efficiency and precision.
2. Core Features
Dual Moving Average Groups: Configure two independent sets of moving averages, perfect for separating short-term (EMA) and long-term (SMA) analysis.
Four MAs Per Group: Each group contains four fully customizable moving averages.
Multiple MA Types: Choose between several types of moving averages for each group (SMA, EMA, WMA, HMA, RMA).
Toggle Visibility: Easily show or hide each group with a single click in the settings panel.
Custom Styling: Key moving averages are styled for instant recognition, including thicker lines for longer periods and a special dotted line for the 250-period SMA.
Clean and Efficient: The code is lightweight and optimized to run smoothly on the TradingView platform.
Group 1 (Default: EMAs)
This group is pre-configured for shorter-term Exponential Moving Averages but is fully customizable.
Setting Label Description
MA Type - EMA Select the type of moving average for this entire group (e.g., EMA, SMA).
EMA 5 Sets the period for the first moving average.
EMA 10 Sets the period for the second moving average.
EMA 20 Sets the period for the third moving average.
EMA 400 Sets the period for the fourth moving average.
Show EMA Group A checkbox to show or hide all MAs in this group.
Exportar para as Planilhas
Group 2 (Default: SMAs)
This group is pre-configured for longer-term Simple Moving Averages, often used to identify major trends.
Setting Label Description
MA Type - SMA Select the type of moving average for this entire group.
SMA 50 Sets the period for the first moving average.
SMA 100 Sets the period for the second moving average.
SMA 200 Sets the period for the third moving average.
SMA 250 Sets the period for the fourth moving average (styled as a dotted line).
Show SMA Group A checkbox to show or hide all MAs in this group.
RSI - (R.A Trader)Of course. Here is a descriptive text in English for the custom RSI indicator, written for the students of R.A. Trader.
The R.A. Trader Custom RSI Indicator
1. Overview
Welcome, students of R.A. Trader!
This is the official custom Relative Strength Index (RSI) indicator designed specifically to support the analytical methods taught by Rudá Alves. This tool replaces the standard RSI with a specialized configuration, providing a more nuanced view of market momentum that aligns directly with the R.A. Trader strategy.
Its purpose is to help you quickly and accurately identify key zones of strength, weakness, and potential market exhaustion.

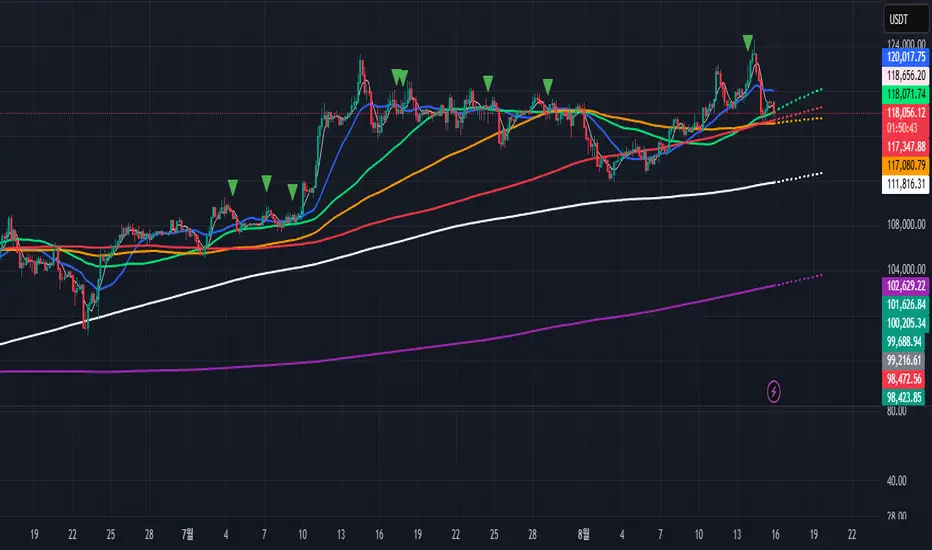
Coin Jin Multi SMA+ BB+ SMA forecast Ver 2.0Coin Jin Multi SMA + BB + SMA Forecast 2.0
개요
여러 개의 단순이동평균(SMA: 5/20/60/112/224/448/896 + 사용자 정의 X1/X2), 볼린저 밴드(BB), 그리고 접선 기반 곡선 예측선을 한 번에 표시합니다. 예측선은 선형회귀 기울기와 그 변화율(가속도)을 EMA로 스무딩해 곡선 외삽으로 앞으로 그려지며, 어떤 줌에서도 깔끔하게 보이도록 점선(dotted) 스타일을 강제할 수 있습니다.
스택 마커(정배열/역배열) 안내
조건: 이동평균이 정배열(5>20>60>112>224>448>(896)) 또는 역배열(5<20<60<112<224<448<(896))로 새로 전환되는 순간 삼각형 마커가 생성됩니다.
896일선 포함(with 896): SOLID 마커로 표시, Bull = 초록색, Bear = 빨간색.
896일선 미포함(no 896): HOLLOW(윤곽) 마커로 표시, 시선을 덜 끌도록 투명도 70 적용(Bull = 연두, Bear = 빨강 동일색).
방향: Bull = ▼(위, abovebar) / Bear = ▲(아래, belowbar) 로 배치됩니다.
주요 기능
SMA 7종 기본 + 사용자 정의 SMA 2개(X1/X2) 추가(기본 꺼짐, 길이/색/두께/타입 자유).
BB: 길이/배수/선두께/밴드 채움(기본 90% 투명) 지원.
예측선: Forward bars(1–100, 기본 30), 기울기 산출 길이, 스무딩 강도, 세그먼트 개수, 점/대시 스타일 선택 및 도트 강제.
스택(정/역배열) 전환 마커: with 896=SOLID, no 896=HOLLOW(투명도 70).
처음 사용하는 분들을 위한 팁 (중요)
가격 스케일을 ‘우측’으로 고정하세요.
방법 ① 차트 우측 축을 사용(기본).
방법 ② 지표 레전드의 ‘⋯’ 메뉴 → Move to → Right scale.
예측선이 본선과 어긋나 보이면 스케일이 좌측/양측으로 되어 있거나 자동 합침된 경우이니 Right scale로 맞춰주세요.
입력 요약
MA Source, 각 SMA on/off·길이·색·두께·타입
BB length/mult/width/fill/opacity(기본 90)
Forecast bars ahead(1–100), slope lookback, smoothing, segments, style/opacity, 적용 대상 선택(SMA별)
주의/면책
예측선은 가격 예언 도구가 아니라 시각적 외삽 보조지표입니다. 단독 매매 판단에 사용하지 마세요.
공개 스크린샷은 본 지표만 보이도록 깔끔하게 캡처해 주세요(다른 지표/드로잉 혼합 금지).
변경사항(v2.0)
곡선 예측선 안정화 및 도트 강제 개선.
스택 마커 no 896 상태 HOLLOW 투명도 70 적용(가독성 향상).
사용자 정의 SMA X1/X2 추가(기본 OFF).
Coin Jin Multi SMA + BB + SMA Forecast 2.0 (English)
Overview
This indicator plots multiple Simple Moving Averages (SMA: 5/20/60/112/224/448/896 + two user-defined X1/X2), Bollinger Bands, and a tangent-based curved forecast in one overlay. The forecast extrapolates forward using the linear-regression slope and its rate of change (acceleration) smoothed by EMA, and you can force a dotted look so it stays clean at any zoom level.
Stack Markers (Bullish/Bearish alignment)
Markers appear only when a full bullish stack (5>20>60>112>224>448>(896)) or bearish stack (5<20<60<112<224<448<(896)) is newly formed.
With 896 included: shown as SOLID triangles — Bull = green, Bear = red.
Without 896: shown as HOLLOW (outline) with 70 transparency to reduce visual weight — Bull = lime, Bear = red (same hue).
Orientation: Bull = ▼ abovebar, Bear = ▲ belowbar.
Features
7 standard SMAs + two custom SMAs (X1/X2) (default OFF; fully configurable length/color/width/style).
BB with length/multiplier/width/fill (default fill opacity 90%).
Forecast controls: forward bars (1–100, default 30), slope window, smoothing, segment count, style/opacity, force dotted option.
Stack markers: with 896 = SOLID, without 896 = HOLLOW (70 transparency).
First-time setup (Important)
Pin the indicator to the Right price scale.
Option A: Use the right price axis.
Option B: Indicator legend “⋯” → Move to → Right scale.
If the forecast appears detached from the MA, your series is likely on the left/both scales; switch to Right scale.
Inputs
MA source; per-SMA on/off, length, color, width, style
BB length/multiplier/width/fill/opacity (default 90)
Forecast bars ahead (1–100), slope lookback, smoothing, segments, style/opacity, per-SMA apply switches
Disclaimer
The forecast is a visual extrapolation, not a price prediction. Do not use it alone to make trading decisions.
For publication, please use a clean screenshot that shows only this indicator (no mixed overlays).
What’s new in v2.0
More robust curved forecast with improved “force dotted” rendering.
HOLLOW (no 896) markers now use 70 transparency for better readability.
Added two user-defined SMAs (X1/X2), OFF by default.
EMA + SMA - R.AR.A. Trader - Multi-MA Suite (EMA & SMA)
1. Overview
Welcome, students of R.A. Trader!
This indicator is a powerful and versatile tool designed specifically to support the trading methodologies taught by Rudá Alves. The R.A. Trader Multi-MA Suite combines two fully customizable groups of moving averages into a single, clean indicator.
Its purpose is to eliminate chart clutter and provide a clear, at-a-glance view of market trends, momentum, and dynamic levels of support and resistance across multiple timeframes. By integrating key short-term and long-term moving averages, this tool will help you apply the R.A. Trader analytical framework with greater efficiency and precision.
2. Core Features
Dual Moving Average Groups: Configure two independent sets of moving averages, perfect for separating short-term (EMA) and long-term (SMA) analysis.
Four MAs Per Group: Each group contains four fully customizable moving averages.
Multiple MA Types: Choose between several types of moving averages for each group (SMA, EMA, WMA, HMA, RMA).
Toggle Visibility: Easily show or hide each group with a single click in the settings panel.
Custom Styling: Key moving averages are styled for instant recognition, including thicker lines for longer periods and a special dotted line for the 250-period SMA.
Clean and Efficient: The code is lightweight and optimized to run smoothly on the TradingView platform.
Group 1 (Default: EMAs)
This group is pre-configured for shorter-term Exponential Moving Averages but is fully customizable.
Setting Label Description
MA Type - EMA Select the type of moving average for this entire group (e.g., EMA, SMA).
EMA 5 Sets the period for the first moving average.
EMA 10 Sets the period for the second moving average.
EMA 20 Sets the period for the third moving average.
EMA 400 Sets the period for the fourth moving average.
Show EMA Group A checkbox to show or hide all MAs in this group.
Exportar para as Planilhas
Group 2 (Default: SMAs)
This group is pre-configured for longer-term Simple Moving Averages, often used to identify major trends.
Setting Label Description
MA Type - SMA Select the type of moving average for this entire group.
SMA 50 Sets the period for the first moving average.
SMA 100 Sets the period for the second moving average.
SMA 200 Sets the period for the third moving average.
SMA 250 Sets the period for the fourth moving average (styled as a dotted line).
Show SMA Group A checkbox to show or hide all MAs in this group.
Exportar para as Planilhas