Two Dot Closed 5ma VarianceThe concept behind this indicator is I have worked with a 5 simple moving average for a very long time. More significantly I changed the mode of the ma from a line to a DOT format. While price action moves upward the 5 MA stretches its values between bars, doing the same as it moves down. This becomes so much more obvious in DOT format. It is the turning points of direction where the variance between the DOTS of the 5 MA closes. Flattening the DOTS!
I created this indicator for XAUUSD 30 minute chart. Do with as you see fit. The indicator has a function that you can assign a MAX and MIN variance of the 5 MA right down to 0.10 cents. If closing value of 5 MA is within your set amount an ALERT is given. The actual variance is given in the leading flag and is of the prior 2 closed values.
Bands and Channels

Ethereum Logarithmic Regression BandsOverview
This indicator displays logarithmic regression bands for Ethereum. Logarithmic regression is a statistical method used to model data where growth slows down over time. I initially created these bands in 2021 using a spreadsheet, and later coded them in TradingView in 2022. Over time, the bands proved effective at capturing bull market peaks and bear market lows. In 2025, I decided to share this indicator because I believe these logarithmic regression bands offer the best fit for the Ethereum chart.
How It Works
The logarithmic regression lines are fitted to the Ethereum (ETHUSD) chart using two key factors: the 'a' factor (slope) and the 'b' factor (intercept). The formula for logarithmic regression is 10^((a * ln) - b).
How to Use the Logarithmic Regression Bands
1. Lower Band:
The lower (blue) band forms a potential support area for Ethereum’s price. Historically, Ethereum has found its lows within this band during past market cycles. When the price is within the lower band, it suggests that Ethereum is undervalued.
2. Upper Band:
The upper (red) band forms a potential resistance area for Ethereum’s price. The logarithmic band is fitted to the past two market cycle peaks; therefore, there is not enough historical data to be sure it will reach the upper band again. However, the chance is certainly there! If the price is within the upper band, it indicates that Ethereum is overvalued and that a potential price correction may be imminent.

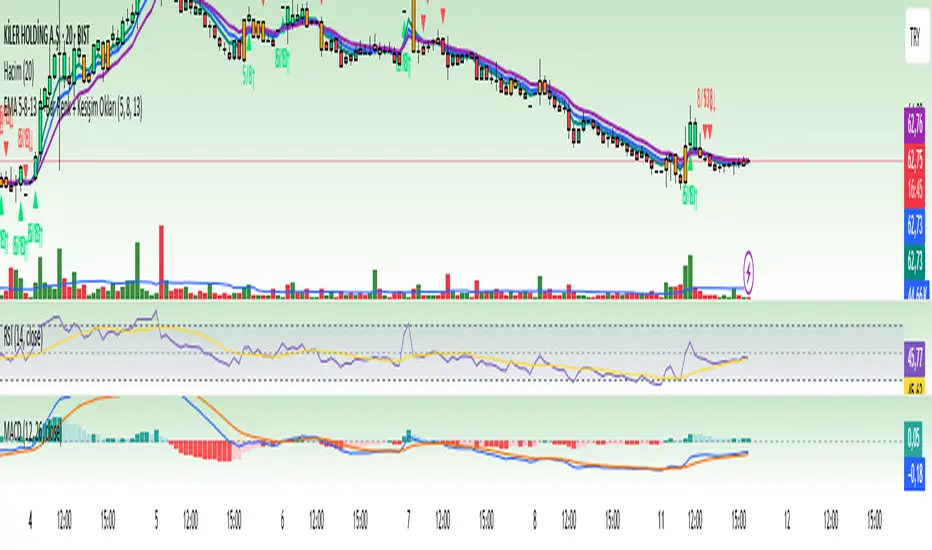
parademi 5-8-13EMA 5-8-13 Trend & Crossover Indicator
This indicator helps you identify market trends and potential reversal points in a single tool. It uses three Exponential Moving Averages (EMA 5, EMA 8, and EMA 13) to determine trend direction and highlight important crossover signals.
Features:
Trend Detection:
When the price is above all three EMAs (5, 8, and 13), candles are colored green, indicating a strong uptrend.
When the price crosses EMA 8, candles turn orange, signaling a possible short-term change in momentum.
Crossover Signals:
When EMA 5 crosses above EMA 8, a green arrow appears below the candle, suggesting a potential buy signal.
When EMA 5 crosses below EMA 8, a red arrow appears above the candle, suggesting a potential sell signal.
Optional EMA 8 and EMA 13 crossover signals can also be displayed using the same logic.
Purpose:
This indicator visually clarifies trend direction and marks potential entry/exit points. It can be used on its own or combined with other technical tools such as volume, support/resistance levels, or momentum indicators for higher accuracy.
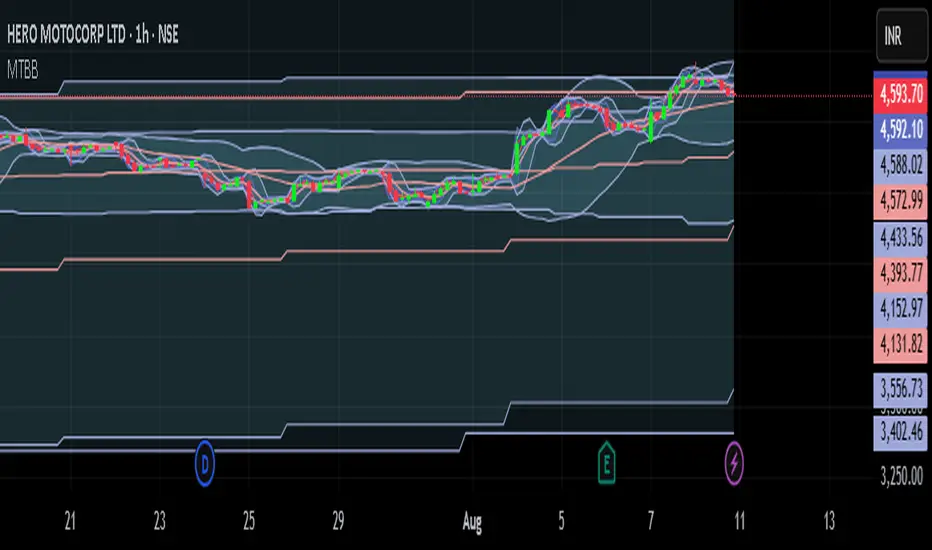
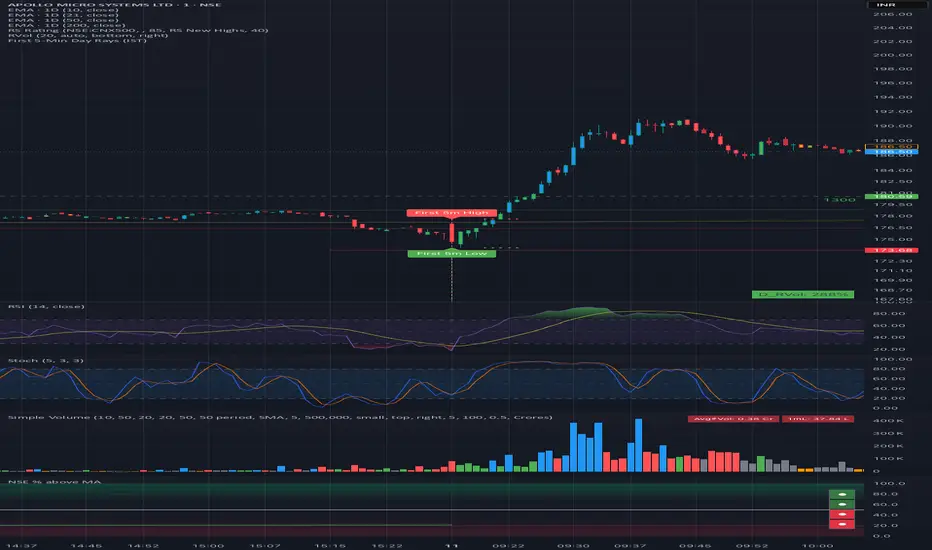
915 Candle High/Low RaysDraws horizontal rays from the high and low of the first 5-minute candle for any selected date in the NSE equity session (09:15–15:30). Features include:
- Date picker for any trading day (defaults to today, exchange timezone)
- Session-limited rays (do not extend past the session end)
- Option to project levels to all timeframes
- Customizable ray style, label display, and color
- Optional breakout alerts for high/low crossing
- Designed for Indian markets and any NSE equity symbol

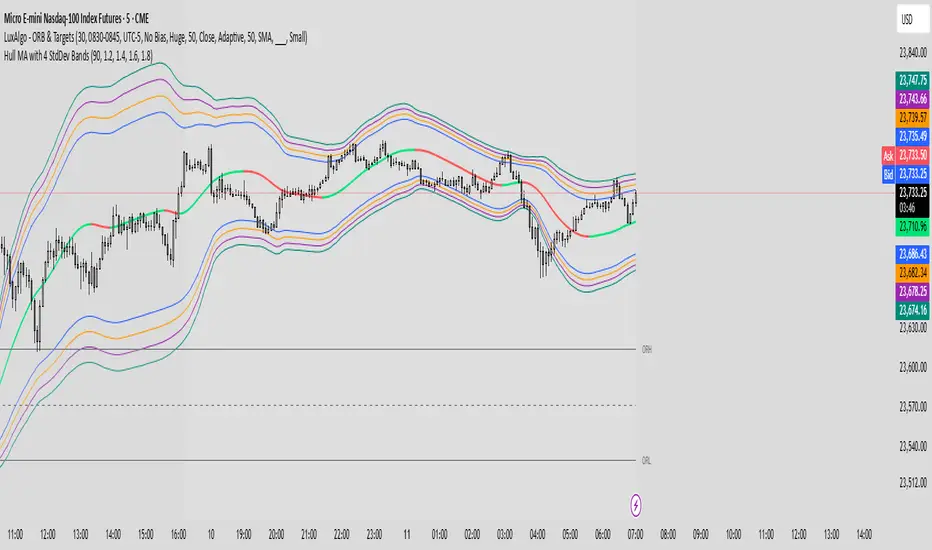
Hull MA with 4 StdDev Bandsull MA with Multi-StdDev Bands
This indicator plots a Hull Moving Average (HMA) of (High + Low) / 2 with a default length of 90, surrounded by four customizable standard deviation bands.
Features:
Dynamic Hull MA coloring: Green when price trend is rising, red when falling.
Customizable deviation levels: Default set to 1.2, 1.4, 1.6, and 1.8 standard deviations, adjustable in the settings.
4 upper and 4 lower volatility bands: Based on the standard deviation of price relative to the Hull MA, providing a clear visual of potential overbought and oversold zones.
Uses:
Identify trend direction quickly via Hull MA color change.
Monitor volatility expansion/contraction.
Spot potential reversal or breakout areas when price interacts with outer bands.
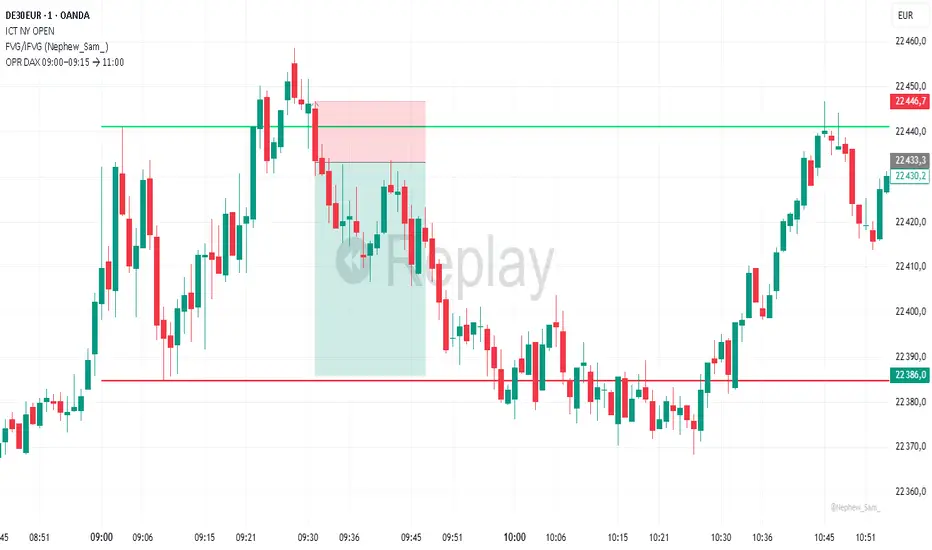
OPR DAX 09:00–09:15 → 11:00 Nico VThis indicator plots on the DAX each day:
The high (green) and low (red) of the 09:00 → 09:15 Berlin time range.
These levels are extended horizontally until 11:00.
Optionally, it displays the midpoint as a white dashed line.
Purpose: to quickly identify the morning opening range (OPR) and observe how price reacts to these levels during the rest of the morning.
915 Opening Range RaysDraws the high and low of the 09:15–09:20 first 5-min candle each day as horizontal rays with options for extension and alerts.
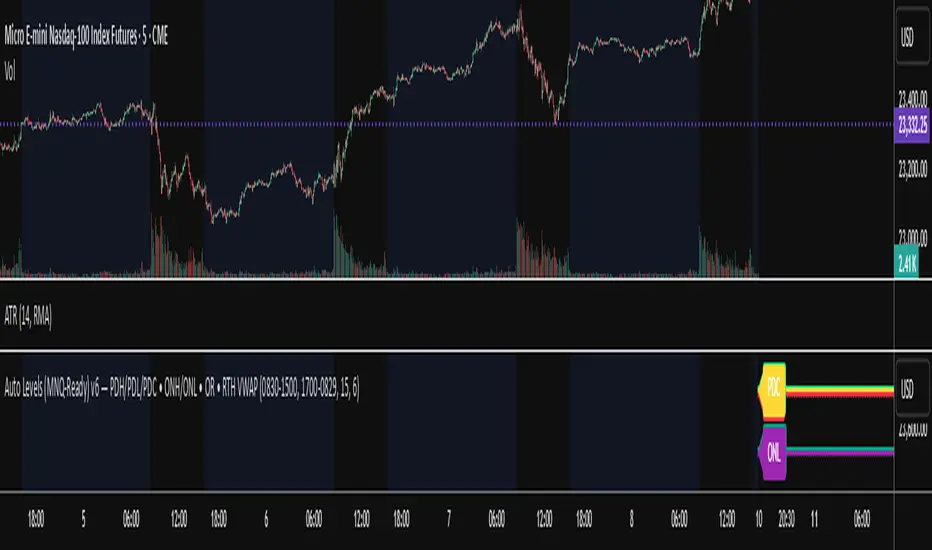
Gamma & Max Pain HelperGamma & Max Pain Helper
Plots Call Wall, Put Wall, and Max Pain levels directly on your chart so you can see where options positioning might influence price.
Features:
Manually enter Call Wall, Put Wall, and Max Pain strike prices.
Lines auto-update each bar — no redrawing needed.
Labels display name + strike price.
Option to only show lines near current price (within a % you choose).
Color-coded:
Red = Call Wall (potential resistance)
Green = Put Wall (potential support)
Blue = Max Pain (price magnet into expiry)
Adjustable line width & extension.
Use Case:
Perfect for traders combining options open interest/gamma analysis with price action, pivots, VWAP, and other intraday levels. Quickly spot overlaps between option walls and technical barriers for high-probability reaction zones.

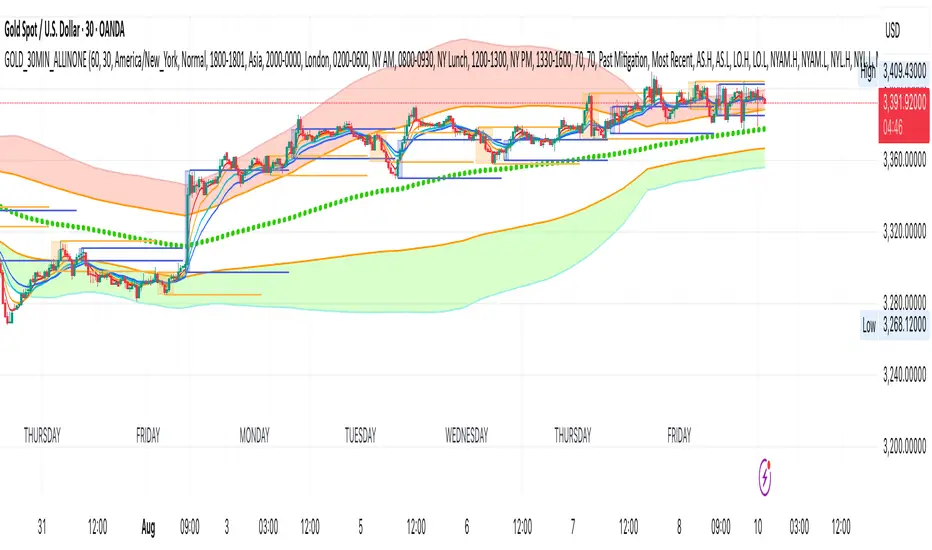
GOLD_30MIN_ALLINONEA comprehensive 30 minute trading tool for XAUUSD trading.
Use in combination of the indicator: 1 minute Easy Scalping Sys v3.0 (by BulltradingAM).
Rules:
1. A solid break out (measure breakout strength from the other indicator mentioned above) from the London session high or low (Orange Boxes), during the first 3 30Min candles of NYC session (Blue Boxes).
2. open position in the direction of the break out, set SL on London session high/low and TP on 1:1 RR or Bollinger Band outer line (for trending trades) and Bollinger Band Base line (for pullbacks and trend reversal trades).
3. No long trades in Bollinger red section and no short trades in Bollinger green section.
More Information:
You need the indicator only for the breakout candle momentum strength with the following indicator settings:
Timeframe 1: 1 Day
Timeframe 2: 30 Minutes
Timeframe 3: 30 Minutes
Timeframe 4: 30 Minutes
and set the week candles fill to blank for easy identification.
You will not need ATRs or Hulls lines or anything else from the other indicator.
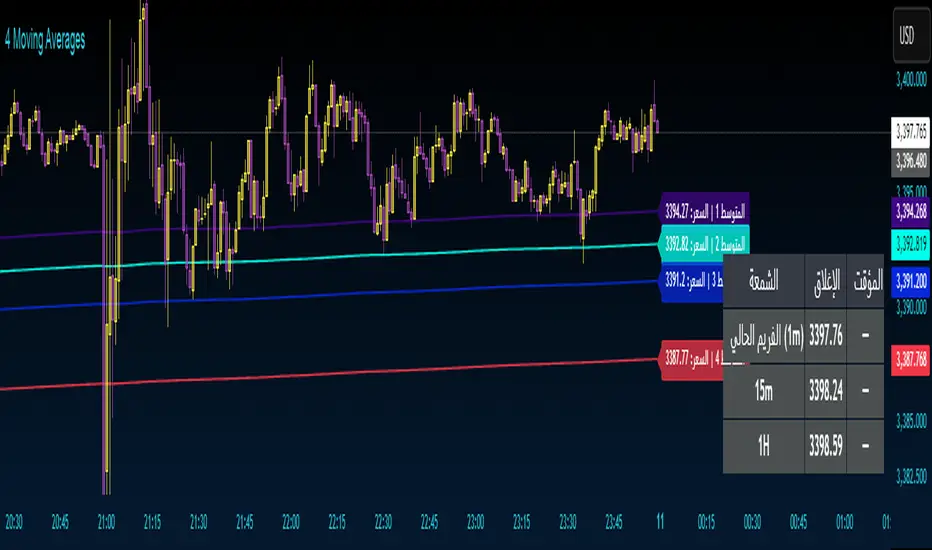
4 Moving Averages 4 Moving Averages
An indicator with four moving averages with ready-to-use settings. Use them as support and resistance.
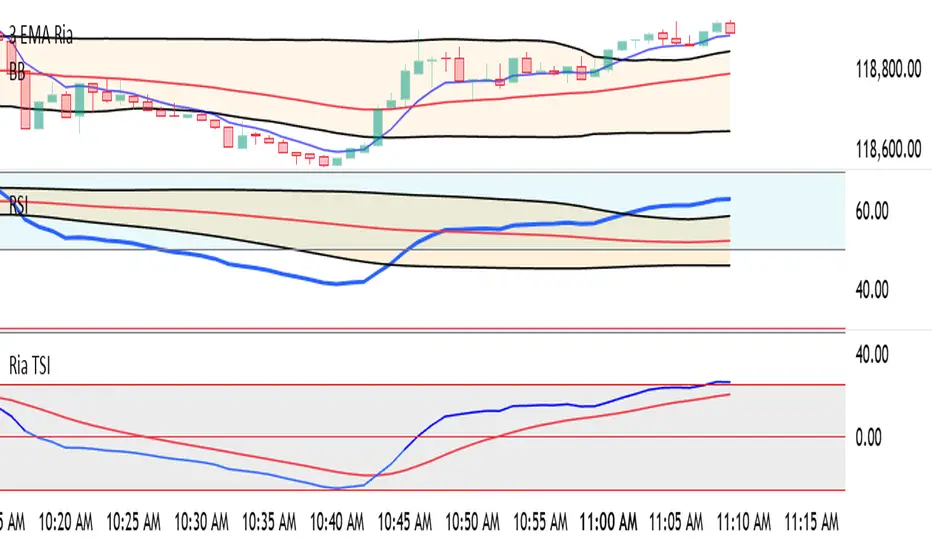
Ria TsiPlots TTM Squeeze momentum histogram (green/red).
Plots RSI (blue) in the same pane.
Shows squeeze dots and RSI overbought/oversold lines.
RSI Wave squeezePlots TTM Squeeze momentum histogram (green/red).
Plots RSI (blue) in the same pane.
Shows squeeze dots and RSI overbought/oversold lines.

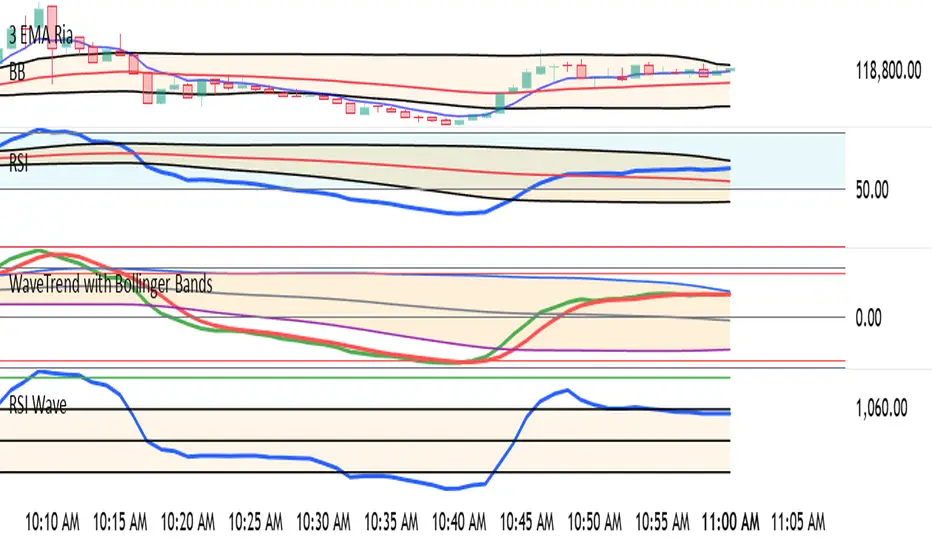
WaveTrend with Bollinger BandsPlots TTM Squeeze momentum histogram (green/red).
Plots RSI (blue) in the same pane.
Shows squeeze dots and RSI overbought/oversold lines.
S/R Clouds Overview
The S/R Clouds Indicator is a sophisticated TradingView tool designed to visualize support and resistance levels through dynamic cloud formations. Built on the principles of Keltner Channels, it employs a central moving average enveloped by volatility-based bands to highlight potential price reversal zones. This indicator enhances chart analysis with customizable aesthetics and practical alerts, making it suitable for traders across various strategies and timeframes.
Key Features
Dynamic Bands: Calculates upper and lower bands using a configurable moving average (SMA or EMA) offset by multiples of the average true range (derived from high-low ranges), capturing volatility deviations for precise S/R identification.
Cloud Visualization: Renders semi-transparent clouds between primary and extended bands, providing a clear, layered view of support (lower) and resistance (upper) areas.
Trend Detection: Incorporates a trend state logic based on price position relative to bands and moving average direction, aiding in bullish/bearish market assessments.
Customization Options:
Select from multiple color themes (e.g., Neon, Grayscale) or use custom colors for bands.
Enable glow effects for enhanced visual depth and adjust opacity for chart clarity.
Volatility Insights: Monitors band width to detect squeezes (low volatility) and expansions (high volatility), signaling potential breakouts.
Alerts System: Triggers notifications for price crossings of bands, trend changes, and other key events to support timely decision-making.
How It Works
At its core, the indicator centers on a user-defined period moving average. Volatility is measured via an exponential moving average of the high-low range, multiplied by adjustable factors to form the bands. This setup creates adaptive clouds that expand/contract with market volatility, offering a more responsive alternative to static S/R lines. The result is a clean, professional overlay that integrates seamlessly with other technical tools.
This high-quality indicator prioritizes usability and visual appeal, ensuring traders can focus on analysis without distraction.

Smart Money Breakout ChannelsSmart Money Breakout Channels** is a TradingView indicator designed to identify key price zones where "smart money" (institutional traders) may be active, helping traders anticipate breakouts. Below is a detailed explanation based on available information:
Overview
Purpose: The indicator detects breakout zones called "Smart Money Breakout Channels" based on volatility-normalized price movements. It visualizes these as dynamic boxes with volume overlays to highlight potential accumulation or distribution ranges.
Functionality: It tracks price breakouts (upward or downward) from these zones, providing traders with actionable signals for trend continuations or reversals.
Key Concepts
Volatility-Normalized Channels: The script calculates normalized price volatility using the standard deviation of price, mapped to a scale based on the highest and lowest prices over a lookback period. When volatility reaches a local low and flips upward, a channel (box) is drawn between the high and low prices of that zone.
Breakout Detection**: A breakout occurs when the price moves beyond the channel’s boundaries, either with a strong candle close (configurable) or by touching the boundary.
Volume Analysis: The indicator includes volume overlays within the channel, showing:
Volume Delta: Difference between buying and selling volume.
Up/Down Volume: Comparative buying vs. selling pressure.
Gradient Gauge: A visual gauge displays real-time volume delta pressure, indicating whether buying or selling momentum is building.
Smart Money Concept: Channels represent ranges where institutional traders may be accumulating or distributing positions, making breakouts from these zones significant for trend analysis
Features
Automatic Channel Detection: Identifies and draws breakout zones based on volatility pivots.
Nested Channels: Option to display multiple simultaneous zones or a single clean zone.
Volume Visualization: Offers three modes: raw volume, up/down volume, and delta.
Dynamic Gauge: A gradient-filled gauge shows current volume delta pressure within the channel.
Alerts: Configurable alerts for new channel creation, bullish breakouts, or bearish breakouts.
Detailed Explanation of Smart Money Breakout Channels
Smart Money Breakout Channels is a TradingView indicator designed to identify potential breakout zones in price action, leveraging volatility-normalized metrics and volume analysis to highlight areas where institutional or "smart money" activity may be occurring. Below is a comprehensive guide on how to use it effectively, including settings for different trading styles, common pitfalls, and illustrative examples.

Fiyat Önceki 10 Barın En Yükseğinden Büyükhareketli ortalamalar ve kanal üzeri alıma dayalı bir strateji

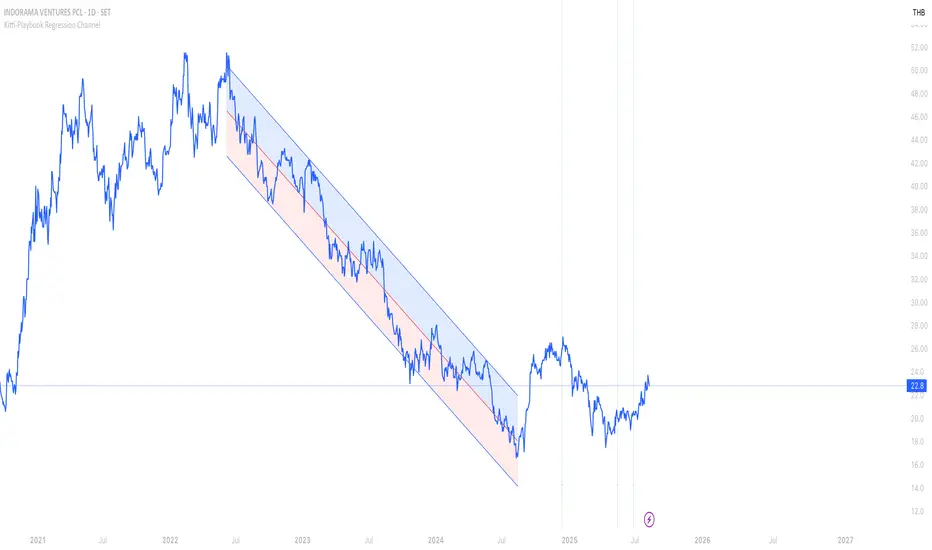
Kitti-Playbook Regression ChannelThis indicator used to study price movements in the form of a Regression Channel, and offers the following capabilities:
1)Specify the starting point., which bar to start from
2)Specify the ending point., which bar to end at
3)Option to set the end point to the very last bar
4)Adjust the channel width from 0 to 4 standard deviations (SD)
5)Adjust the channel color
6)Extend channel ( Left / Right / Both )
7)Display points where the MACD (12, 26) crosses the zero line”
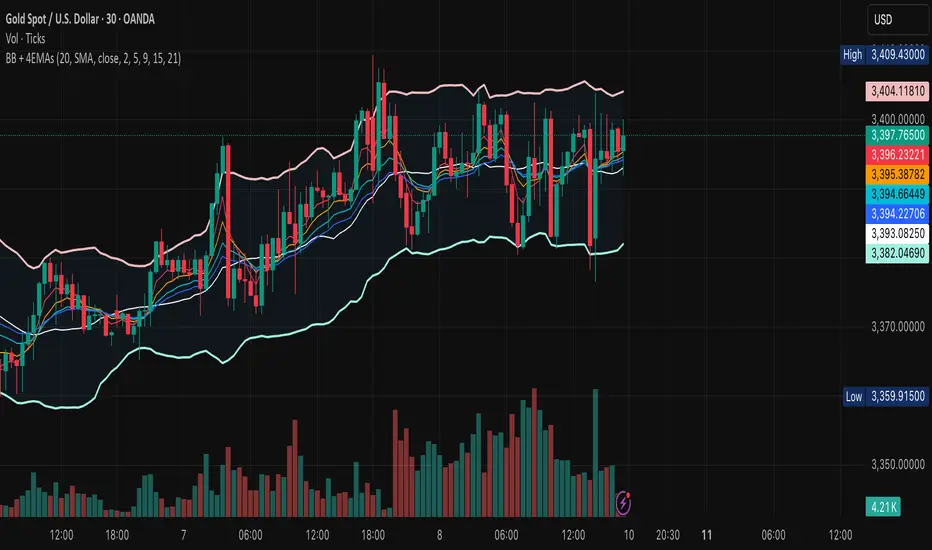
BB + 4 EMAsCustom Bollinger Bands with 4EMAs of your choice. All added in one indicator.
Look Before You Leap!

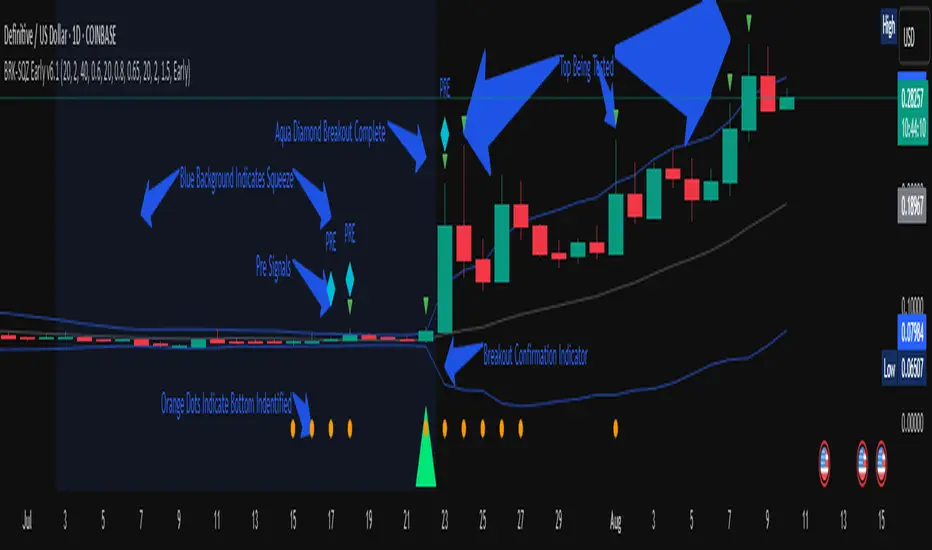
Breakout Squeeze – Early Detector (BRK-SQZ)
What it does
Squeeze — price goes quiet (Bollinger Band Width compresses vs its recent average).
Fuel — volume expands vs its 20-bar average.
Level — price takes out a recent high.
Quality — the close is near the top of the candle’s range.
When those stack up you get a signal. You can choose Strict (safer, later) or Early (faster, noisier).
What you’ll see on the chart
Blue background → in a squeeze (coiled).
Orange dots (bottom) → volume currently above threshold.
Green tiny caret (above bar) → price is testing/clearing the breakout level.
Aqua diamond labeled “PRE” (above bar) → Pre-Signal (any 3 of 4 checks are true). Early heads-up.
Lime triangle “BRK” (below bar) → Confirmed Long breakout (all 4 checks pass).
Tip: PRE can fire intrabar for early notice. The BRK triangle is your confirmation.
Inputs (the only knobs that matter)
Early (default): high or close can break the level; looser volume/close filters.
Strict: close must break the level; stronger volume/close placement.
Core
BB Length (20), BB Mult (2.0)
Squeeze Lookback (40) — moving average window for BB Width.
Squeeze Threshold (sqzFactor) (0.60) — lower = tighter squeeze requirement.
Breakout
Breakout Lookback (brkLen) (20) — new high must clear the prior N bars.
Volume
Volume SMA Length (20)
Volume Spike ≥ (Early/Strict) (1.5 / 2.0) — multiplier vs avg volume.
Candle Quality
Close-in-Range (Early/Strict) (0.65 / 0.80) — 0.80 = close in top 20% of bar.
Options
Fire intrabar (ON = earlier PRE/BRK; OFF = bar-close only).
Plot Signal Labels (on/off).
Debug paints (show/hide squeeze tint, volume dots, breakout carets, PRE).
Alerts (set these, you’re done)
Create two alerts from the indicator’s Condition dropdown:
BRK-SQZ Pre-Signal
Trigger: Once per bar (for early pings).
Purpose: tells you the coil is heating up before the rip.
BRK-SQZ Long
Trigger: Once per bar close (clean confirmation) or Once per bar if you want it faster.
Purpose: confirms the breakout when all checks align.
How to trade it (framework, not rules)
First touch after a long squeeze is the highest-odds signal.
On Daily, manage risk with ATR or a structure stop under the base.
Scale out into strength; let a runner ride if the squeeze was multi-week.
Installation (60 seconds)
Add indicator.
Keep Mode = Early, Fire intrabar = ON.
Set alerts for Pre-Signal (Once per bar) and Long (Once per bar close).
Save inputs as a Template and apply across your watchlist.
FAQ
Q: Why did PRE fire but no BRK?
A: One of the four checks failed at close (often volume or close-placement). That’s the filter doing its job.
Q: I want even earlier signals.
A: Lower volMult_early, reduce brkLen, or enable intrabar signals. Expect more noise.
Q: Can I get bearish signals?
A: Not yet. I can ship a mirrored Breakdown version on request.
Q: Can I screen a whole watchlist?
A: This version is chart-based. I can add a mini screener panel with a consolidated alert if you want.
Changelog
v6.1 — Early/Strict modes, PRE (3-of-4), squeeze tint, volume dots, breakout carets, BRK triangle, intrabar option, two alert conditions.
Disclaimer
This is a tool, not advice. Markets slip, wick, and change regime. Size responsibly and test your settings on your market/timeframe.
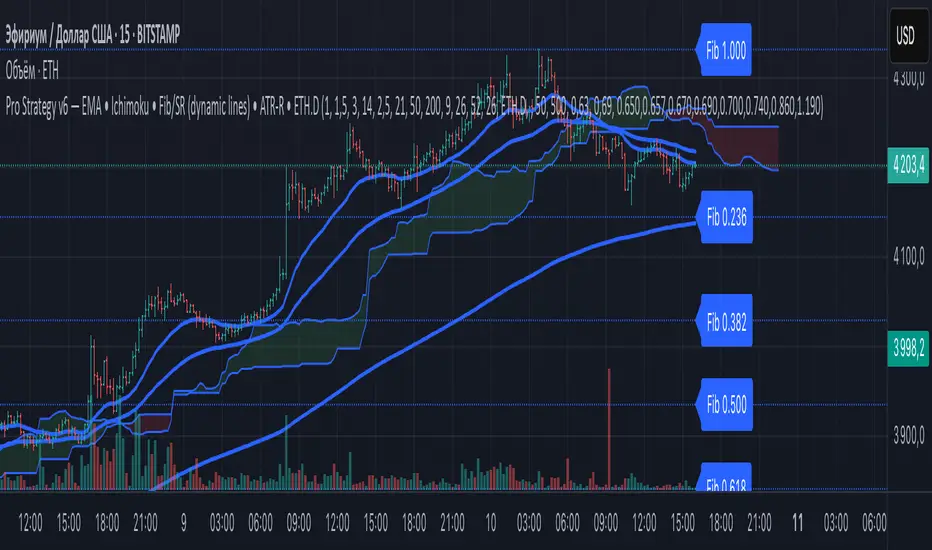
ZapTeam Pro Strategy v6 — EMA The Pro Strategy v6 script is a versatile trading strategy for TradingView that combines trend indicators, filters, and levels.
Main features:
EMA 21, EMA 50, EMA 200 — trend detection and entry signals via EMA crossovers.
Ichimoku Cloud (optional) — trend filtering and price position relative to the cloud.
ETH Dominance filter (optional) — filters trades based on Ethereum dominance (ETH.D).
ATR Stop-Loss — dynamic stop-loss based on volatility.
Two take-profits (TP1 and TP2) with optional 50/50 split.
Dynamic Fibonacci Levels — automatic or manual swings, with 1.272 and 1.618 extensions.
Custom S/R Levels — user-defined support/resistance levels.
Level lines extend across the chart and automatically adjust when zooming or panning.
Designed for trading in trending market conditions on any timeframe.
The strategy calculates position size based on percentage risk per equity.
Multi Timeframe 7 Bollinger Bands by CSPMulti Timeframe 7 Bollinger Bands by CSP IT SHOW 1MT,5MT,10MT,1HR,D, W,M BOLLINGER BAND IN ASINGLE CHART.