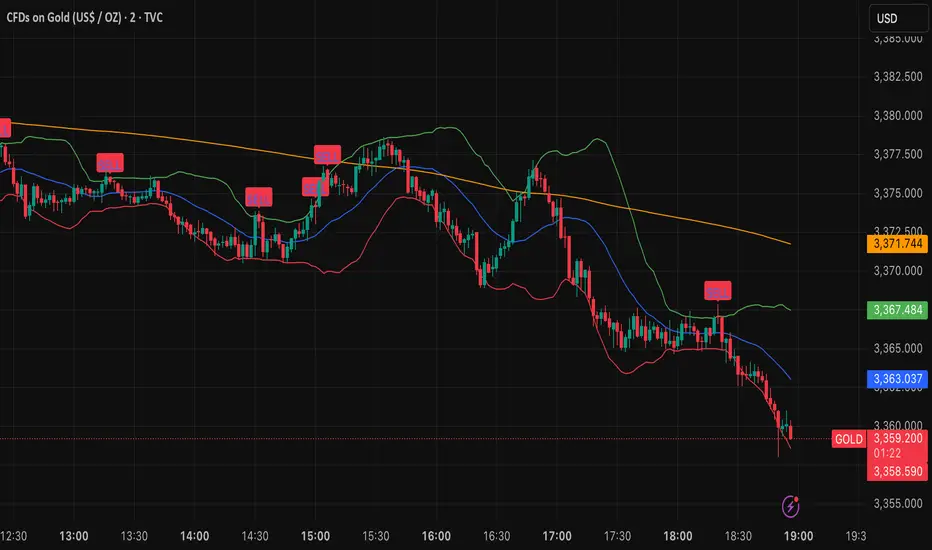
🔍 Confirmed Scalping Signals (Stoch+EMA+Supertrend)🔍 Confirmed Scalping Signals (Stoch+EMA+Supertrend)
Bands and Channels
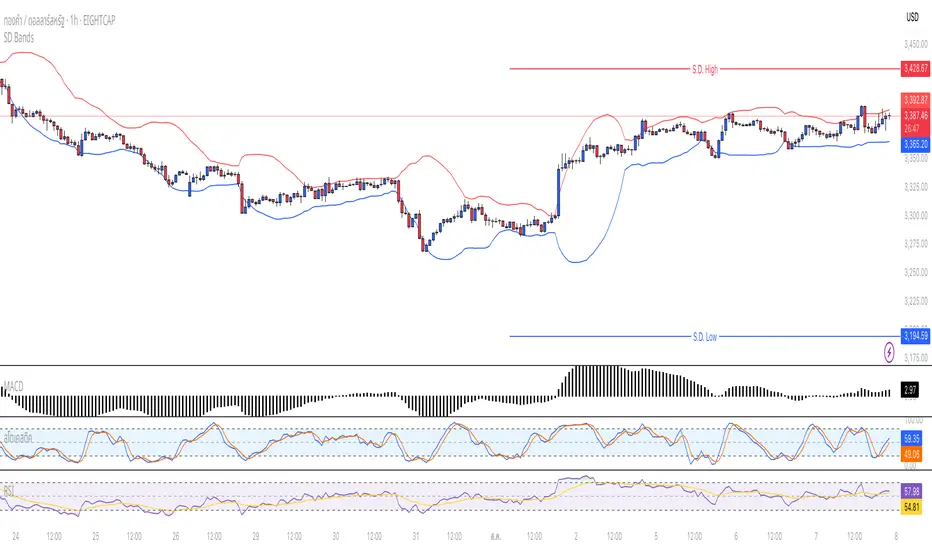
Standard Deviation BandsStandard Deviation Bands
คำอธิบายอินดิเคเตอร์:
อินดิเคเตอร์ SD Bands (Standard Deviation Bands) เป็นเครื่องมือวิเคราะห์ทางเทคนิคที่ออกแบบมาเพื่อวัดความผันผวนของราคาและระบุโอกาสในการเทรดที่อาจเกิดขึ้น อินดิเคเตอร์นี้จะแสดงผลเป็นเส้นขอบ 2 เส้นบนกราฟราคาโดยตรง โดยอ้างอิงจากค่าเฉลี่ยเคลื่อนที่ (Moving Average) และค่าส่วนเบี่ยงเบนมาตรฐาน (Standard Deviation)
* เส้นบน (Upper Band): แสดงระดับที่ราคาเคลื่อนไหวสูงกว่าค่าเฉลี่ย
* เส้นล่าง (Lower Band): แสดงระดับที่ราคาเคลื่อนไหวต่ำกว่าค่าเฉลี่ย
ความกว้างของช่องระหว่างเส้นทั้งสองบ่งบอกถึงระดับความผันผวนของตลาดในปัจจุบัน
วิธีการใช้งานอย่างละเอียด:
คุณสามารถนำอินดิเคเตอร์ SD Bands ไปประยุกต์ใช้ได้หลายวิธีเพื่อประกอบการตัดสินใจ ดังนี้:
1. การใช้เป็นแนวรับ-แนวต้านแบบไดนามิก (Dynamic Support & Resistance)
* แนวรับ: เมื่อราคาวิ่งลงมาแตะหรือเข้าใกล้เส้นล่าง (เส้นสีน้ำเงิน) เส้นนี้อาจทำหน้าที่เป็นแนวรับชั่วคราวและมีโอกาสที่ราคาจะเด้งกลับขึ้นไปหาเส้นกลาง
* แนวต้าน: เมื่อราคาวิ่งขึ้นไปแตะหรือเข้าใกล้เส้นบน (เส้นสีแดง) เส้นนี้อาจทำหน้าที่เป็นแนวต้านชั่วคราวและมีโอกาสที่ราคาจะย่อตัวลงมา
2. การวัดความผันผวนและสัญญาณ Breakout
* ช่วงตลาดสงบ (Low Volatility): เมื่อเส้น SD ทั้งสองเส้นบีบตัวเข้าหากันเป็นช่องที่แคบมาก (คล้ายกับ Bollinger Squeeze) แสดงว่าตลาดมีความผันผวนต่ำมาก ซึ่งมักจะเป็นสัญญาณว่ากำลังจะเกิดการเคลื่อนไหวครั้งใหญ่ (Breakout)
* ช่วงตลาดเป็นเทรนด์ (High Volatility): เมื่อเส้น SD ขยายตัวกว้างออกอย่างรวดเร็ว พร้อมกับที่ราคาวิ่งอยู่นอกขอบ แสดงว่าตลาดเข้าสู่ช่วงเทรนด์ที่แข็งแกร่งและมีโมเมนตัมสูง
3. สัญญาณการกลับตัว (Reversal Signals)
* เมื่อราคาปิดแท่งเทียน นอกเส้น SD Bands อย่างชัดเจน (โดยเฉพาะหลังจากที่เทรนด์นั้นดำเนินมานาน) อาจเป็นสัญญาณว่าแรงซื้อ/แรงขายเริ่มอ่อนกำลังลง และมีโอกาสที่จะเกิดการกลับตัวของราคาในไม่ช้า
การตั้งค่าอินพุต (Input Parameters):
* ระยะเวลา (Length): กำหนดจำนวนแท่งเทียนที่ใช้ในการคำนวณค่าเฉลี่ยและ SD
* 20: สำหรับการวิเคราะห์ระยะสั้นถึงกลาง
* 50 หรือ 100: สำหรับการวิเคราะห์ระยะยาว
* ตัวคูณ (Multiplier): กำหนดระยะห่างของเส้น SD จากค่าเฉลี่ย
* 1.0 - 2.0: เส้นจะอยู่ใกล้ราคามากขึ้น ทำให้เกิดสัญญาณบ่อยขึ้น
* 2.0 - 3.0: เส้นจะอยู่ห่างจากราคามากขึ้น ทำให้เกิดสัญญาณที่น่าเชื่อถือมากขึ้น แต่จะเกิดไม่บ่อย
ข้อควรระวังและคำเตือน:
* อินดิเคเตอร์นี้เป็นเพียง เครื่องมือวิเคราะห์ เพื่อช่วยในการตัดสินใจ ไม่ใช่สัญญาณการซื้อขายที่ถูกต้อง 100%
* ควรใช้ร่วมกับเครื่องมืออื่นๆ เช่น RSI, MACD, หรือ Volume เพื่อยืนยันสัญญาณ
* การเทรดมีความเสี่ยงสูง ควรบริหารจัดการความเสี่ยงและตั้งจุด Stop Loss ทุกครั้ง
คุณสามารถใช้โครงสร้างนี้ในการเขียนโพสต์บน TradingView ได้เลยนะครับ ขอให้ประสบความสำเร็จกับการโพสต์อินดิเคเตอร์ของคุณครับ!
English
Standard Deviation Bands
Indicator Description:
The SD Bands (Standard Deviation Bands) indicator is a powerful technical analysis tool designed to measure price volatility and identify potential trading opportunities. The indicator displays two dynamic bands directly on the price chart, based on a moving average and a customizable standard deviation multiplier.
* Upper Band: Indicates price levels above the moving average.
* Lower Band: Indicates price levels below the moving average.
The width of the channel between these two bands provides a clear picture of current market volatility.
Detailed User Guide:
You can use SD Bands in several ways to enhance your trading decisions:
1. Dynamic Support and Resistance:
These bands can act as dynamic support and resistance levels.
* Support: When the price moves down and touches or approaches the lower band, it can act as support, offering the possibility of a rebound to the average.
* Resistance: When the price moves up and touches or approaches the upper band, it can act as resistance, offering the possibility of a rebound.
2. Volatility Measurement and Breakout Signals:
* Low Volatility (Squeeze): When the two bands converge and form a narrow channel. Indicates very low market volatility. This condition often occurs before significant price movements or breakouts.
* High Volatility (Expansion): When the bands expand and widen rapidly, it indicates that the market is entering a period of strong trending momentum with high momentum.
3. Reversal Signals:
* When the price closes significantly outside the SD Bands (especially after a long-term trend), it may signal that the current momentum has expired and a reversal may be imminent.
Input Parameters:
The indicator's parameters are fully customizable to suit your trading style:
* Length: Defines the number of bars used to calculate the moving average and standard deviation.
* 20: Suitable for short- to medium-term analysis.
* 50 or 100: Suitable for long-term trend analysis.
* Multiplier: Adjusts the sensitivity of the signal bars.
* 1.0 - 2.0: Creates narrower signal bars, leading to more frequent signals.
* 2.0 - 3.0: Creates wider signal bars, providing fewer but potentially more significant signals.
Important Warning:
* This indicator is an analytical tool only. It does not provide guaranteed buy or sell signals.
* Always use it in conjunction with other indicators (such as RSI, MACD, and Volume) for confirmation.
* Trading involves high risk. Proper risk management, including the use of stop-loss orders, is recommended.
You can use this structure for your posts on TradingView. Good luck with your indicators!
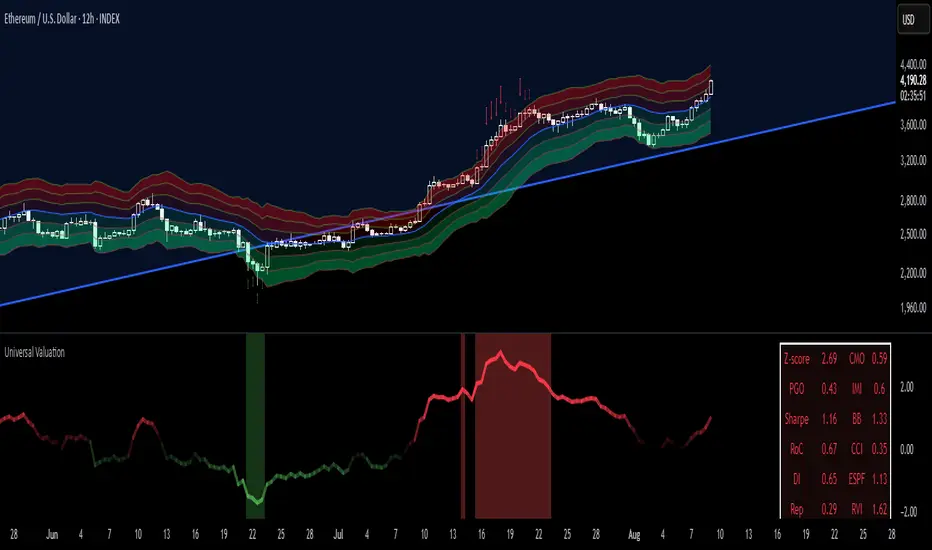
Universal Valuation[public code]Universal valuation indicator for all assets. Consists of 12 different indicators which are z-scored and averaged out.
> Volatility bands via Keltner Channels with a NWMA
> Confluence when price > vol.bands and valuation is high/low. The confluence is marked with red arrows when above the upper third band(green when below the lower on the downside), and 50% transparency when between 2/3 band(green when below the lower 2/3 bands on the downside.)
> Can be used separately of course.
> Can be used as valuation of indicators, when possible. (eg. Global Liquidity index valuation)
Code is a mess a bit, but parts can be extracted and a new strategy/indicator can be made.
*Big probs to the creator of this indicator . Inspired by him. I want to make it possible for people to extrapolate and create their own indicators/strategies. And of course, so I can do the same.
Bitcoin Logarithmic Growth Curve 2025 Z-Score"The Bitcoin logarithmic growth curve is a concept used to analyze Bitcoin's price movements over time. The idea is based on the observation that Bitcoin's price tends to grow exponentially, particularly during bull markets. It attempts to give a long-term perspective on the Bitcoin price movements.
The curve includes an upper and lower band. These bands often represent zones where Bitcoin's price is overextended (upper band) or undervalued (lower band) relative to its historical growth trajectory. When the price touches or exceeds the upper band, it may indicate a speculative bubble, while prices near the lower band may suggest a buying opportunity.
Unlike most Bitcoin growth curve indicators, this one includes a logarithmic growth curve optimized using the latest 2024 price data, making it, in our view, superior to previous models. Additionally, it features statistical confidence intervals derived from linear regression, compatible across all timeframes, and extrapolates the data far into the future. Finally, this model allows users the flexibility to manually adjust the function parameters to suit their preferences.
The Bitcoin logarithmic growth curve has the following function:
y = 10^(a * log10(x) - b)
In the context of this formula, the y value represents the Bitcoin price, while the x value corresponds to the time, specifically indicated by the weekly bar number on the chart.
How is it made (You can skip this section if you’re not a fan of math):
To optimize the fit of this function and determine the optimal values of a and b, the previous weekly cycle peak values were analyzed. The corresponding x and y values were recorded as follows:
113, 18.55
240, 1004.42
451, 19128.27
655, 65502.47
The same process was applied to the bear market low values:
103, 2.48
267, 211.03
471, 3192.87
676, 16255.15
Next, these values were converted to their linear form by applying the base-10 logarithm. This transformation allows the function to be expressed in a linear state: y = a * x − b. This step is essential for enabling linear regression on these values.
For the cycle peak (x,y) values:
2.053, 1.268
2.380, 3.002
2.654, 4.282
2.816, 4.816
And for the bear market low (x,y) values:
2.013, 0.394
2.427, 2.324
2.673, 3.504
2.830, 4.211
Next, linear regression was performed on both these datasets. (Numerous tools are available online for linear regression calculations, making manual computations unnecessary).
Linear regression is a method used to find a straight line that best represents the relationship between two variables. It looks at how changes in one variable affect another and tries to predict values based on that relationship.
The goal is to minimize the differences between the actual data points and the points predicted by the line. Essentially, it aims to optimize for the highest R-Square value.
Below are the results:
snapshot
snapshot
It is important to note that both the slope (a-value) and the y-intercept (b-value) have associated standard errors. These standard errors can be used to calculate confidence intervals by multiplying them by the t-values (two degrees of freedom) from the linear regression.
These t-values can be found in a t-distribution table. For the top cycle confidence intervals, we used t10% (0.133), t25% (0.323), and t33% (0.414). For the bottom cycle confidence intervals, the t-values used were t10% (0.133), t25% (0.323), t33% (0.414), t50% (0.765), and t67% (1.063).
The final bull cycle function is:
y = 10^(4.058 ± 0.133 * log10(x) – 6.44 ± 0.324)
The final bear cycle function is:
y = 10^(4.684 ± 0.025 * log10(x) – -9.034 ± 0.063)
The main Criticisms of growth curve models:
The Bitcoin logarithmic growth curve model faces several general criticisms that we’d like to highlight briefly. The most significant, in our view, is its heavy reliance on past price data, which may not accurately forecast future trends. For instance, previous growth curve models from 2020 on TradingView were overly optimistic in predicting the last cycle’s peak.
This is why we aimed to present our process for deriving the final functions in a transparent, step-by-step scientific manner, including statistical confidence intervals. It's important to note that the bull cycle function is less reliable than the bear cycle function, as the top band is significantly wider than the bottom band.
Even so, we still believe that the Bitcoin logarithmic growth curve presented in this script is overly optimistic since it goes parly against the concept of diminishing returns which we discussed in this post:
This is why we also propose alternative parameter settings that align more closely with the theory of diminishing returns."
Now with Z-Score calculation for easy and constant valuation classification of Bitcoin according to this metric.
Created for TRW

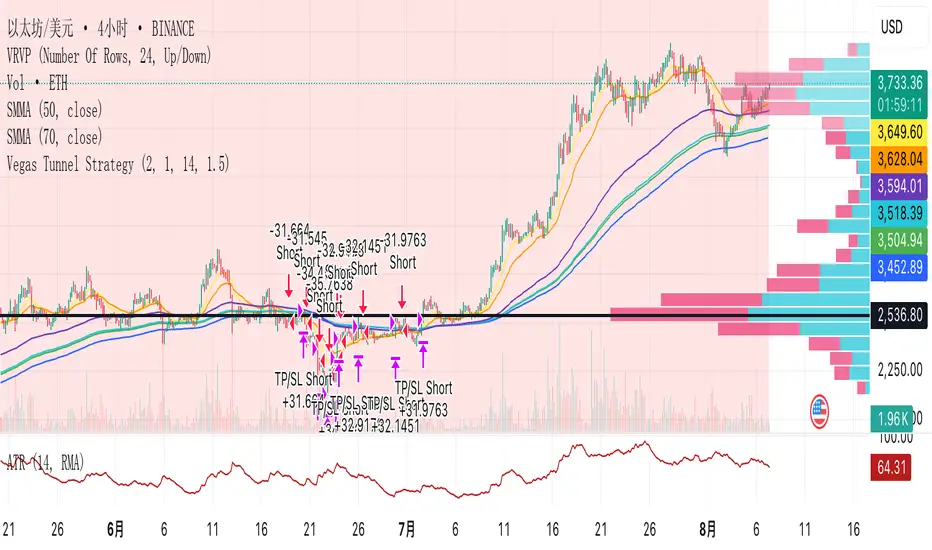
Vegas Tunnel StrategyVegas Tunnel Strategy is a trend-following breakout system based on exponential moving averages (EMAs). It uses a "tunnel" formed by the 144 EMA and 169 EMA to identify the market's long-term trend direction. Entry signals are generated when a shorter-term EMA (12 EMA) breaks above or below this tunnel, confirming momentum alignment.
Long Setup: Price and EMA12 are above the tunnel (EMA144 < EMA169); entry on pullback near the tunnel.
Short Setup: Price and EMA12 are below the tunnel (EMA144 > EMA169); entry on rebound near the tunnel.
Exit Rules: Fixed stop loss below/above the tunnel or based on ATR; take profit at 1.5–2× the risk.
This strategy works best on 4H or daily charts and is suitable for trending assets like FX pairs, gold, oil, or indices.
[Stratégia] VWAP Mean Magnet v9 (Simple Alert)This strategy is specifically designed for a ranging (sideways-moving) Bitcoin market.
A trade is only opened and signaled on the chart if all three of the following conditions are met simultaneously at the close of a candle:
Zone Entry
The price must cross into the signal zone: the red band for a Short (sell) position, or the green band for a Long (buy) position.
RSI Confirmation
The RSI indicator must also confirm the signal. For a Short, it must go above 65 (overbought condition). For a Long, it must fall below 25 (oversold condition).
Volume Filter
The volume on the entry candle cannot be excessively high. This safety filter is designed to prevent trades during risky, high-momentum breakouts.

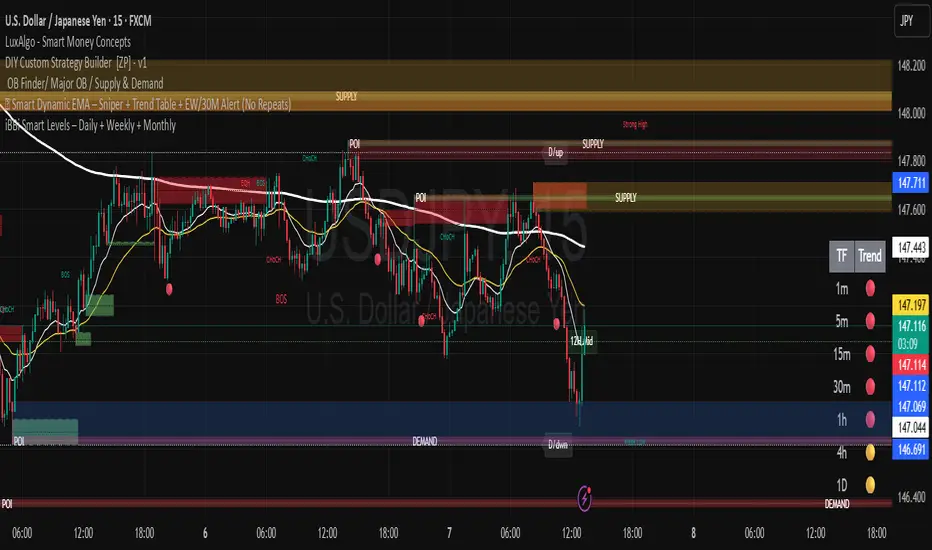
iBBi Smart Levels – Daily + Weekly + MonthlyThis is a level indicator. In trading levels make lots of difference - this indicator gives us, daily, weekly and monthly levels. Then, it gives last 12-hours high and low level. This means at any given time you will have these EIGHT LEVELS available to you.
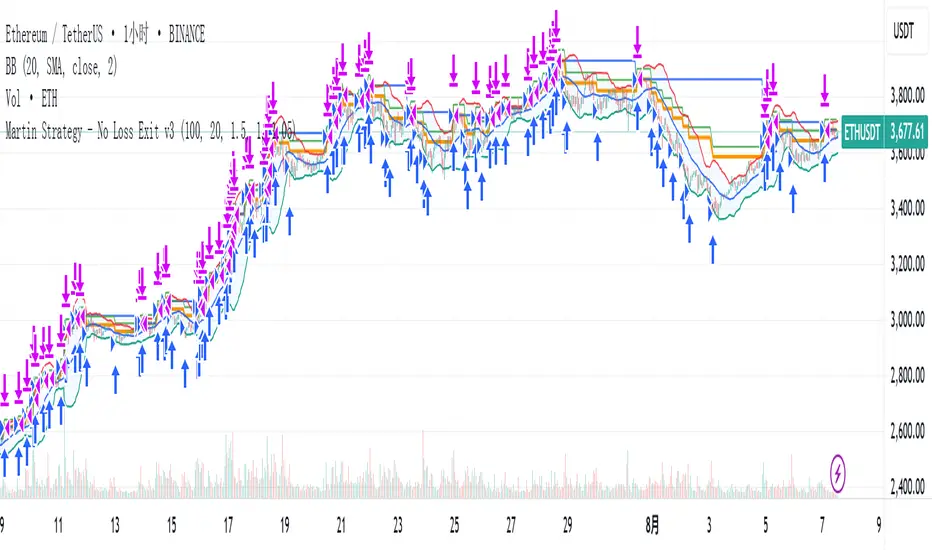
Martin Strategy - No Loss Exit v3Martin Strategy - No Loss Exit v3Martin Strategy - No Loss Exit v3Martin Strategy - No Loss Exit v3
Squeeze Momentum Regression Clouds [SciQua]╭──────────────────────────────────────────────╮
☁️ Squeeze Momentum Regression Clouds
╰──────────────────────────────────────────────╯
🔍 Overview
The Squeeze Momentum Regression Clouds (SMRC) indicator is a powerful visual tool for identifying price compression , trend strength , and slope momentum using multiple layers of linear regression Clouds. Designed to extend the classic squeeze framework, this indicator captures the behavior of price through dynamic slope detection, percentile-based spread analytics, and an optional UI for trend inspection — across up to four customizable regression Clouds .
────────────────────────────────────────────────────────────
╭────────────────╮
⚙️ Core Features
╰────────────────╯
Up to 4 Regression Clouds – Each Cloud is created from a top and bottom linear regression line over a configurable lookback window.
Slope Detection Engine – Identifies whether each band is rising, falling, or flat based on slope-to-ATR thresholds.
Spread Compression Heatmap – Highlights compressed zones using yellow intensity, derived from historical spread analysis.
Composite Trend Scoring – Aggregates directional signals from each Cloud using your chosen weighting model.
Color-Coded Candles – Optional candle coloring reflects the real-time composite score.
UI Table – A toggleable info table shows slopes, compression levels, percentile ranks, and direction scores for each Cloud.
Gradient Cloud Styling – Apply gradient coloring from Cloud 1 to Cloud 4 for visual slope intensity.
Weight Aggregation Options – Use equal weighting, inverse-length weighting, or max pooling across Clouds to determine composite trend strength.
────────────────────────────────────────────────────────────
╭──────────────────────────────────────────╮
🧪 How to Use the Indicator
1. Understand Trend Bias with Cloud Colors
╰──────────────────────────────────────────╯
Each Cloud changes color based on its current slope:
Green indicates a rising trend.
Red indicates a falling trend.
Gray indicates a flat slope — often seen during chop or transitions.
Cloud 1 typically reflects short-term structure, while Cloud 4 represents long-term directional bias. Watch for multi-Cloud alignment — when all Clouds are green or red, the trend is strong. Divergence among Clouds often signals a potential shift.
────────────────────────────────────────────────────────────
╭───────────────────────────────────────────────╮
2. Use Compression Heat to Anticipate Breakouts
╰───────────────────────────────────────────────╯
The space between each Cloud’s top and bottom regression lines is measured, normalized, and analyzed over time. When this spread tightens relative to its history, the script highlights the band with a yellow compression glow .
This visual cue helps identify squeeze zones before volatility expands. If you see compression paired with a changing slope color (e.g., gray to green), this may indicate an impending breakout.
────────────────────────────────────────────────────────────
╭─────────────────────────────────╮
3. Leverage the Optional Table UI
╰─────────────────────────────────╯
The indicator includes a dynamic, floating table that displays real-time metrics per Cloud. These include:
Slope direction and value , with historical Min/Max reference.
Top and Bottom percentile ranks , showing how price sits within the Cloud range.
Current spread width , compared to its historical norms.
Composite score , which blends trend, slope, and compression for that Cloud.
You can customize the table’s position, theme, transparency, and whether to show a combined summary score in the header.
────────────────────────────────────────────────────────────
╭─────────────────────────────────────────────╮
4. Analyze Candle Color for Composite Signals
╰─────────────────────────────────────────────╯
When enabled, the indicator colors candles based on a weighted composite score. This score factors in:
The signed slope of each Cloud (up, down, or flat)
The percentile pressure from the top and bottom bands
The degree of spread compression
Expect green candles in bullish trend phases, red candles during bearish regimes, and gray candles in mixed or low-conviction zones.
Candle coloring provides a visual shorthand for market conditions , useful for intraday scanning or historical backtesting.
────────────────────────────────────────────────────────────
╭────────────────────────╮
🧰 Configuration Guidance
╰────────────────────────╯
To tailor the indicator to your strategy:
Use Cloud lengths like 21, 34, 55, and 89 for a balanced multi-timeframe view.
Adjust the slope threshold (default 0.05) to control how sensitive the trend coloring is.
Set the spread floor (e.g., 0.15) to tune when compression is detected and visualized.
Choose your weighting style : Inverse Length (favor faster bands), Equal, or Max Pooling (most aggressive).
Set composite weights to emphasize trend slope, percentile bias, or compression—depending on your market edge.
────────────────────────────────────────────────────────────
╭────────────────╮
✅ Best Practices
╰────────────────╯
Use aligned Cloud colors across all bands to confirm trend conviction.
Combine slope direction with compression glow for early breakout entry setups.
In choppy markets, watch for Clouds 1 and 2 turning flat while Clouds 3 and 4 remain directional — a sign of potential trend exhaustion or consolidation.
Keep the table enabled during backtesting to manually evaluate how each Cloud behaved during price turns and consolidations.
────────────────────────────────────────────────────────────
╭───────────────────────╮
📌 License & Usage Terms
╰───────────────────────╯
This script is provided under the Creative Commons Attribution-NonCommercial 4.0 International License .
✅ You are allowed to:
Use this script for personal or educational purposes
Study, learn, and adapt it for your own non-commercial strategies
❌ You are not allowed to:
Resell or redistribute the script without permission
Use it inside any paid product or service
Republish without giving clear attribution to the original author
For commercial licensing , private customization, or collaborations, please contact Joshua Danford directly.

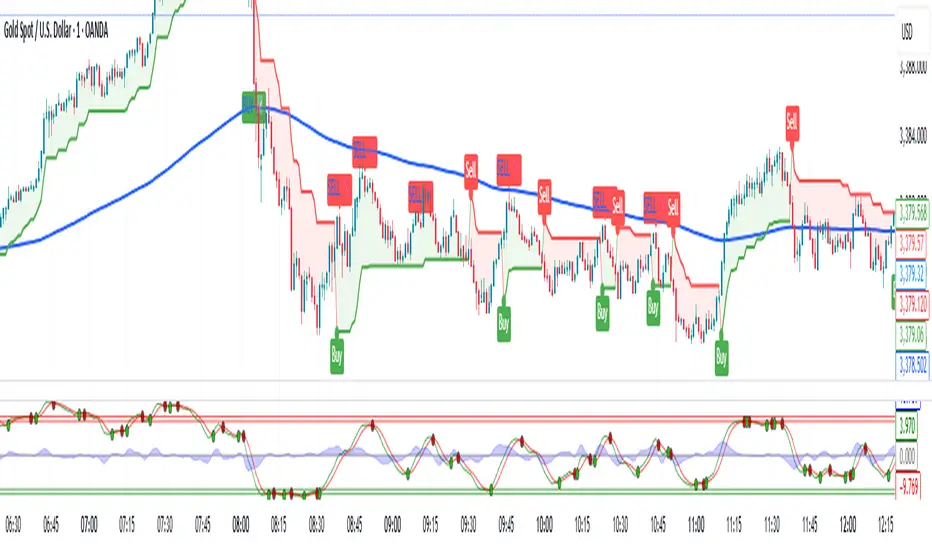
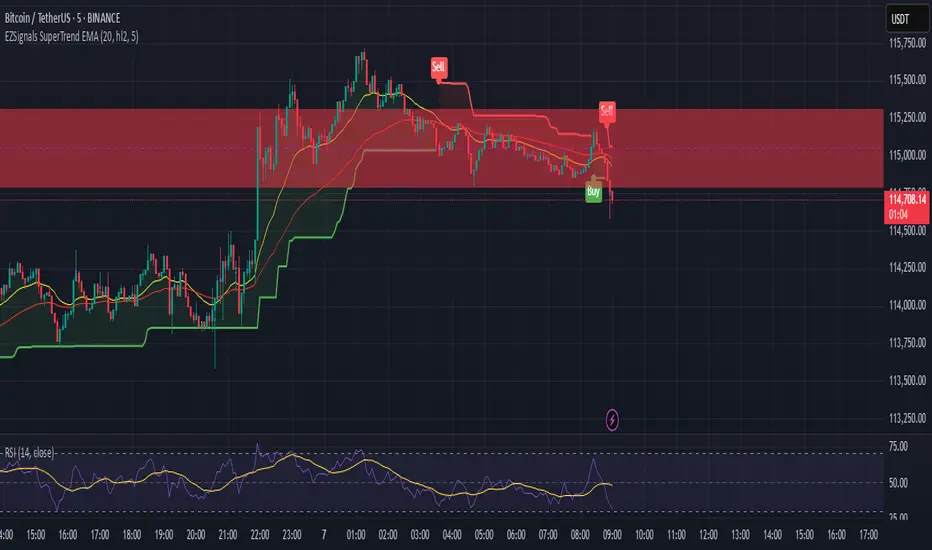
EZSignals SuperTrend EMAA technical indicator, even with high accuracy, must be rigorously backtested to assess its stability across various market conditions. Its effectiveness depends not only on the algorithm itself but also on how it is integrated into the overall trading system. Proper usage, combined with risk management and a solid understanding of market context, is essential to convert theoretical accuracy into practical trading advantage.

EZSignals SuperTrend EMAA technical indicator, even with high accuracy, must be rigorously backtested to assess its stability across various market conditions. Its effectiveness depends not only on the algorithm itself but also on how it is integrated into the overall trading system. Proper usage, combined with risk management and a solid understanding of market context, is essential to convert theoretical accuracy into practical trading advantage.
Terminal de Estrategias PRO (MTF + Order Blocks)this is a new test for the implementation of functions on my app web for signals


Bitcoin: Pi Cycle Top & Bottom Indicator Z ScoreIndicator Overview
The Pi Cycle Top Indicator has historically been effective in picking out the timing of market cycle highs within 3 days.
It uses the 111 day moving average (111DMA) and a newly created multiple of the 350 day moving average, the 350DMA x 2.
Note: The multiple is of the price values of the 350DMA, not the number of days.
For the past three market cycles, when the 111DMA moves up and crosses the 350DMA x 2 we see that it coincides with the price of Bitcoin peaking.
It is also interesting to note that 350 / 111 is 3.153, which is very close to Pi = 3.142. In fact, it is the closest we can get to Pi when dividing 350 by another whole number.
It once again demonstrates the cyclical nature of Bitcoin price action over long time frames. However, in this instance, it does so with a high degree of accuracy over Bitcoin's adoption phase of growth.
Bitcoin Price Prediction Using This Tool
The Pi Cycle Top Indicator forecasts the cycle top of Bitcoin’s market cycles. It attempts to predict the point where Bitcoin price will peak before pulling back. It does this on major high time frames and has picked the absolute tops of Bitcoin’s major price moves throughout most of its history.
How It Can Be Used
Pi Cycle Top is useful to indicate when the market is very overheated. So overheated that the shorter-term moving average, which is the 111-day moving average, has reached an x2 multiple of the 350-day moving average. Historically, it has proved advantageous to sell Bitcoin around this time in Bitcoin's price cycles.
It is also worth noting that this indicator has worked during Bitcoin's adoption growth phase, the first 15 years or so of Bitcoin's life. With the launch of Bitcoin ETF's and Bitcoin's increased integration into the global financial system, this indicator may cease to be relevant at some point in this new market structure.
Added the Z-Score metric for easy classification of the value of Bitcoin according to this indicator.
Created for TRW

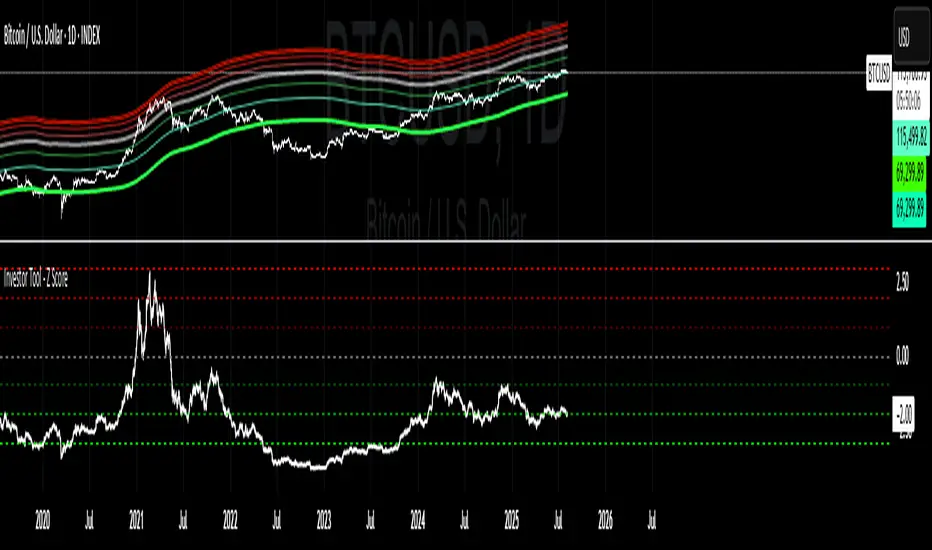
Investor Tool - Z ScoreThe Investor Tool is intended as a tool for long term investors, indicating periods where prices are likely approaching cyclical tops or bottoms. The tool uses two simple moving averages of price as the basis for under/overvalued conditions: the 2-year MA (green) and a 5x multiple of the 2-year MA (red).
Price trading below the 2-year MA has historically generated outsized returns, and signalled bear cycle lows.
Price trading above the 2-year MA x5 has been historically signalled bull cycle tops and a zone where investors de-risk.
Just like the Glassnode one, but here on TV and with StDev bands
Now with Z-SCORE calculation:
The Z-Score is calculated to be -3 Z at the bottom bands and 3 Z at the top bands
mean = (upper_sma + bottom_sma) / 2
bands_range = upper_sma - bottom_sma
stdDev = bands_range != 0 ? bands_range / 6 : 0
zScore = stdDev != 0 ? (close - mean) / stdDev : 0
Created for TRW
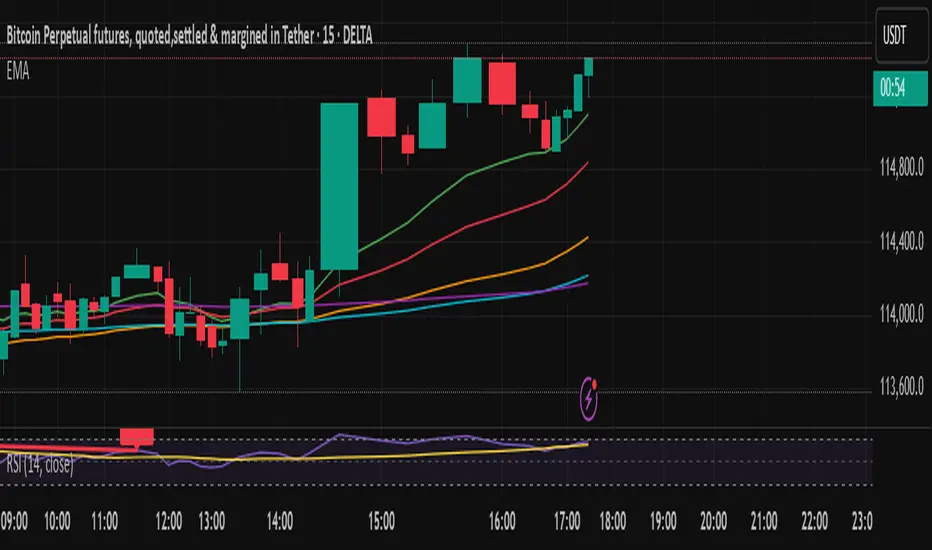
EMA 10/20/50/100/200plot 10, 20, 50,100,200 EMA on the chart. can be used to determine on any timeframe EMA
RSI Cloud Zones (by AButterfly)RSI instruction: Uptrend market only. LONG only. Should use only when SPY and QQQ are above 50 SMA and 200 SMA, and the 50sma is above 200sma, and RSI(14) is above 50 ............... BUY only in the GREEN area. Do NOT buy above GREEN green area. That would be chase (after a train, a ship that left). Take profit in the RED area, preferably on a green candle. This does not encourage SHORT-ing. LONG only. Disclaimer: This is an entertainment. If you lose money, don't blame this indicator or the creator. You have to pay attention to whether the market is on uptrend.

EMA Channel with ATR Offset + 2 Custom EMAsJust an alternative channel indicator to Bollinger Bands or Ketner channels that uses ATR offsets as the corridor of possible movements, which I recommend changing to fit various tickers.
Also thrown in is EMA, default is 100 and 50 periods for trend direction and potential confirmation

Yearly VWAP with Z-Score Yearly VWAP with Z-score (starting from June)
Z(upperband)=-2
Z(lowerband)=2
Z(middleline)=0

triple Keltner Channels with Z-ScoreThis indicator plots three Keltner Channels (multipliers 2, 3, and 3.5) around a customizable EMA. It calculates a continuous Z-Score for the previous closed candle based on its position within the channels. The Z-Score is plotted as a blue line below the chart

Holy Grail Signal op EMA + ADXHolygrail + adx indicator with buy signals so you can buy at the yellow arrow

Price Line Indicator
This indicator plots evenly spaced horizontal lines on the price chart starting from a user-defined price. You can customize:
Starting Price
Price Spacing (supports decimals)
Number of Lines
Line Color & Width
Each line is extended across the chart with a label showing its precise price level (up to 4 decimal places). Ideal for marking psychological levels, support/resistance zones, or custom grid setups.

Bollinger Bands (SMA) with Trend Filtered Buy/SellOverview
This indicator is a trend-following Bollinger Bands tool based on SMA, enhanced with a 200 SMA filter to display BUY/SELL signals only in the direction of the prevailing trend.
Instead of showing every possible reversal, it focuses on high-probability entries aligned with the trend.
Key Features
Feature Description
Bollinger Bands (SMA) Plots upper, lower, and middle bands using Simple Moving Average (SMA) and standard deviation.
200 SMA Trend Filter Determines the overall market trend (bullish or bearish).
BUY/SELL Signals Generates signals when price reacts from Bollinger Bands.
Trend Filtering Only BUY signals above the 200 SMA, only SELL signals below the 200 SMA.
Alert Function TradingView alerts can be triggered when a signal occurs.
Toggle ON/OFF Option to enable or disable signal display.
Signal Logic
BUY Signal
Price is above the 200 SMA (uptrend)
Previous candle closed below the lower Bollinger Band
Current candle closes back inside the band → Confirmed rebound → BUY signal
SELL Signal
Price is below the 200 SMA (downtrend)
Previous candle closed above the upper Bollinger Band
Current candle closes back inside the band → Confirmed pullback → SELL signal
How to Use
Trend-Following Entries:
Enter trades only in the trend direction, improving accuracy and reducing countertrend trades.
Filter Out False Signals:
The 200 SMA filter removes noise from opposite-trend signals.
Alerts:
Receive notifications when a valid BUY/SELL setup appears without watching the chart constantly.
This indicator is ideal for traders who want to focus on high-probability trend-following setups, especially in markets like Forex or Gold, where strong one-way moves often occur.
このインジケーターは、SMAベースのボリンジャーバンドにトレンドフィルター(200SMA)を追加し、トレンドフォロー型のBUY/SELLシグナルを表示するツールです。
短期の逆張りではなく、大きなトレンド方向に沿ったシグナルだけを出すように設計されています。
主な機能
機能 説明
ボリンジャーバンド (SMA) 期間を指定した単純移動平均(SMA)を基準に、標準偏差で上下のバンドを表示
200SMA(トレンド判定) 現在の相場が上昇トレンドか下降トレンドかを判断
BUY/SELLシグナル ボリンジャーバンドの反発を検出してシグナル表示
トレンドフィルター 200SMAより上ならBUYのみ、200SMAより下ならSELLのみ表示
アラート機能 BUY/SELLシグナル発生時にTradingViewのアラートで通知可能
ON/OFF切替 BUY/SELLシグナルの表示はスイッチでON/OFF可能
シグナルロジック
BUYシグナル
200SMAより上にいる
前の足で価格がボリンジャーバンド下限を下抜け
現在の足でバンド内に戻る → 反発確認 → BUYシグナル表示
SELLシグナル
200SMAより下にいる
前の足で価格がボリンジャーバンド上限を上抜け
現在の足でバンド内に戻る → 反落確認 → SELLシグナル表示
トレードでの使い方
トレンドフォロー型エントリー
→ 200SMAを基準に、相場の方向に沿ったエントリーだけを狙う
逆張りのフィルタリング
→ トレンドに逆らう無駄なシグナルを表示しない
アラート通知
→ チャートを見ていなくても、シグナル発生時に通知可能
このインジケーターは「トレンドフォローの精度を高めたいトレーダー」向けです。
特にゴールドやFXで、一方向の強いトレンドが出やすい相場で有効です。