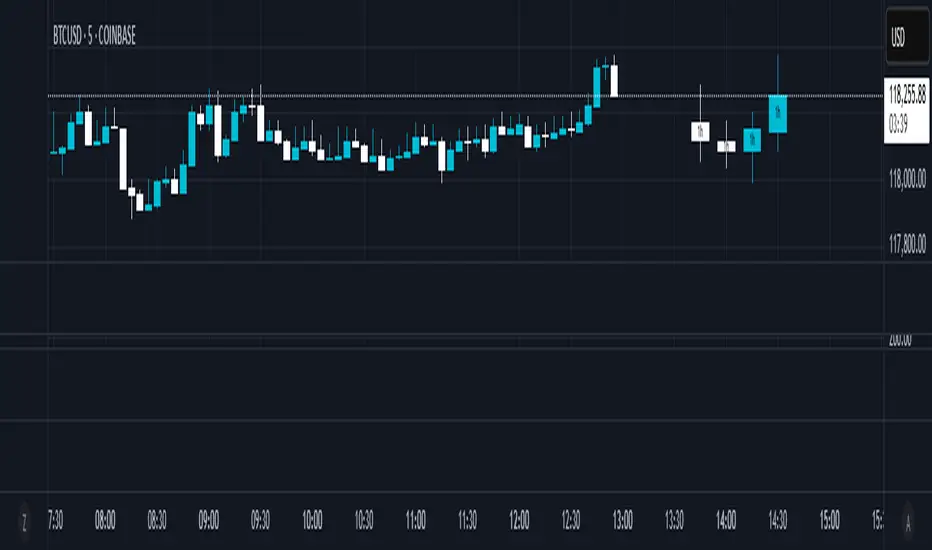
HTF Candles [theUltimator5]Overlay higher timeframe candles on any lower timeframe chart with real-time updates.
This indicator displays the full structure of each higher timeframe (HTF) candle—including open-close bodies and full wicks—directly on your current chart. Great for multi-timeframe traders who want to align short-term entries with broader market context.
🔹 Features:
View higher timeframe candles (e.g., 1H, 4H, Daily) on intraday charts
Dynamic candle bodies that update in real-time
Accurate wick representation with auto-redrawing
Customizable bullish/bearish colors and transparency
Efficient object management for minimal clutter
🛠️ How to Use:
Add this indicator to a lower timeframe chart (e.g., 1m, 5m, or 15m).
Select a higher timeframe (must be greater than your chart timeframe).
Customize your candle colors and transparency for better visibility.
Watch as each higher timeframe candle evolves live with every bar.
📌 Example: Use a 5-minute chart with a 1-hour HTF overlay to track hourly market structure without switching timeframes.
Candlestick analysis

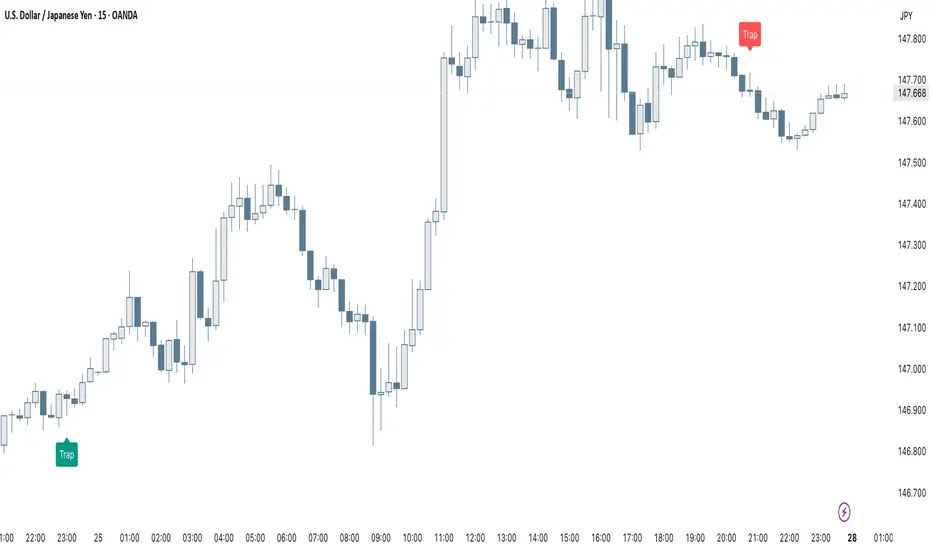
Smart Trap Candle Detector [Pro]Purpose
The Smart Trap Candle Detector is designed to identify common fakeout scenarios in the market, where price breaks a key swing high or low and quickly reverses. These “trap candles” often mislead breakout traders and are commonly used by smart money to induce liquidity before reversing.
How It Works
The script detects potential trap candles using these conditions:
A bearish trap is identified when price breaks above a recent swing high and closes back below it.
A bullish trap is identified when price breaks below a recent swing low and closes back above it.
Optional confirmation from the previous candle’s direction can be enabled.
Swing highs/lows are calculated dynamically using a configurable lookback window.
Once a trap candle is confirmed, a signal is displayed on the chart along with optional labels and alert conditions.
Features
Detects fake breakouts of swing highs and lows
Configurable swing lookback period
Optional confirmation candle filter
Optional label display on trap bars
Built-in alerts for bullish and bearish trap signals
Lightweight, real-time signal detection
Usage Tips
Best used on intraday timeframes such as 15m, 30m, or 1H
Use around key support/resistance zones or liquidity areas
Combine with other confluence signals such as order blocks or RSI divergence
Adjust the swing lookback period depending on the volatility of the asset
SMT Divergence x outofoptions🔍 SMT Divergence — Advanced Market Correlation Analysis
This was created with and approved by @outofoptions to bring you smaller SMTs based on his original SMT Divergence indicator
SMT Divergence is a sophisticated technical analysis indicator designed to identify high-probability reversal and continuation signals through intelligent correlation analysis between related markets. This powerful tool reveals hidden market dynamics by comparing price action divergences across correlated instruments, providing traders with institutional-level market insight.
🎯 Core Capabilities:
Multi-Market Analysis : Automatically compares your chart with a correlated instrument to identify divergence patterns and market inefficiencies
Smart Liquidity Detection : Advanced algorithms identify key liquidity levels and sweep patterns for enhanced signal accuracy
Dynamic Divergence Mapping : Real-time visualization of bullish and bearish divergences with customizable line styles and colors
Intelligent Signal Validation : Optional candle-based confirmation system to filter high-probability setups from noise
Automated Line Management : Smart removal of invalidated divergences to maintain clean, actionable chart analysis
📊 Professional Features:
The SMT Divergence indicator excels at revealing market structure imbalances that often precede significant price movements. By analyzing the relationship between correlated markets, it identifies when institutional money may be positioned differently than retail sentiment suggests, providing early warning signals for potential reversals.
⚙️ Advanced Customization:
Flexible correlation pair selection for any market combination
Customizable visual styling with multiple line types and color schemes
Adjustable validation criteria for different trading styles
Professional alert system with detailed message customization
Automatic cleanup of broken or invalidated divergences
🎨 Visual Excellence:
Clean, professional line drawing with customizable styling
Dynamic labeling system with size and color options
Real-time divergence tracking and management
Institutional-grade chart presentation
Optimized performance for extended analysis periods
📈 Ideal For:
Swing traders seeking high-probability reversal signals
Multi-market analysts comparing correlated instruments
Institutional-style traders using correlation analysis
Advanced technical analysts studying market structure
Those seeking early warning signals for trend changes
🔔 Smart Alerts:
Comprehensive alert system with customizable messaging allows you to stay informed of new divergences across multiple timeframes and market sessions, ensuring you never miss critical market developments.
💡 Market Intelligence:
SMT Divergence transforms complex inter-market relationships into clear, actionable signals, giving you the same analytical edge used by professional trading institutions to identify market turning points before they become obvious to retail traders.
Educational Tool: This indicator is designed for educational and analytical purposes. Divergence analysis requires understanding of market correlation principles. Always combine with proper risk management and additional analysis methods.

HTF Sweep Model with CISD Table vmodA mod of NotProfGreens w/ alerts and some stylish options- thanks for your work.

Day‑trade Long/Short Signalsday trade Long\Short signals idskator
Displays EMA 5, 8, and 13 to track the trend.
Signals LONG when EMA5 crosses above EMA8 and the MACD line is above the signal line.
Signals SHORT when EMA5 crosses below EMA8 and the MACD line is below the signal line.

PHL Sweep Signals(1 Hour)PHL Sweep Signals (Full History)
This indicator is designed to identify high-probability reversal setups by detecting liquidity sweeps of the previous standard hour's high and low (PHL). It provides clear, actionable signals complete with visual aids and a data table to keep you in tune with the higher-timeframe context.
Key Features
Previous Hour Levels: Automatically draws the high and low of the previous standard hour as key reference lines for the current trading hour. The line colors rotate to provide a clear visual separation.
Bearish Sweep Signal: Identifies a specific bearish pattern: a green (bullish) candle that wicks above the previous hour's high but fails to hold, with its body remaining entirely below the line.
Bullish Sweep Signal: Identifies the opposite bullish pattern: a red (bearish) candle that wicks below the previous hour's low but is absorbed, with its body remaining entirely above the line.
Clear Visual Signals: When a signal is confirmed, the indicator provides a multi-faceted alert:
Plots a "Buy" or "Sell" arrow on the chart.
Draws a colored box around the signal candle for easy identification.
Displays a label with the potential Stop Loss size (calculated from the size of the signal candle).
Informative Display Table: Includes a convenient table in the corner showing the Open and Close data for the last 3 hours, helping you stay aware of the broader market context without leaving your chart.
Built-in Alerts: Triggers an alert for every confirmed Buy and Sell signal so you never miss a potential setup.
How to Use
This indicator helps you spot potential exhaustion and reversals at key hourly levels.
A "Sell" signal suggests a failed breakout to the upside, indicating potential weakness and a possible entry for shorts.
A "Buy" signal suggests a failed breakdown to the downside, indicating potential strength and a possible entry for longs.
As with any tool, these signals are most powerful when used as part of a comprehensive trading strategy and combined with your own analysis for confirmation.
Optimal Settings:
Timeframe: 5-Minute
Time Zone: UTC-4 (New York Time)
-ratheeshinv

Current Hourly Open Liquidity with Sweep DetectionStatistics indicate that if the current hourly candle reaches the high or low of the previous hourly candle, there is a strong likelihood that the price will return to the current hour's open, depending on how quickly the previous hour's high or low was swept. If the sweep occurs within the first 20 minutes, there is a 75% chance the current hour's open will be reached; if it takes between 21 and 40 minutes, the probability decreases to 50%; and if it takes longer than 41 minutes, the chance drops to 25%.
These statistics can help identify manipulation on the hourly timeframe and guide trade decisions accordingly. For instance, if the previous hourly high is taken within the first 20 minutes but the current hour's open is not reached, it may be wise to avoid long positions until it happens or consider short positions in the direction of the open liquidity, using your existing entry rules and risk management.
The indicator highlights the current hour's open with a line and label to visually represent that liquidity pool, adjusting the line's color based on whether and when the previous hour's high or low was tapped. Once the open is reached, the indicator can, depending on settings, remove the line and label from the chart (this is enabled by default) since the liquidity pool is no longer relevant, preventing chart clutter.
All colors, line widths, label text sizes, and colors can be customized.

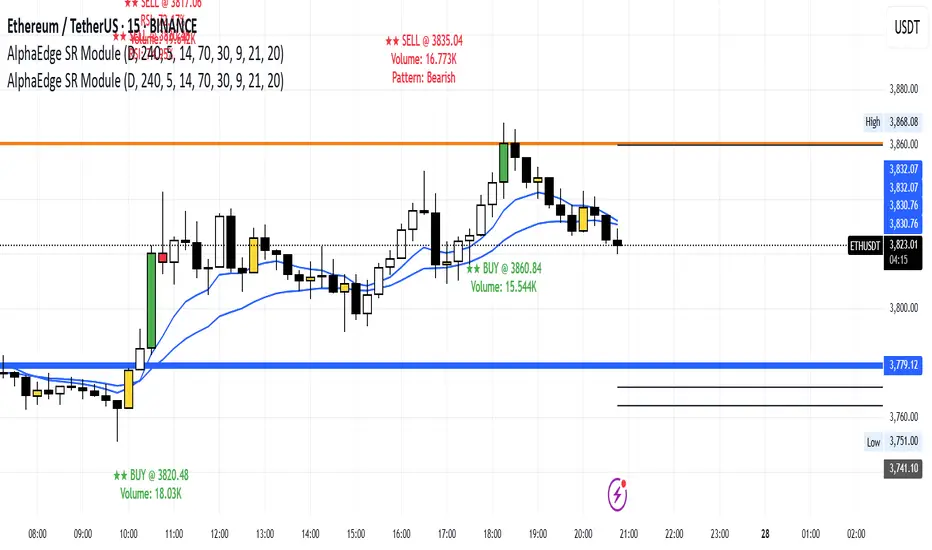
AlphaEdge SR Modulentroducing AlphaEdge SR Module – a powerful tool that combines:
🔹 Clean S/R Zones (Daily & 4H)
🔹 EMA Trend Filters
🔹 RSI OB/OS Highlighting
🔹 Reversal Candle Detection (Engulfing, Pin Bar, Doji)
🔹 Volume Spike Highlighting
🔹 Smart Signal Labels with EMA, RSI, and Volume
Optimized for Gold (XAUUSD), Forex, and Crypto on 1H+ timeframes.
Use it for trend reversals, breakouts, or S/R scalping.
🎯 Public & Free – Search “AlphaEdge SR Module” under Community Scripts.
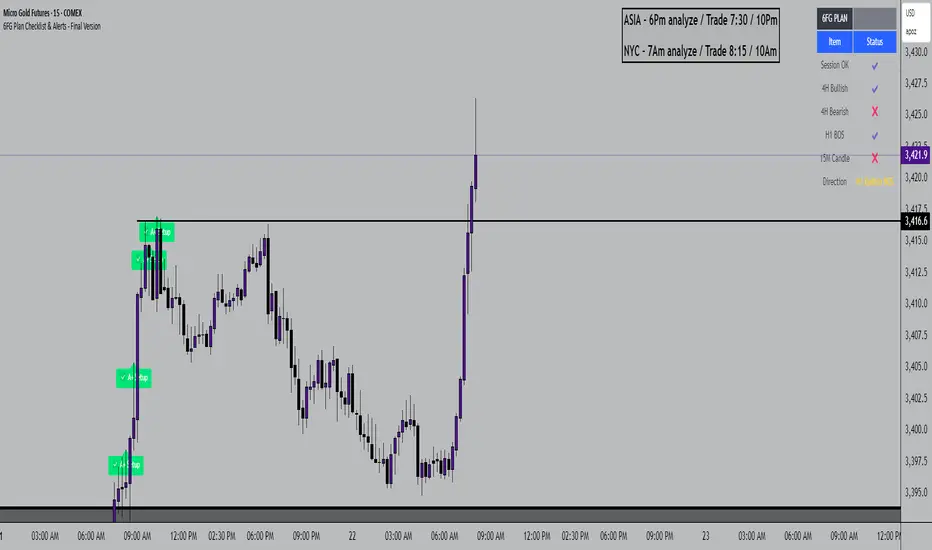
6FG Plan Checklist & Alerts - Final Version🧠 SCRIPT OVERVIEW: "6FG A+ SETUP - Simplified"
This script is designed to identify high-probability A+ trade setups in alignment with your personal 6FG trading plan, based on:
H1 Break of Structure (required)
4H trend confirmation
15M candle confirmation
Session filter
A+ Label & Visual Table Checklist
✅ KEY COMPONENTS
1. Toggle Inputs
These allow you to customize your view and filters without changing the code:
showSession: Only allow alerts inside Asian or NY sessions
show4hTrend: Include or ignore 4H directional bias
show15mConfirm: Include or ignore confirmation from 15M candles
showTable: Display checklist table on chart
showLabel: Display the “✅ A+” label on qualifying bars
2. Session Filter
Defines valid timeframes for trading (Asian or New York)
Helps avoid setups during low-liquidity hours
Controlled by showSession
3. 4H Trend (Confirmation Only)
Uses a 20-period SMA on 4H to detect general bias:
Bullish = Price above SMA
Bearish = Price below SMA
This trend is not mandatory for an alert if toggle is off
4. H1 Break of Structure (REQUIRED)
Looks at the highest high and lowest low of the last 10 candles on the 1H timeframe
Detects either:
Bullish BOS = Current close > highest high
Bearish BOS = Current close < lowest low
This is the core trigger for the A+ setup
If BOS doesn't happen, no entry is valid
5. 15M Confirmation Candles
(Optional - controlled by show15mConfirm)
Checks for one of three confirmation patterns:
Bullish Engulfing
Bearish Engulfing
Pin Bar
This adds confidence but can be toggled off
6. Entry Conditions (A+ Setup)
All the following must be true for entryOK = true:
✅ H1 BOS (required)
✅ Session is valid (if toggle is on)
✅ 15M confirmation pattern (if toggle is on)
✅ 4H trend (if toggle is on)
7. Visual Output
If entryOK = true:
✅ A green "A+" label appears below price
✅ A checklist table on the top-right shows:
Session status ✔️❌
4H bullish/bearish ✔️❌
H1 BOS ✔️❌
15M confirmation ✔️❌
Final Direction: Bullish / Bearish / —
A+ Setup: ✔️❌
8. Alerts
You will receive a TradingView alert when an A+ Setup is detected:
FVG + IFVG Gap (ULTRA) by Aditya NejeThis Indicator shows Fair Value Gap and Inverse Fair Value gaps

Crypto DanR 1.4.2 PC-Roye Edition📜 Crypto DanR 1.4.2 — PC Roye Edition (Open Source)
This indicator combines Smart Money Concepts (SMC), Liquidity Analysis, and Trend Filtering to provide traders with a high-quality tool for intraday and swing trading on assets like XRP/USDT.
✅ What This Script Does
Crypto DanR 1.4.2 integrates the following advanced features:
Break of Structure (BOS) & Change of Character (CHoCH):
Detects key shifts in market structure
Helps confirm trend direction and reversal points
Fair Value Gaps (FVG):
Displays unmitigated liquidity voids using a style inspired by LuxAlgo
Highlights potential retracement zones where smart money may re-enter
Equal Highs / Equal Lows (EQH/EQL):
Marks liquidity zones that institutions often target before reversals
Order Blocks (OB):
Identifies potential institutional demand/supply zones
Option to filter by wick, body, or mitigation logic
Fibonacci Volatility Bands (based on BigBeluga’s logic):
Detects potential price extremes using Fib extensions on volatility
10 Moving Averages in One (inspired by hiimannshu's script):
Supports 10 custom MAs (SMA, EMA, RMA, HMA, VWMA, etc.) with adjustable source and timeframe
Ideal for trend filtering or dynamic support/resistance
Vector Candles (TradersReality / PVSRA):
Color-coded candles showing real-time volume pressure and trend bias
Visual Trade Plan:
Optional overlay for entry, stop-loss, and take-profit planning
Displays risk-to-reward ratio and potential % gain/loss live
🧠 How It Works
The script uses a price-action-first approach, built around concepts from Smart Money Theory. CHoCH and BOS detect structural shifts, while FVGs and OBs help forecast likely reaction zones. The multiple moving averages act as a trend filter to avoid entering against momentum.
This combination allows traders to:
Enter on mitigations or breakouts
Set stops outside liquidity zones
Manage trades visually with dynamic risk/reward levels
📊 Best Use Cases
15m or 1h scalping (ideal)
Swing trading on 4h
Works well on crypto, FX, and indices
🙏 Credits
TradersReality for PVSRA logic via public library
LuxAlgo for FVG inspiration
hiimannshu for 10-in-1 MA logic
BigBeluga for Fibonacci Bands methodology
All reused logic is significantly modified and part of a broader framework.
📌 Notes
Script is open-source to promote transparency and collaboration
Please do not copy-paste and republish without adding meaningful improvements
Feedback and suggestions welcome!

Dr. Keith Wade Momentum SignalsThis is a heikin Ashli strategy combined with an 18 moving average crossover. Entry at cross of 18 EMA and exit at change of heikin Ashi

Volume Surge Detector[SpeculationLab]Volume Surge Detector
This tool is especially useful for spotting early signs of breakouts, news-driven spikes, or institutional activity that are often preceded by abnormal surges in volume.
For better chart readability, the volume bar colors are based on TradingView’s original Volume indicator, while all other code is fully original by Speculation Lab.
You can customize both the SMA line and the volume bar colors to fit your style.
The logic compares the current volume against its SMA (default length: 14, fully adjustable).
The script comes with two surge levels:
Surge Level 1 (default = 5) → When volume is more than 5× the SMA, the bar turns aqua.
Surge Level 2 (default = 10) → When volume is more than 10× the SMA, the bar turns yellow.
It also includes built-in alerts, so you’ll be notified instantly whenever a surge is detected.
This makes it easier to spot potential breakout moves or large market participation in real time.
Disclaimer: This script is for educational purposes only. It does not provide financial advice.
这是一个用于探测 成交量爆发 的指标。
为了图表美观,成交量柱的颜色借鉴了 TradingView 原始 Volume 指标,其余代码均为 Speculation Lab 原创。
用户可以自由调整成交量柱和其对应的 SMA 均线的颜色。
指标通过对比成交量和其 SMA(默认长度为14,可自定义长度和颜色)的比例来检测放量。
默认设置了两个放量级别:
Surge Level 1(默认=5):当成交量超过均量的 5 倍时,量柱变为水蓝色。
Surge Level 2(默认=10):当成交量超过均量的 10 倍时,量柱变为黄色。
脚本还设置了 内置警报功能,方便交易者在出现放量时实时收到通知。

Clarix Smart FlipPurpose
This tool identifies high-probability intraday reversals by detecting when price flips through the daily open after strong early-session commitment.
How It Works
A valid flip occurs when:
The previous daily candle is bullish or bearish
The first hour today continues in the same direction
Then, the price flips back through the daily open with a minimum break threshold (user-defined)
This setup is designed to catch liquidity grabs or fakeouts near the daily open, where early buyers or sellers get trapped after showing commitment
Signal Logic
Buy Flip
Previous day bearish → first hour bearish → price flips above open
Sell Flip
Previous day bullish → first hour bullish → price flips below open
Features
Configurable flip threshold in percentage
Signals only activate after the first hour ends
Daily open line displayed on chart
Simple triangle markers with no visual clutter
Alerts ready to use for automation or notifications
Usage Tips
Use "Once Per Bar" alert mode to get notified immediately when the flip happens
Works best in active markets like FX, indices, or crypto
Adjust threshold based on asset volatility
Suggested stop loss: use the previous daily high for sell flips or the previous daily low for buy flips
Suggested take profit: secure at least 30 pips to aim for a 1:3 risk-to-reward ratio on average


CRT Impulse Detector - Bull & BearHelps Identify Impulse Candles, only triggering those that break recent swings.

CBC Flip with Volume [Pt]█ CBC Flip with Volume
A price-action based indicator that detects real-time control flips between bulls and bears, enhanced with volume filtering and Pine Screener compatibility.
This tool tracks when the market shifts from bear control to bull control or vice versa, using candle structure and volume behavior. It highlights key reversal points, filters low-conviction moves, and provides two screener-ready outputs for directional monitoring.
█ What It Detects
This script identifies when control flips between buyers and sellers on a candle-by-candle basis. A flip is confirmed only when both price structure and volume meet strict criteria. The indicator uses an internal state to track who is in control and updates when a flip occurs.
█ Flip Conditions
Bull Flip
• Previous bar was under bear control
• Current candle closes above the previous high
• Candle is bullish (close is above open)
• Volume is greater than the previous bar
Bear Flip
• Previous bar was under bull control
• Current candle closes below the previous low
• Candle is bearish (close is below open)
• Volume is greater than the previous bar
When a flip occurs, the indicator updates the control state and records the open price of the flip candle.
█ Strong Flip Detection
A flip is considered strong when volume is also greater than the average volume over a set number of candles (default is 50). Strong flips are visually emphasized using larger markers and darker background shading. This helps filter out moves that lack follow-through volume.
█ Visual Elements on Chart
• Bull Flip (Normal): Small teal triangle below the candle
• Bull Flip (Strong): Larger green triangle below the candle
• Bear Flip (Normal): Small salmon triangle above the candle
• Bear Flip (Strong): Larger red triangle above the candle
• Background Color:
– Green shades for bull flips
– Red shades for bear flips
– Darker color when flip is strong
These visual elements appear only on the candle where a flip is detected. No markers are shown on continuation candles.
█ Inputs
• Volume MA Lookback : Sets the moving average length used for determining whether volume is high enough for a strong flip (default: 50)
█ Alerts
• Bull Flip – Notifies when bulls take control
• Bear Flip – Notifies when bears take control
Alerts are triggered at candle close.
█ Pine Screener Support
This script includes two output columns for TradingView’s Pine Screener:
• Bull in Control (% gain) : Shows the percentage gain from the bull flip’s open to the current close. Resets to 0 when bulls lose control.
• Bear in Control (% gain) : Shows the percentage drop from the bear flip’s open to the current close (as a positive number). Resets to 0 when bears lose control.
These outputs allow you to filter for active moves. For example:
• Bull in Control (% gain) > 2.0 to find strong uptrends
• Bear in Control (% gain) > 1.5 to find sharp breakdowns
█ Use Cases
• Confirm breakouts using volume-backed flips
• Spot short-term reversals at key zones
• Filter out low-volume chop
• Combine screener results with trend or volatility filters
• Build entries around control flips and follow-through strength
Inspired by MapleStax’s original CBC method.

Crypto DanR 1.4.2 PC-Roye Edition📜 Crypto DanR 1.4.2 — PC Roye Edition (Open Source)
This indicator combines Smart Money Concepts (SMC), Liquidity Analysis, and Trend Filtering to provide traders with a high-quality tool for intraday and swing trading on assets like XRP/USDT.
✅ What This Script Does
Crypto DanR 1.4.2 integrates the following advanced features:
Break of Structure (BOS) & Change of Character (CHoCH):
Detects key shifts in market structure
Helps confirm trend direction and reversal points
Fair Value Gaps (FVG):
Displays unmitigated liquidity voids using a style inspired by LuxAlgo
Highlights potential retracement zones where smart money may re-enter
Equal Highs / Equal Lows (EQH/EQL):
Marks liquidity zones that institutions often target before reversals
Order Blocks (OB):
Identifies potential institutional demand/supply zones
Option to filter by wick, body, or mitigation logic
Fibonacci Volatility Bands (based on BigBeluga’s logic):
Detects potential price extremes using Fib extensions on volatility
10 Moving Averages in One (inspired by hiimannshu's script):
Supports 10 custom MAs (SMA, EMA, RMA, HMA, VWMA, etc.) with adjustable source and timeframe
Ideal for trend filtering or dynamic support/resistance
Vector Candles (TradersReality / PVSRA):
Color-coded candles showing real-time volume pressure and trend bias
Visual Trade Plan:
Optional overlay for entry, stop-loss, and take-profit planning
Displays risk-to-reward ratio and potential % gain/loss live
🧠 How It Works
The script uses a price-action-first approach, built around concepts from Smart Money Theory. CHoCH and BOS detect structural shifts, while FVGs and OBs help forecast likely reaction zones. The multiple moving averages act as a trend filter to avoid entering against momentum.
This combination allows traders to:
Enter on mitigations or breakouts
Set stops outside liquidity zones
Manage trades visually with dynamic risk/reward levels
📊 Best Use Cases
15m or 1h scalping (ideal)
Swing trading on 4h
Works well on crypto, FX, and indices
🙏 Credits
TradersReality for PVSRA logic via public library
LuxAlgo for FVG inspiration
hiimannshu for 10-in-1 MA logic
BigBeluga for Fibonacci Bands methodology
All reused logic is significantly modified and part of a broader framework.
📌 Notes
Script is open-source to promote transparency and collaboration
Please do not copy-paste and republish without adding meaningful improvements
Feedback and suggestions welcome!

ORB Scalp setup by UnenbatDescription
ORB Scalp Setup by Unenbat is a precise breakout scalping tool that identifies short-term price ranges at the transition between hourly sessions.
📌 Core Features:
Draws a dynamic box using the price range from the last 3 minutes of the previous hour and the first 3 minutes of the new hour (total 5m59s range).
Automatically plots:
Box representing the selected range.
Opening Price Line at the start of the hour.
TP Lines (Take Profit) above and below the box at customizable distances.
BE Lines (Break-Even) above and below the box at customizable distances.
Box and line lengths are user-defined (default: 60 minutes).
Works across historical data (up to the last 100 days).
Fully customizable visuals (colors, offsets, visibility toggles).
🎯 How to Use:
Ideal for scalp traders using breakout strategies.
Enter trades when price breaks above or below the box range.
Use TP and BE lines as clear reference levels for exits or trailing stop logic.
⚙️ Custom Settings:
Enable/disable each component (box, open line, TP line, BE line).
Set your own offset in pips for TP/BE lines.
Adjust the box duration to match your trading style.
Modify start and end times of the range as needed.

Money Printer 1.0bollinger band candle body closes, while using the 100,200 ema for shorts, longs, take profit at the middle of the bollinger bands

Volume in ₹ (Total Traded Value in Crores)vikram dayal volume chart with total traded value in crores

HTF CandlesFull credit to cdikici71 - this is a stripped down version of cd_sweep&cisd_Cx to provide a clean higher timeframe (HTF) candle overlay. Choose colors for candles & font along with timeframe to overlay the HTF on any other timeframe.
Simple and Clean!