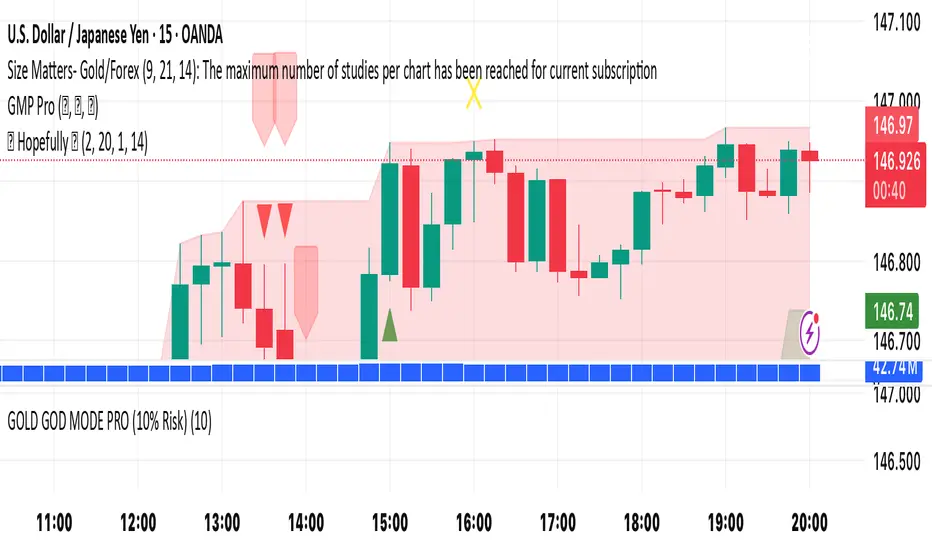
🚀 Hopefully 🤲🏻It’s a simple yet effective indicator. Its power level is high. Its secret lays in its dynamics. Simply “BUY’ when you see green triangle & "SELL" when you see red triangle 🔺. Do your own due diligence and remember to always be disciplined and focused 🧘
Happy trading to you all ☮️
Candlestick analysis
EMA Crossover Candle Colorema crossover for the 21 and 8 ema cross that changes the candle a different color

Daily % MoveThis indicator notates each candle with the total percentage that the stock moved for that candle.

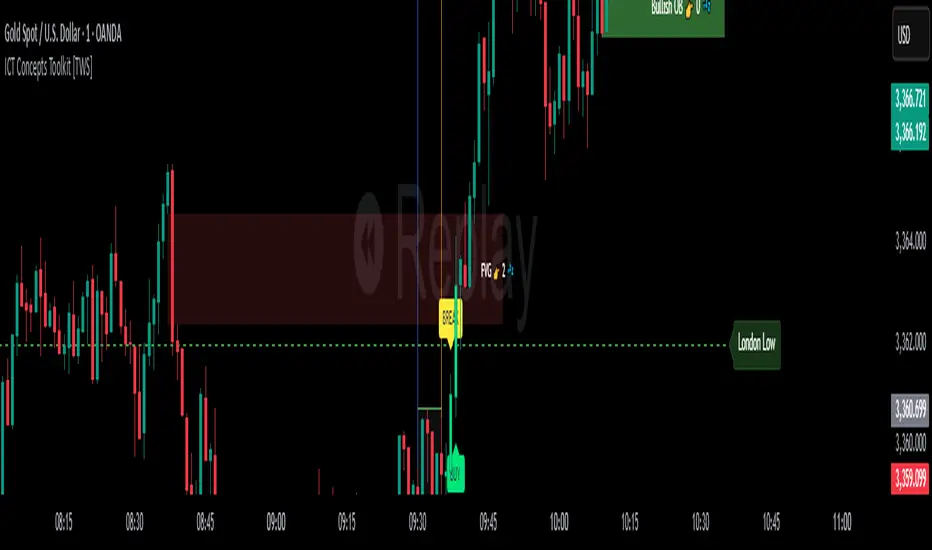
ICT Concepts Toolkit [TWS]
ICT Concepts Toolkit – by Trade With Stevie
Unlock the full power of Inner Circle Trader (ICT) concepts with this all-in-one indicator built for serious traders.
The ICT Concepts Toolkit combines the most powerful price action tools into one clean, efficient, and highly customizable interface — perfect for mastering market structure and timing precision entries.
✅ Features Included:
🟩 Order Blocks – Automatically detect key institutional levels for potential reversals and entries.
📉 Fair Value Gaps (FVGs) – Visualize imbalances in price action to spot high-probability targets and mitigation zones.
📊 Support & Resistance – Dynamically plotted levels to track market structure and trend shifts in real-time.
📅 Previous Daily Highs/Lows – Key liquidity zones marked for precision scalping and swing setups.
🕒 Session Zones – Clearly defined Asian, London, and New York sessions with customizable times and colors.
📌 Extension Lines – Extends each session’s high and low to the current candle for ongoing bias and liquidity mapping.
🚦ICT Morning Signal – Your personal directional bias assistant: smart signals showing when to Buy or Sell based on ICT’s powerful Morning Model logic.
Whether you're trading Forex, Futures, or Crypto — this toolkit gives you a cleaner chart, clearer bias, and more confidence in your setups.
💡 Created by Trade With Stevie — follow for more smart tools and signal insights.
10/20 EMA + 50/200 SMA10/20 EMA + 50/200 SMA all in one indicator to help you analyze your trades in a more efficient way.

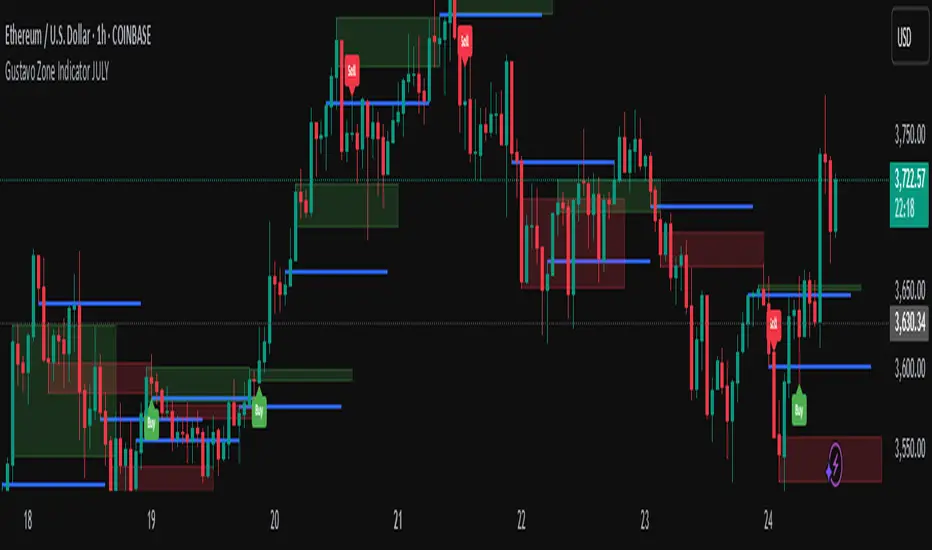
Gustavo Zone Indicator JULYThis indicator watches for runs of at least three consecutive green (or red) candles followed by an opposite-color candle, then marks that reversal zone by drawing a rectangle from the wicks of the first two run candles. It optionally plots a horizontal “target” line at the wick of the third run candle. While the zone is active, if three bars in a row close beyond both the zone boundary and the target line, it issues a customizable “Sell” label above the bar (after bullish runs) or a “Buy” label below the bar (after bearish runs). All colors, text labels, sizes, offsets, and toggles for the zones, lines, and signals can be adjusted in the input settings.
God's Plan 7.1This is a buy/sell indicator containing the code for the Top Bottom indicator, VWAP and 9 EMA.
Buy conditions are Top Bottom buy and 9 EMA crossing above the VWAP.
Sell conditions are Top Bottom sell and 9 EMA crossing below the VWAP.
C signals indicate continuations.
Zero TOD constraints.
This is a simple strategy to help train the eye to recognize trend shifts and potential entries.
It is important for the users of this strategy to use their own logic when determining stop loss and targets.
Thank you to all of the coders and creators that have provided us with inspiration for this strategy. Happy trading!
Open-source script
In true TradingView spirit, the creator of this script has made it open-source, so that traders can review and verify its functionality. Kudos to the author! While you can use it for free, remember that republishing the code is subject to our House Rules.
todaywewin73
Disclaimer
The information and publications are not meant to be, and do not constitute, financial, investment, trading, or other types of advice or recommendations supplied or endorsed by TradingView. Read more in the Terms of Use.
0 comments

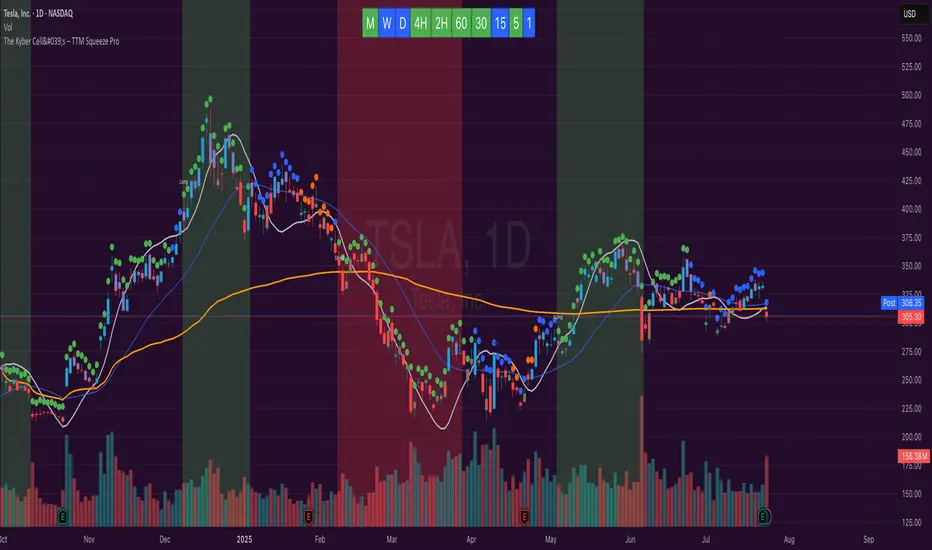
The Kyber Cell's – TTM Squeeze ProThe Kyber Cell’s TTM Squeeze Pro
TTM Squeeze + ALMA + VWAP for Precision Trade Timing
⸻
1. Introduction
Kyber Cell’s Squeeze Pro is a comprehensive, all-in-one overlay indicator built on top of John Carter’s famous TTM Squeeze concept. It integrates advanced momentum and trend analysis using Arnaud Legoux Moving Averages (ALMA), a scroll-aware VWAP with optional deviation bands, and a clean, user-friendly visual system. The goal is simple: give traders a clear and configurable chart that identifies price compression, detects release moments, confirms direction, and helps manage risk and reward visually and effectively.
This tool is intended for traders of all styles — scalpers, swing traders, or intraday strategists — looking for cleaner signals, better visual cues, and more confidence in entry/exit timing.
⸻
2. Core Concepts
At its heart, the Squeeze Pro builds an in-chart visualization of the TTM Squeeze, a strategy that identifies when price volatility compresses inside a Bollinger Band that is narrower than a Keltner Channel. These moments often precede explosive breakouts. This version categorizes squeezes into three levels of compression:
• Blue Dot – Low Compression
• Orange Dot – Medium Compression
• Red Dot – High Compression
When the squeeze “fires” (i.e., the Bollinger Bands expand beyond all Keltner thresholds), the indicator flips to a Green Dot, signaling potential entry if confirmed by trend direction.
The indicator also includes a momentum model using linear regression on smoothed price deviation to determine directional bias. Momentum is further reinforced by a customizable trend engine, allowing you to switch between EMA-21 or HMA 34/144 logic.
An ALMA ribbon is plotted across the chart to represent smoothed trend strength with minimal lag, and a scroll-aware VWAP (Volume-Weighted Average Price) line, optionally with ±σ bands, helps confirm mean-reversion or momentum continuation setups.
⸻
3. Visual Components
Squeeze Pro replaces the traditional histogram with bar coloring logic based on your selected overlay mode:
• Momentum Mode colors bars based on whether momentum is rising or falling and in which direction (aqua/blue for bullish, red/yellow for bearish).
• Trend Mode colors bars using EMA or HMA logic to identify whether price is in a bullish, bearish, or neutral trend state.
A colored backdrop is triggered when a squeeze fires and momentum direction is confirmed. It remains green for bullish runs and red for bearish runs. The background disappears when the trend exhausts or reverses.
Each squeeze level (low, medium, high) is plotted as tiny dots above or below candles, with configurable colors. On the exact bar where the squeeze fires, the indicator optionally plots entry markers — either arrows or triangles — which can be placed with adjustable padding using ATR. These provide an at-a-glance signal of possible long or short entries.
EXPERIMENTAL : For risk and reward management, protective stop lines and limit targets can be toggled on. Stops are calculated using either recent swing highs/lows or a fixed ATR multiple, depending on user preference. Limit targets are calculated from entry price using ATR-based projections.
All colors are customizable.
⸻
4. Multi-Timeframe Squeeze Panel
An optional MTF Squeeze Panel appears in the top-right corner of the chart, displaying the squeeze status across multiple timeframes — from 1-minute to Monthly. Each timeframe is color-coded:
• Red for High Compression
• Orange for Medium Compression
• Blue for Low Compression
• Yellow for Open/No Compression
This provides rapid context for whether multiple timeframes are simultaneously compressing (a common precursor to explosive moves), helping traders align higher- and lower-timeframe signals. Colors are customizable.
The MTF panel dynamically adjusts to chart space and only renders the selected intervals for clarity and performance.
⸻
5. Inputs and Configuration Options
Squeeze Pro offers a rich configuration suite:
• Squeeze Settings: Control the Bollinger Band standard deviation, and three separate Keltner Channel multipliers (for low, medium, and high compression zones).
• ALMA Controls: Adjust the smoothing length, offset, and σ factor to control ribbon sensitivity.
• VWAP Options: Toggle VWAP on/off and optionally show ±σ bands for mean reversion signals.
• Entry Markers: Customize marker shape (arrow or triangle), size (tiny to huge), color, and padding using ATR multipliers.
• Stops and Targets:
• Choose between Swing High/Low or ATR-based stop logic.
• Define separate ATR lengths and multipliers for stops and targets.
• Independently toggle their visibility and color.
• Bar Coloring Mode: Select either Momentum or Trend logic for bar overlays.
• Trend Engine: Choose between EMA-21 or HMA 34/144 for identifying trend direction.
• Squeeze Dot Colors: Customize the colors for each compression level and release state.
• MTF Panel: Toggle visibility per timeframe — from 1m to Monthly.
This high degree of customization ensures that the indicator can adapt to nearly any trading style or preference.
⸻
6. Trade Workflow Suggestions
To get the most out of this tool, traders can follow a consistent workflow:
1. Watch Dot Progression: Blue → Orange → Red indicates increasing compression and likelihood of breakout.
2. Enter on Green Dot: When the squeeze fires (green dot), confirm entry direction with bar color and backdrop.
3. Use Confirmation Tools:
• ALMA should slope in the trade direction.
• VWAP should support the price move or confirm expansion away from mean.
4. Manage Risk and Reward (experimental):
• Respect stop-loss placements (Swing/ATR).
• Use ATR-based limit targets if enabled.
5. Exit:
• Consider exiting when momentum crosses zero.
• Or exit when the background color disappears, signaling potential trend exhaustion.
⸻
7. Alerts
Includes built-in alert conditions to notify you when a squeeze fires in either direction:
• “Squeeze Long”: Triggers when a green dot appears and momentum is bullish.
• “Squeeze Short”: Triggers when a green dot appears and momentum is bearish.
You can use these alerts for automation or to stay notified of new setups even when away from the screen.
⸻
8. Disclaimer
This indicator is designed for educational purposes only and should not be interpreted as financial advice. Trading is inherently risky, and any decisions based on this tool should be made with full awareness of personal risk tolerance and capital exposure.

God's Plan 7This is a buy/sell indicator containing the code for the Top Bottom indicator, VWAP and 9 EMA.
Buy conditions are Top Bottom buy and 9 EMA crossing above the VWAP.
Sell conditions are Top Bottom sell and 9 EMA crossing below the VWAP.
C signals indicate continuations.
Zero TOD constraints.
This is a simple strategy to help train the eye to recognize trend shifts and potential entries.
It is important for the users of this strategy to use their own logic when determining stop loss and targets.
Thank you to all of the coders and creators that have provided us with inspiration for this strategy. Happy trading!

🔔 NIFTY 100+ Points Early Move Signal (1H)//@version=5
indicator("🔔 NIFTY 100+ Points Early Move Signal (1H)", overlay=true)
// === Inputs === //
squeezePeriod = input.int(20, title="Price Squeeze Lookback")
rangeTrigger = input.float(100.0, title="Target Move (in Points)")
rsiLength = input.int(14, title="RSI Length")
macdFast = input.int(12)
macdSlow = input.int(26)
macdSignal = input.int(9)
volMultiplier = input.float(1.5, title="Volume Spike Multiplier")
// === RSI & MACD === //
rsi = ta.rsi(close, rsiLength)
= ta.macd(close, macdFast, macdSlow, macdSignal)
macdBullish = macdLine > signalLine
macdBearish = macdLine < signalLine
// === Price Compression === //
hh = ta.highest(high, squeezePeriod)
ll = ta.lowest(low, squeezePeriod)
compressionRange = hh - ll
tightCompression = compressionRange < (rangeTrigger * 0.6) // Pre-expansion
// === Volume Spike === //
avgVol = ta.sma(volume, 20)
volSpike = volume > avgVol * volMultiplier
// === Early Signal Logic === //
bullSetup = tightCompression and rsi > 50 and macdBullish and volSpike
bearSetup = tightCompression and rsi < 50 and macdBearish and volSpike
// === Plotting Signals === //
plotshape(bullSetup, title="Bullish Setup", location=location.belowbar, color=color.green, style=shape.labelup, text="100↑")
plotshape(bearSetup, title="Bearish Setup", location=location.abovebar, color=color.red, style=shape.labeldown, text="100↓")
bgcolor(bullSetup ? color.new(color.green, 85) : na)
bgcolor(bearSetup ? color.new(color.red, 85) : na)
// === Alerts === //
alertcondition(bullSetup, title="Bullish 100pt Setup", message="🚀 NIFTY: 100+ point UP move likely!")
alertcondition(bearSetup, title="Bearish 100pt Setup", message="🔻 NIFTY: 100+ point DOWN move likely!")

3 EMA Signal with Cleaned Dual Entry Logic3-EMA Trend Following Indicator with Buy/Sell Signals
EMA1 = Slow EMA (default 100)
EMA2 = Fast EMA (default 10)
EMA3 = Medium EMA (default 20)
Trend is bullish when EMA2 and EMA3 are above EMA1
Buy when EMA2 crosses above EMA3 in bullish trend
Sell when EMA2 crosses below EMA3 in bearish trend
Entry and exit points are plotted on chart

ICT TOOLS//@version=5
indicator("ICT TOOLS", overlay=true, max_lines_count=500, max_labels_count=5, max_boxes_count=500)
// General Settings Inputs
TZI = input.string (defval="UTC -4", title="Timezone Selection", options= , tooltip="Select the Timezone. ( Shifts Chart Elements )", group="Global Settings")
Timezone = TZI == "UTC -10" ? "GMT-10:00" : TZI == "UTC -7" ? "GMT-07:00" : TZI == "UTC -6" ? "GMT-06:00" : TZI == "UTC -5" ? "GMT-05:00" : TZI == "UTC -4" ? "GMT-04:00" : TZI == "UTC -3" ? "GMT-03:00" : TZI == "UTC +0" ? "GMT+00:00" : TZI == "UTC +1" ? "GMT+01:00" : TZI == "UTC +2" ? "GMT+02:00" : TZI == "UTC +3" ? "GMT+03:00" : TZI == "UTC +3:30" ? "GMT+03:30" : TZI == "UTC +4" ? "GMT+04:00" : TZI == "UTC +5" ? "GMT+05:00" : TZI == "UTC +5:30" ? "GMT+05:30" : TZI == "UTC +6" ? "GMT+06:00" : TZI == "UTC +7" ? "GMT+07:00" : TZI == "UTC +8" ? "GMT+08:00" : TZI == "UTC +9" ? "GMT+09:00" : TZI == "UTC +9:30" ? "GMT+09:30" : TZI == "UTC +10" ? "GMT+10:00" : TZI == "UTC +10:30" ? "GMT+10:30" : TZI == "UTC +11" ? "GMT+11:00" : TZI == "UTC +13" ? "GMT+13:00" : "GMT+13:45"
inputMaxInterval = input.int (31, title="Hide Indicator Above Specified Minutes", tooltip="Above 30Min, Chart Will Become Messy & Unreadable", group="Global Settings")
// Session options
ShowTSO = input.bool (true, title="Show Today's Session Only", group="Session Options", tooltip="Hide Historical Sessions")
ShowTWO = input.bool (true, title="Show Current Week's Sessions Only", group="Session Options", tooltip="Show All Sessions from the current week")
SL4W = input.bool (true, title="Show Last 4 Week Sessions", group="Session Options", tooltip="Show All Sessions from Last Four Weeks Should Disable Current Week Session to Work")
ShowSFill = input.bool (false, title="Show Session Highlighting", group="Session Options", tooltip="Highlights Session from Top of the Chart to Bottom")
//----------------------------------------------
// Historical Lines
ShowMOPL = input.bool (title="Midnight Historical Price Lines", defval=false, group="Historical Lines", tooltip="Shows Historical Midnight Price Lines")
MOLHist = input.bool (title="Midnight Historical Vertical Lines", defval=true, group="Historical Lines", tooltip="Shows Historical Midnight Vertical Lines")
ShowPrev = input.bool (false, title="Misc. Historical Price Lines", group="Historical Lines", tooltip="Makes Chart Cluttered, Use For Backtesting Only")
//----------------------------------------------
// Session Bool
ShowLondon = input.bool (false, "", inline="LONDON", group="Sessions", tooltip="01:00 to 05:00")
ShowNY = input.bool (false, "", inline="NY", group="Sessions", tooltip="07:00 to 10:00")
ShowLC = input.bool (false, "", inline="LC", group="Sessions", tooltip="10:00 to 12:00")
ShowPM = input.bool (false, "",inline="PM", group="Sessions", tooltip="13:00 to 16:00")
ShowAsian = input.bool (false, "",inline="ASIA2", group="Sessions", tooltip="20:00 to 00:00")
ShowFreeSesh = input.bool (false, "",inline="FREE", group="Sessions", tooltip="Custom Session")
// Session Strings
txt2 = input.string ("LONDON", title="", inline="LONDON", group="Sessions")
txt3 = input.string ("NEW YORK", title="", inline="NY", group="Sessions")
txt4 = input.string ("LDN CLOSE", title="", inline="LC", group="Sessions")
txt5 = input.string ("AFTERNOON", title="", inline="PM", group="Sessions")
txt6 = input.string ("ASIA", title="", inline="ASIA2", group="Sessions")
txt9 = input.string ("FREE SESH", title="", inline="FREE", group="Sessions")
// CBDR = input.session ('1400-2000:1234567', "", inline="CBDR", group="Sessions")
// ASIA = input.session ('2000-0000:1234567', "", inline="ASIA", group="Sessions")
// Session Times
LDNsesh = input.session ('0200-0500:1234567', "", inline="LONDON", group="Sessions")
NYsesh = input.session ('0700-1000:1234567', "", inline="NY", group="Sessions")
LCsesh = input.session ('1000-1200:1234567', "", inline="LC", group="Sessions")
PMsesh = input.session ('1300-1600:1234567', "", inline="PM", group="Sessions")
ASIA2sesh = input.session ('2000-2359:1234567', "", inline="ASIA2", group="Sessions")
FreeSesh = input.session ('0000-0000:1234567', "", inline="FREE", group="Sessions")
// Session Color
LSFC = input.color (color.new(#787b86, 90), "", inline="LONDON", group="Sessions")
NYSFC = input.color (color.new(#787b86, 90), "",inline="NY", group="Sessions")
LCSFC = input.color (color.new(#787b86, 90), "",inline="LC", group="Sessions")
PMSFC = input.color (color.new(#787b86, 90), "",inline="PM", group="Sessions")
ASFC = input.color (color.new(#787b86, 90), "",inline="ASIA2", group="Sessions")
FSFC = input.color (color.new(#787b86, 90), "",inline="FREE", group="Sessions")
//----------------------------------------------
// Vertical Line Bool
ShowMOP = input.bool (title="", defval=true, inline="MOP", group="Vertical Lines", tooltip="00:00 AM")
txt12 = input.string ("MIDNIGHT", title="", inline="MOP", group="Vertical Lines")
ShowLOP = input.bool (title="", defval=false, inline="LOP", group="Vertical Lines", tooltip="03:00 AM")
txt14 = input.string ("LONDON", title="", inline="LOP", group="Vertical Lines")
ShowNYOP = input.bool (title="", defval=true, inline="NYOP", group="Vertical Lines", tooltip="08:30 AM")
txt15 = input.string ("NEW YORK", title="", inline="NYOP", group="Vertical Lines")
ShowEOP = input.bool (title="", defval=false, inline="EOP", group="Vertical Lines", tooltip="09:30 AM")
txt16 = input.string ("EQUITIES", title="", inline="EOP", group="Vertical Lines")
// Vertical Line Color
MOPColor = input.color (color.new(#787b86, 0), "", inline="MOP", group="Vertical Lines")
LOPColor = input.color (color.rgb(0,128,128,60), "", inline="LOP", group="Vertical Lines")
NYOPColor = input.color (color.rgb(0,128,128,60), "", inline="NYOP", group="Vertical Lines")
EOPColor = input.color (color.rgb(0,128,128,60), "", inline="EOP", group="Vertical Lines")
// Vertical LineStyle
Midnight_Open_LS = input.string ("Dotted", "", options= , inline="MOP", group="Vertical Lines")
london_Open_LS = input.string ("Solid", "", options= , inline="LOP", group="Vertical Lines")
NY_Open_LS = input.string ("Solid", "", options= , inline="NYOP", group="Vertical Lines")
Equities_Open_LS = input.string ("Solid", "", options= , inline="EOP", group="Vertical Lines")
// Vertical LineWidth
Midnight_Open_LW = input.string ("1px", "", options= , inline="MOP", group="Vertical Lines")
London_Open_LW = input.string ("1px", "", options= , inline="LOP", group="Vertical Lines")
NY_Open_LW = input.string ("1px", "", options= , inline="NYOP", group="Vertical Lines")
Equities_Open_LW = input.string ("1px", "", options= , inline="EOP", group="Vertical Lines")
//----------------------------------------------
// Opening Price Bool
ShowMOPP = input.bool (title="", defval=true, inline="MOPP", group="Opening Price Lines", tooltip="00:00 AM")
txt13 = input.string ("MIDNIGHT", title="", inline="MOPP", group="Opening Price Lines")
ShowNYOPP = input.bool (title="", defval=false, inline="NYOPP", group="Opening Price Lines", tooltip="08:30 AM")
txt17 = input.string ("NEW YORK", title="", inline="NYOPP", group="Opening Price Lines")
ShowEOPP = input.bool (title="", defval=false, inline="EOPP", group="Opening Price Lines", tooltip="09:30 AM")
txt18 = input.string ("EQUITIES", title="", inline="EOPP", group="Opening Price Lines")
ShowAFTPP = input.bool (title="", defval=false, inline="AFTOPP", group="Opening Price Lines", tooltip="01:30 PM")
txt1330 = input.string ("AFTERNOON", title="", inline="AFTOPP", group="Opening Price Lines")
// Opening Price Color
MOPColP = input.color (color.new(#787b86, 0), "", inline="MOPP", group="Opening Price Lines")
NYOPColP = input.color (color.new(#787b86, 0), "", inline="NYOPP", group="Opening Price Lines")
EOPColP = input.color (color.new(#787b86, 0), "", inline="EOPP", group="Opening Price Lines")
AFTOPColP = input.color (color.new(#787b86, 0), "", inline="AFTOPP", group="Opening Price Lines")
// Opening Price LineStyle
MOPLS = input.string ("Dotted", "", options= , inline="MOPP", group="Opening Price Lines")
NYOPLS = input.string ("Dotted", "", options= , inline="NYOPP", group="Opening Price Lines")
EOPLS = input.string ("Dotted", "", options= , inline="EOPP", group="Opening Price Lines")
AFTOPLS = input.string ("Dotted", "", options= , inline="AFTOPP", group="Opening Price Lines")
// Opening Price LineWidth
i_MOPLW = input.string ("1px", "", options= , inline="MOPP", group="Opening Price Lines")
i_NYOPLW = input.string ("1px", "", options= , inline="NYOPP", group="Opening Price Lines")
i_EOPLW = input.string ("1px", "", options= , inline="EOPP", group="Opening Price Lines")
i_AFTOPLW = input.string ("1px", "", options= , inline="AFTOPP", group="Opening Price Lines")
//----------------------------------------------
// W&M Bool
ShowWeekOpen = input.bool (defval=false, title="", tooltip="Draw Weekly Open Price Line", group="HTF Opening Price Lines", inline="WO")
showMonthOpen = input.bool (defval=false, title="", tooltip="Draw Monthly Open Price Line", group="HTF Opening Price Lines", inline="MO")
// W&M String
txt19 = input.string ("WEEKLY", title="", inline="WO", group="HTF Opening Price Lines")
txt20 = input.string ("MONTHLY", title="", inline="MO", group="HTF Opening Price Lines")
// W&M Color
i_WeekOpenCol = input.color (title="", defval=color.new(#787b86, 0), group="HTF Opening Price Lines", inline="WO")
i_MonthOpenCol = input.color (title="", tooltip="", defval=color.new(#787b86, 0), group="HTF Opening Price Lines", inline="MO")
// W&M LineStyle
WOLS = input.string ("Dotted", "", options= , inline="WO", group="HTF Opening Price Lines")
MOLS = input.string ("Dotted", "", options= , inline="MO", group="HTF Opening Price Lines")
// W&M LineWidth
i_WOPLW = input.string ("1px", "", options= , inline="WO", group="HTF Opening Price Lines")
i_MONPLW = input.string ("1px", "", options= , inline="MO", group="HTF Opening Price Lines")
//----------------------------------------------
// CBDR, ASIA & FLOUT
ShowCBDR = input.bool (true, "", inline='CBDR', group="CBDR, ASIA & FLOUT")
ShowASIA = input.bool (true, "", inline='ASIA', group="CBDR, ASIA & FLOUT")
ShowFLOUT = input.bool (false, "", inline='FLOUT', group="CBDR, ASIA & FLOUT")
// Strings
txt0 = input.string ("CBDR", title="", inline="CBDR", group="CBDR, ASIA & FLOUT", tooltip="16:00 to 20:00 SD Increments of 1")
txt1 = input.string ("ASIA", title="", inline="ASIA", group="CBDR, ASIA & FLOUT", tooltip="20:00 to 00:00 SD Increments of 1")
txt7 = input.string ("FLOUT", title="", inline="FLOUT", group="CBDR, ASIA & FLOUT", tooltip="16:00 to 00:00 SD Increments of 0.5")
// Color
CBDRBoxCol = input.color (color.new(#787b86, 0),"", inline='CBDR', group="CBDR, ASIA & FLOUT")
ASIABoxCol = input.color (color.new(#787b86, 0), "", inline='ASIA', group="CBDR, ASIA & FLOUT")
FLOUTBoxCol = input.color (color.new(#787b86, 0),"", inline='FLOUT', group="CBDR, ASIA & FLOUT")
// Extras
box_text_cbdr = input.bool (true, "Show Text", inline="CBDR", group="CBDR, ASIA & FLOUT")
box_text_cbdr_col = input.color (color.new(color.gray, 80), "", inline="CBDR", group="CBDR, ASIA & FLOUT")
bool_cbdr_dev = input.bool (true, "SD", inline="CBDR", group="CBDR, ASIA & FLOUT")
box_text_asia = input.bool (true, "Show Text", inline="ASIA", group="CBDR, ASIA & FLOUT")
box_text_asia_col = input.color (color.new(color.gray, 80), "", inline="ASIA", group="CBDR, ASIA & FLOUT")
bool_asia_dev = input.bool (true, "SD", inline="ASIA", group="CBDR, ASIA & FLOUT")
box_text_flout = input.bool (true, "Show Text", inline="FLOUT", group="CBDR, ASIA & FLOUT")
box_text_flout_col = input.color (color.new(color.gray, 80), "", inline="FLOUT", group="CBDR, ASIA & FLOUT")
bool_flout_dev = input.bool (true, "SD", inline="FLOUT", group="CBDR, ASIA & FLOUT")
// Table
// SD Lines
ShowDevLN = input.bool (title="", defval=true, inline="DEVLN", group="Standard Deviation", tooltip="Deviation Lines")
DEVLNTXT = input.string ("SD LINES", title="", inline="DEVLN", group="Standard Deviation")
DevLNCol = input.color (color.new(#787b86, 0), "", inline="DEVLN", group="Standard Deviation")
DEVLS = input.string ("Solid", "", options= , inline="DEVLN", group="Standard Deviation")
i_DEVLW = input.string ("1px", "", options= , inline="DEVLN", group="Standard Deviation")
DEVLSS = DEVLS=="Solid" ? line.style_solid : DEVLS == "Dotted" ? line.style_dotted : line.style_dashed
DEVLW = i_DEVLW=="1px" ? 1 : i_DEVLW == "2px" ? 2 : i_DEVLW == "3px" ? 3 : i_DEVLW == "4px" ? 4 : 5
ShowDev = input.bool (false, '', inline="DEV", group="Standard Deviation")
txt8 = input.string ("SD COUNT", title="", inline="DEV", group="Standard Deviation")
SDCountCol = input.color (color.new(#787b86, 0), "", inline="DEV", group="Standard Deviation")
DevInput = input.string ("2 SD", "", options= , inline="DEV", group="Standard Deviation")
DevDirection = input.string ("Both", "", options= , inline="DEV", group="Standard Deviation", tooltip="SD Count, NULL, SD Count, SD Direction")
DevCount = DevInput == "1 SD" ? 1 : DevInput == "2 SD" ? 2 : DevInput == "3 SD" ? 3 : 4
Auto_Select = input.bool (false, "", group="Standard Deviation", inline="AUTOSD", tooltip="Auto SD Selection | Charter Content, Range Table Might Bug Out On Mondays" )
txtSD = input.string ("AUTO SD", "", group="Standard Deviation", inline="AUTOSD")
Tab1txtCol = input.color (color.new(#808080, 0), "", inline='AUTOSD', group="Standard Deviation")
TabOptionShow = input.string ("Show Table", "", options= , inline="AUTOSD", group="Standard Deviation")
Stats = TabOptionShow == "Show Table" ? true : false
TabOption1 = input.string ("Top Right", "", options= , inline="AUTOSD", group="Standard Deviation")
tabinp1 = TabOption1 == "Top Left" ? position.top_left : TabOption1 == "Top Center" ? position.top_center : TabOption1 == "Top Right" ? position.top_right : TabOption1 == "Middle Left" ? position.middle_left : TabOption1 == "Middle Right" ? position.middle_right : TabOption1 == "Bottom Left" ? position.bottom_left : TabOption1 == "Bottom Center" ? position.bottom_center : position.bottom_right
L_Prof = true
CellBG = color.new(#131722, 100)
//----------------------------------------------
// Day Of Week & Labels
// Label Settings Inputs
ShowLabel = input.bool (true, title="", inline="Glabel", group="Day Of Week & Labels")
txt21 = input.string ("LABEL", title="", inline="Glabel", group="Day Of Week & Labels")
LabelColor = input.color (color.rgb(0,0,0,100), "", inline="Glabel", group="Day Of Week & Labels")
LabelSizeInput = input.string ("Normal", "", options= , inline="Glabel", group="Day Of Week & Labels")
Terminusinp = input.string ("Terminus @ Current Time +1hr", "", options = , inline="Glabel", group="Day Of Week & Labels", tooltip="Select Label Size & Color & Terminus Historical Price Lines needs to be toggled off for using Terminus")
ShowLabelText = input.bool (true, title="", inline="label", group="Day Of Week & Labels")
txt22 = input.string ("LABEL TEXT", title="", inline="label", group="Day Of Week & Labels")
LabelTextColor = input.color (color.new(#787b86, 0), title="", inline="label", group="Day Of Week & Labels")
LabelTextOptioninput = input.string ("Time", "", options= , inline="label", group="Day Of Week & Labels", tooltip="Choose Between Descriptive Text as Label or Time Show/Hide Prices on Labels")
ShowPricesBool = input.string ("Hide Prices", title="", options= , group="Day Of Week & Labels", inline="label")
ShowPrices = ShowPricesBool == "Show Prices" ? true : false
showDOW = input.bool (true, title="", inline="DOW", group="Day Of Week & Labels")
txt24 = input.string ("DAY OF WEEK", title="", inline="DOW", group="Day Of Week & Labels")
i_DOWCol = input.color (color.new(#787b86, 0), title="", inline="DOW", group="Day Of Week & Labels")
DOWTime = input.int (defval = 12, title="", inline="DOW", group="Day Of Week & Labels")
DOWLoc_inpt = input.string ("Bottom", "", options = , inline="DOW", group="Day Of Week & Labels", tooltip="DOW Color, Time Alignment, Vertical Location")
DOWLoc = DOWLoc_inpt == "Bottom" ? location.bottom : location.top
//----------------------------------------------
BIAS_M_Bool = input.bool (false, "", group="BIAS & NOTES PRECONFIG", inline="stats")
txt100 = input.string ("BIAS", title="", inline="stats", group="BIAS & NOTES PRECONFIG")
TableBG2 = color.new(#131722, 100)
Tab2txtCol = input.color (color.new(#787b86, 0), "", inline='stats', group="BIAS & NOTES PRECONFIG")
TabOption2 = input.string ("Bottom Right", "", options= , inline="stats", group="BIAS & NOTES PRECONFIG")
tabinp2 = TabOption2 == "Top Left" ? position.top_left : TabOption2 == "Top Center" ? position.top_center : TabOption2 == "Top Right" ? position.top_right : TabOption2 == "Middle Left" ? position.middle_left : TabOption2 == "Middle Right" ? position.middle_right : TabOption2 == "Bottom Left" ? position.bottom_left : TabOption2 == "Bottom Center" ? position.bottom_center : position.bottom_right
notesbool = false
NOTES_M_Bool = input.bool (true, "", group="BIAS & NOTES PRECONFIG", inline="stats2")
txt101 = input.string ("NOTES", title="", inline="stats2", group="BIAS & NOTES PRECONFIG")
Tab3txtCol = input.color (color.new(#787b86, 0), "", inline='stats2', group="BIAS & NOTES PRECONFIG")
TabOption3 = input.string ("Top Center", "", options= , inline="stats2", group="BIAS & NOTES PRECONFIG")
tabinp3 = TabOption3 == "Top Left" ? position.top_left : TabOption3 == "Top Center" ? position.top_center : TabOption3 == "Top Right" ? position.top_right : TabOption3 == "Middle Left" ? position.middle_left : TabOption3 == "Middle Right" ? position.middle_right : TabOption3 == "Bottom Left" ? position.bottom_left : TabOption3 == "Bottom Center" ? position.bottom_center : position.bottom_right
BIASbool1 = input.bool (true, '', inline="BIAS1", group="BIAS & NOTES")
txt52 = input.string ("DXY ", title="", inline="BIAS1", group="BIAS & NOTES")
BIASOption1 = input.string ("Unclear", options= , title="", inline="BIAS1", group="BIAS & NOTES")
BIASbool2 = input.bool (true, '', inline="BIAS2", group="BIAS & NOTES")
txt53 = input.string ("SPX ", title="", inline="BIAS2", group="BIAS & NOTES")
BIASOption2 = input.string ("Unclear", options= , title="", inline="BIAS2", group="BIAS & NOTES")
BIASbool3 = input.bool (true, '', inline="BIAS3", group="BIAS & NOTES")
txt54 = input.string ("DOW ", title="", inline="BIAS3", group="BIAS & NOTES")
BIASOption3 = input.string ("Unclear", options= , title="", inline="BIAS3", group="BIAS & NOTES")
BIASbool4 = input.bool (true, '', inline="BIAS4", group="BIAS & NOTES")
txt55 = input.string ("NAS ", title="", inline="BIAS4", group="BIAS & NOTES")
BIASOption4 = input.string ("Unclear", options= , title="", inline="BIAS4", group="BIAS & NOTES")
notes = input.text_area ("@smc_trading_br", "Notes", group = "BIAS & NOTES")
//--------------------END OF INPUTS--------------------//
// Pre-Def
DOM = (timeframe.multiplier <= inputMaxInterval) and (timeframe.isintraday)
newDay = ta.change(dayofweek)
newWeek = ta.change(weekofyear)
newMonth = ta.change(time("M"))
transparentcol = color.rgb(255,255,255,100)
LSVLC = color.rgb(255,255,255,100)
NYSVLC = color.rgb(255,255,255,100)
PMSVLC = color.rgb(255,255,255,100)
ASVLC = color.rgb(255,255,255,100)
LSVLS = "dotted"
NYSVLS = "dotted"
PMSVLS = "dotted"
ASVLS = "dotted"
// Functions
isToday = false
if year(timenow) == year(time) and month(timenow) == month(time) and dayofmonth(timenow) == dayofmonth(time)
isToday := true
// Current Week
thisweek = year(timenow) == year(time) and weekofyear(timenow) == weekofyear(time)
LastOneWeek = year(timenow) == year(time) and weekofyear(timenow-604800000) == weekofyear(time)
LastTwoWeek = year(timenow) == year(time) and weekofyear(timenow-1209600000) == weekofyear(time)
LastThreeWeek = year(timenow) == year(time) and weekofyear(timenow-1814400000) == weekofyear(time)
LastFourWeek = year(timenow) == year(time) and weekofyear(timenow-2419200000) == weekofyear(time)
Last4Weeks = false
if thisweek == true or LastOneWeek == true or LastTwoWeek == true or LastThreeWeek == true or LastFourWeek == true
Last4Weeks := true
// Function to draw Vertical Lines
vline(Start, Color, linestyle, LineWidth) =>
line.new(x1=Start, y1=low - ta.tr, x2=Start, y2=high + ta.tr, xloc=xloc.bar_time, extend=extend.both, color=Color, style=linestyle, width=LineWidth)
// Function to convert forex pips into whole numbers
atr = ta.atr(14)
toWhole(number) =>
if syminfo.type == "forex" // This method only works on forex pairs
_return = atr < 1.0 ? (number / syminfo.mintick) / 10 : number
_return := atr >= 1.0 and atr < 100.0 and syminfo.currency == "JPY" ? _return * 100 : _return
else
number
// Function for determining the Start of a Session (taken from the Pinescript manual: www.tradingview.com )
SessionBegins(sess) =>
t = time("", sess , Timezone)
DOM and (not barstate.isfirst) and na(t ) and not na(t)
// BarIn Session
BarInSession(sess) =>
time(timeframe.period, sess, Timezone) != 0
// Label Type Logic
var SFistrue = true
if LabelTextOptioninput == "Time"
SFistrue := true
else
SFistrue := false
// Session String to int
SeshStartHour(Session) =>
math.round(str.tonumber(str.substring(Session,0,2)))
SeshStartMins(Session) =>
math.round(str.tonumber(str.substring(Session,2,4)))
SeshEndHour(Session) =>
math.round(str.tonumber(str.substring(Session,5,7)))
SeshEndMins(Session) =>
math.round(str.tonumber(str.substring(Session,7,9)))
// Time periods
CBDR = "1600-2000:1234567"
ASIA = "2000-0000:1234567"
FLOUT = "1600-0000:1234567"
midsesh = "0000-1600:1234567"
cbdrOpenTime = timestamp (Timezone, year, month, dayofmonth, SeshStartHour(CBDR), SeshStartMins(CBDR), 00)
cbdrEndTime = timestamp (Timezone, year, month, dayofmonth, SeshEndHour(CBDR), SeshEndMins(CBDR), 00)
asiaOpenTime = timestamp (Timezone, year, month, dayofmonth, SeshStartHour(ASIA), SeshStartMins(ASIA), 00)
asiaEndTime = timestamp (Timezone, year, month, dayofmonth, SeshEndHour(ASIA), SeshEndMins(ASIA), 00)+86400000
floutOpenTime = timestamp (Timezone, year, month, dayofmonth, SeshStartHour(FLOUT), SeshStartMins(FLOUT), 00)
floutEndTime = timestamp (Timezone, year, month, dayofmonth, SeshEndHour(FLOUT), SeshEndMins(FLOUT), 00)+86400000
CBDRTime = time (timeframe.period, CBDR, Timezone)
ASIATime = time (timeframe.period, ASIA, Timezone)
FLOUTTime = time (timeframe.period, FLOUT, Timezone)
LabelOnlyToday = true
// Time Periods
LondonStartTime = timestamp(Timezone, year, month, dayofmonth, SeshStartHour(LDNsesh), SeshStartMins(LDNsesh), 00)
LondonEndTime = timestamp(Timezone, year, month, dayofmonth, SeshEndHour(LDNsesh), SeshEndMins(LDNsesh), 00)
NYStartTime = timestamp(Timezone, year, month, dayofmonth, SeshStartHour(NYsesh), SeshStartMins(NYsesh), 00)
NYEndTime = timestamp(Timezone, year, month, dayofmonth, SeshEndHour(NYsesh), SeshEndMins(NYsesh), 00)
LCStartTime = timestamp(Timezone, year, month, dayofmonth, SeshStartHour(LCsesh), SeshStartMins(LCsesh), 00)
LCEndTime = timestamp(Timezone, year, month, dayofmonth, SeshEndHour(LCsesh), SeshEndMins(LCsesh), 00)
PMStartTime = timestamp(Timezone, year, month, dayofmonth, SeshStartHour(PMsesh), SeshStartMins(PMsesh), 00)
PMEndTime = timestamp(Timezone, year, month, dayofmonth, SeshEndHour(PMsesh), SeshEndMins(PMsesh), 00)
AsianStartTime = timestamp(Timezone, year, month, dayofmonth, SeshStartHour(ASIA2sesh), SeshStartMins(ASIA2sesh), 00)
AsianEndTime = timestamp(Timezone, year, month, dayofmonth, SeshEndHour(ASIA2sesh), SeshEndMins(ASIA2sesh), 00)
FreeStartTime = timestamp(Timezone, year, month, dayofmonth, SeshStartHour(FreeSesh), SeshStartMins(FreeSesh), 00)
FreeEndTime = timestamp(Timezone, year, month, dayofmonth, SeshEndHour(FreeSesh), SeshEndMins(FreeSesh), 00)
MidnightOpenTime = timestamp(Timezone, year, month, dayofmonth, 0, 0, 00)
CLEANUPTIME = timestamp(Timezone, year, month, dayofmonth, 0, 0, 00) - 16200000
LondonOpenTime = timestamp(Timezone, year, month, dayofmonth, 3, 0, 00)
NYOpenTime = timestamp(Timezone, year, month, dayofmonth, 8, 30, 00)
EquitiesOpenTime = timestamp(Timezone, year, month, dayofmonth, 9, 30, 00)
AfternoonOpenTime = timestamp(Timezone, year, month, dayofmonth, 13, 30, 00)
tMidnight = time("1", "0000-0001:1234567", Timezone)
// Cleanup - Remove old drawing objects
Cleanup(days) =>
// Delete old drawing objects
// One day is 86400000 milliseconds
removal_timestamp = (CLEANUPTIME) - (days * 86400000) // Remove every drawing object older than the start of the Today's Midnight
a_allLines = line.all
a_allLabels = label.all
a_allboxes = box.all
// Remove old lines
if array.size(a_allLines) > 0
for i = 0 to array.size(a_allLines) - 1
line_x2 = line.get_x2(array.get(a_allLines, i))
if line_x2 < (removal_timestamp)
line.delete(array.get(a_allLines, i))
// Remove old labels
if array.size(a_allLabels) > 0
for i = 0 to array.size(a_allLabels) - 1
label_x = label.get_x(array.get(a_allLabels, i))
if label_x < removal_timestamp
label.delete(array.get(a_allLabels, i))
// Remove old boxes
if array.size(a_allboxes) > 0
for i = 0 to array.size(a_allboxes) - 1
box_x = box.get_right(array.get(a_allboxes, i))
if box_x < (removal_timestamp - 86400000)
box.delete(array.get(a_allboxes, i))
// End of Cleanup function
// Terminus Function
Terminus(Terminus_Inp)=>
if Terminus_Inp == "Terminus @ Current Time"
_return = timenow
else if Terminus_Inp == "Terminus @ Current Time +15min"
_return = timenow + 900000
else if Terminus_Inp == "Terminus @ Current Time +30min"
_return = timenow + 1800000
else if Terminus_Inp == "Terminus @ Current Time +45min"
_return = timenow + 2700000
else if Terminus_Inp == "Terminus @ Current Time +1hr"
_return = timenow + 3600000
else if Terminus_Inp == "Terminus @ Current Time +2hr"
_return = timenow + 7200000
else
_return = timenow + 10800000
// Linestyle Function
MNOPLS = Midnight_Open_LS=="Solid" ? line.style_solid : Midnight_Open_LS == "Dotted" ? line.style_dotted : line.style_dashed
LNOPLS = london_Open_LS=="Solid" ? line.style_solid : london_Open_LS == "Dotted" ? line.style_dotted : line.style_dashed
NWYOPLS = NY_Open_LS=="Solid" ? line.style_solid : NY_Open_LS == "Dotted" ? line.style_dotted : line.style_dashed
EQOPLS = Equities_Open_LS=="Solid" ? line.style_solid : Equities_Open_LS == "Dotted" ? line.style_dotted : line.style_dashed
MOPLSS = MOPLS=="Solid" ? line.style_solid : MOPLS == "Dotted" ? line.style_dotted : line.style_dashed
NYOPLSS = NYOPLS=="Solid" ? line.style_solid : NYOPLS == "Dotted" ? line.style_dotted : line.style_dashed
EOPLSS = EOPLS=="Solid" ? line.style_solid : EOPLS == "Dotted" ? line.style_dotted : line.style_dashed
AFTOPLSS = AFTOPLS=="Solid" ? line.style_solid : AFTOPLS == "Dotted" ? line.style_dotted : line.style_dashed
WeekOpenLS = WOLS=="Solid" ? line.style_solid : WOLS == "Dotted" ? line.style_dotted : line.style_dashed
MonthOpenLS = MOLS=="Solid" ? line.style_solid : MOLS == "Dotted" ? line.style_dotted : line.style_dashed
// Linewidth Function
MOPLW = Midnight_Open_LW=="1px" ? 1 : Midnight_Open_LW == "2px" ? 2 : Midnight_Open_LW == "3px" ? 3 : Midnight_Open_LW == "4px" ? 4 : 5
LOPLW = London_Open_LW=="1px" ? 1 : London_Open_LW == "2px" ? 2 : London_Open_LW == "3px" ? 3 : London_Open_LW == "4px" ? 4 : 5
NYOPLW = NY_Open_LW=="1px" ? 1 : NY_Open_LW == "2px" ? 2 : NY_Open_LW == "3px" ? 3 : NY_Open_LW == "4px" ? 4 : 5
EOPLW = Equities_Open_LW=="1px" ? 1 : Equities_Open_LW == "2px" ? 2 : Equities_Open_LW == "3px" ? 3 : Equities_Open_LW == "4px" ? 4 : 5
MOPPLW = i_MOPLW=="1px" ? 1 : i_MOPLW == "2px" ? 2 : i_MOPLW == "3px" ? 3 : i_MOPLW == "4px" ? 4 : 5
NYOPPLW = i_NYOPLW=="1px" ? 1 : i_NYOPLW == "2px" ? 2 : i_NYOPLW == "3px" ? 3 : i_NYOPLW == "4px" ? 4 : 5
EOPPLW = i_EOPLW=="1px" ? 1 : i_EOPLW == "2px" ? 2 : i_EOPLW == "3px" ? 3 : i_EOPLW == "4px" ? 4 : 5
AFTOPLW = i_AFTOPLW=="1px" ? 1 : i_AFTOPLW == "2px" ? 2 : i_AFTOPLW == "3px" ? 3 : i_AFTOPLW == "4px" ? 4 : 5
WEEKOPPLW = i_WOPLW=="1px" ? 1 : i_WOPLW == "2px" ? 2 : i_WOPLW == "3px" ? 3 : i_WOPLW == "4px" ? 4 : 5
MONTHOPPLW = i_MONPLW=="1px" ? 1 : i_MONPLW == "2px" ? 2 : i_MONPLW == "3px" ? 3 : i_MONPLW == "4px" ? 4 : 5
// Label Size Function
LabelSize =LabelSizeInput=="Auto" ? size.auto : LabelSizeInput=="Tiny" ? size.tiny : LabelSizeInput=="Small" ? size.small : LabelSizeInput=="Normal" ? size.normal : LabelSizeInput=="Large" ? size.large : size.huge
// Creating Variables
var London_Start_Vline = line.new(x1=na, y1=na, x2=na, xloc=xloc.bar_time, y2=close, color=LSVLC, width=1)
var London_End_Vline = line.new(x1=na, y1=na, x2=na, xloc=xloc.bar_time, y2=close, color=LSVLC, width=1)
var LondonFill = linefill.new(London_Start_Vline, London_End_Vline, LSFC)
var NY_Start_Vline = line.new(x1=na, y1=na, x2=na, xloc=xloc.bar_time, y2=close, color=NYSVLC, width=1)
var NY_End_Vline = line.new(x1=na, y1=na, x2=na, xloc=xloc.bar_time, y2=close, color=NYSVLC, width=1)
var NYFill = linefill.new(NY_Start_Vline, NY_End_Vline, NYSFC)
var LC_Start_Vline = line.new(x1=na, y1=na, x2=na, xloc=xloc.bar_time, y2=close, color=NYSVLC, width=1)
var LC_End_Vline = line.new(x1=na, y1=na, x2=na, xloc=xloc.bar_time, y2=close, color=NYSVLC, width=1)
var LCFill = linefill.new(LC_Start_Vline, LC_End_Vline, LCSFC)
var PM_Start_Vline = line.new(x1=na, y1=na, x2=na, xloc=xloc.bar_time, y2=close, color=PMSVLC, width=1)
var PM_End_Vline = line.new(x1=na, y1=na, x2=na, xloc=xloc.bar_time, y2=close, color=PMSVLC, width=1)
var PMFill = linefill.new(PM_Start_Vline, PM_End_Vline, PMSFC)
var Asian_Start_Vline = line.new(x1=na, y1=na, x2=na, xloc=xloc.bar_time, y2=close, color=ASVLC, width=1)
var Asian_End_Vline = line.new(x1=na, y1=na, x2=na, xloc=xloc.bar_time, y2=close, color=ASVLC, width=1)
var AsianFill = linefill.new(Asian_Start_Vline, Asian_End_Vline, ASFC)
var Free_Start_Vline = line.new(x1=na, y1=na, x2=na, xloc=xloc.bar_time, y2=close, color=ASVLC, width=1)
var Free_End_Vline = line.new(x1=na, y1=na, x2=na, xloc=xloc.bar_time, y2=close, color=ASVLC, width=1)
var FreeFill = linefill.new(Free_Start_Vline, Free_End_Vline, FSFC)
var Midnight_Open = line.new(x1=na, y1=na, x2=na, xloc=xloc.bar_time, y2=close, color=MOPColor, width=1)
var London_Open = line.new(x1=na, y1=na, x2=na, xloc=xloc.bar_time, y2=close, color=LOPColor, width=1)
var NY_Open = line.new(x1=na, y1=na, x2=na, xloc=xloc.bar_time, y2=close, color=NYOPColor, width=1)
var Equities_Open = line.new(x1=na, y1=na, x2=na, xloc=xloc.bar_time, y2=close, color=EOPColor, width=1)
// When a New Day Starts, Start Drawing all lines
if newDay and dayofweek != dayofweek.sunday
// London Session
if (ShowLondon and DOM)
if ShowTSO
line.delete(London_Start_Vline )
line.delete(London_End_Vline )
linefill.delete(LondonFill )
London_Start_Vline := vline(LondonStartTime,transparentcol, line.style_solid, 1)
London_End_Vline := vline(LondonEndTime, transparentcol, line.style_solid, 1)
if ShowSFill
LondonFill := linefill.new(London_Start_Vline, London_End_Vline, LSFC)
// New York Session
if (ShowNY and DOM)
if ShowTSO
line.delete(NY_Start_Vline )
line.delete(NY_End_Vline )
linefill.delete(NYFill )
NY_Start_Vline := vline(NYStartTime, transparentcol, line.style_solid, 1)
NY_End_Vline := vline(NYEndTime, transparentcol, line.style_solid, 1)
if ShowSFill
NYFill := linefill.new(NY_Start_Vline, NY_End_Vline, NYSFC)
// London Close
if (ShowLC and DOM)
if ShowTSO
line.delete(LC_End_Vline )
linefill.delete(LCFill )
LC_Start_Vline := vline(LCStartTime, transparentcol, line.style_solid, 1)
LC_End_Vline := vline(LCEndTime, transparentcol, line.style_solid, 1)
if ShowSFill
LCFill := linefill.new(LC_Start_Vline, LC_End_Vline, LCSFC)
// PM Session
if (ShowPM and DOM)
if ShowTSO
line.delete(PM_Start_Vline )
line.delete(PM_End_Vline )
linefill.delete(PMFill )
PM_Start_Vline := vline(PMStartTime, transparentcol, line.style_solid, 1)
PM_End_Vline := vline(PMEndTime, transparentcol, line.style_solid, 1)
if ShowSFill
PMFill := linefill.new(PM_Start_Vline, PM_End_Vline, PMSFC)
// Asian Session
if (ShowAsian and DOM)
if ShowTSO
line.delete(Asian_Start_Vline )
line.delete(Asian_End_Vline )
linefill.delete(AsianFill )
Asian_Start_Vline := vline(AsianStartTime, transparentcol, line.style_solid, 1)
Asian_End_Vline := vline(AsianEndTime, transparentcol, line.style_solid, 1)
// if dayofweek == dayofweek.friday
// // line.delete(Asian_Start_Vline)
// // line.delete(Asian_End_Vline)
// Asian_Start_Vline := vline(MidnightOpenTime+244800000, transparentcol, line.style_solid, 1)
// Asian_End_Vline := vline(MidnightOpenTime+259200000, transparentcol, line.style_solid, 1)
if ShowSFill
AsianFill := linefill.new(Asian_Start_Vline, Asian_End_Vline, ASFC)
// Free Session
if (ShowFreeSesh and DOM)
if ShowTSO
line.delete(Free_Start_Vline )
line.delete(Free_End_Vline )
linefill.delete(FreeFill )
Free_Start_Vline := vline(FreeStartTime, transparentcol, line.style_solid, 1)
Free_End_Vline := vline(FreeEndTime, transparentcol, line.style_solid, 1)
if ShowSFill
FreeFill := linefill.new(Free_Start_Vline, Free_End_Vline, FSFC)
// Midnight Opening Price
if (ShowMOP and DOM)
if MOLHist == false
line.delete(Midnight_Open )
Midnight_Open := vline(MidnightOpenTime, MOPColor, MNOPLS, MOPLW)
// London Opening Price
if (ShowLOP and DOM)
if ShowTSO
line.delete(London_Open )
London_Open := vline(LondonOpenTime, LOPColor, LNOPLS, LOPLW)
// New York Opening Price
if (ShowNYOP and DOM)
if ShowTSO
line.delete(NY_Open )
NY_Open := vline(NYOpenTime, NYOPColor, NWYOPLS, NYOPLW)
// Equities Opening Price
if (ShowEOP and DOM)
if ShowTSO
line.delete(Equities_Open )
Equities_Open := vline(EquitiesOpenTime, EOPColor, EQOPLS, EOPLW)
// Variables
var label MOPLB = na
var line MOPLN = na
var label NYOPLB = na
var line NYOPLN = na
var label EOPLB = na
var line EOPLN = na
var line AFTLN = na
var label AFTLB = na
// New York Midnight Open Price line
var openMidnight = 0.0
if tMidnight
if not tMidnight
openMidnight := open
else
openMidnight := math.max(open, openMidnight)
if (ShowMOPP and (openMidnight != openMidnight ) and DOM and barstate.isconfirmed)
label.delete(MOPLB )
if ShowMOPL == false
line.delete(MOPLN )
MOPLN := line.new(x1=tMidnight, y1=openMidnight, x2=tMidnight+86400000, xloc=xloc.bar_time, y2=openMidnight, color=MOPColP, style=MOPLSS, width=MOPPLW)
if dayofweek == dayofweek.friday and syminfo.type != "crypto"
line.set_x2(MOPLN, tMidnight+259200000)
if ShowLabel
MOPLB := label.new(x=tMidnight+86400000, y=openMidnight, xloc=xloc.bar_time, color=LabelColor, textcolor=MOPColP, style=label.style_label_left, size=LabelSize, tooltip="Midnight Opening Price")
if dayofweek == dayofweek.friday and syminfo.type != "crypto"
label.set_x(MOPLB, tMidnight+259200000)
if ShowLabelText
if SFistrue
if ShowPrices == true
label.set_text(MOPLB, " 00:00 | " + str.tostring(open))
else
label.set_text(MOPLB, " 00:00 ")
label.set_tooltip(MOPLB, "Midnight Opening Price")
else
if ShowPrices == true
label.set_text(MOPLB, " Midnight Opening Price | " + str.tostring(open))
else
label.set_text(MOPLB, " Midnight Opening Price ")
label.set_tooltip(MOPLB, "")
label.set_textcolor(MOPLB, LabelTextColor)
label.set_size(MOPLB,LabelSize)
if time > PMEndTime and time < (MidnightOpenTime + 86400000)
line.delete(MOPLN )
if Terminusinp != "Terminus @ Next Midnight" and ShowMOPL == false
line.set_x2(MOPLN, Terminus(Terminusinp))
label.set_x(MOPLB, Terminus(Terminusinp))
// New York Opening Price Line
if (ShowNYOPP and (time == NYOpenTime) and DOM)
label.delete(NYOPLB )
if ShowPrev == false
line.delete(NYOPLN )
NYOPLN := line.new(x1=NYOpenTime, y1=open, x2=NYOpenTime+55800000, xloc=xloc.bar_time, y2=open, color=NYOPColP, style=NYOPLSS, width=NYOPPLW)
if dayofweek == dayofweek.friday and syminfo.type != "crypto"
line.set_x2(NYOPLN, NYOpenTime+228600000)
if ShowLabel
NYOPLB := label.new(x=NYOpenTime+55800000, y=open, xloc=xloc.bar_time, color=LabelColor, textcolor=NYOPColP, style=label.style_label_left, size=LabelSize, tooltip="New York Opening Price")
if dayofweek == dayofweek.friday and syminfo.type != "crypto"
label.set_x(NYOPLB, NYOpenTime+228600000)
if ShowLabelText
if SFistrue
if ShowPrices == true
label.set_text(NYOPLB, " 08:30 | " + str.tostring(open))
else
label.set_text(NYOPLB, " 08:30 ")
label.set_tooltip(NYOPLB, "New York Opening Price")
else
if ShowPrices == true
label.set_text(NYOPLB, " New York Opening Price | " + str.tostring(open))
else
label.set_text(NYOPLB, " New York Opening Price ")
label.set_tooltip(NYOPLB, "")
label.set_textcolor(NYOPLB, LabelTextColor)
label.set_size(NYOPLB,LabelSize)
if Terminusinp != "Terminus @ Next Midnight" and ShowPrev == false
line.set_x2(NYOPLN, Terminus(Terminusinp))
label.set_x(NYOPLB, Terminus(Terminusinp))
// Equities Opening Price Line
if (ShowEOPP and (time == EquitiesOpenTime) and DOM)
label.delete(EOPLB )
if ShowPrev == false
line.delete(EOPLN )
EOPLN := line.new(x1=EquitiesOpenTime, y1=open, x2=EquitiesOpenTime+52200000, xloc=xloc.bar_time, y2=open, color=EOPColP, style=EOPLSS, width=EOPPLW)
if dayofweek == dayofweek.friday and syminfo.type != "crypto"
line.set_x2(EOPLN, EquitiesOpenTime+225000000)
if ShowLabel
EOPLB := label.new(x=EquitiesOpenTime+52200000, y=open, xloc=xloc.bar_time, color=LabelColor, textcolor=EOPColP, style=label.style_label_left, size=LabelSize, tooltip="Equities Opening Price")
if dayofweek == dayofweek.friday and syminfo.type != "crypto"
label.set_x(EOPLB, EquitiesOpenTime+225000000)
if ShowLabelText
if SFistrue
if ShowPrices == true
label.set_text(EOPLB, " 09:30 | " + str.tostring(open))
else
label.set_text(EOPLB, " 09:30 ")
label.set_tooltip(EOPLB, "Equities Opening Price")
else
if ShowPrices == true
label.set_text(EOPLB, " Equities Opening Price | " + str.tostring(open))
else
label.set_text(EOPLB, " Equities Opening Price ")
label.set_tooltip(EOPLB, "")
label.set_textcolor(EOPLB, LabelTextColor)
label.set_size(EOPLB,LabelSize)
if Terminusinp != "Terminus @ Next Midnight" and ShowPrev == false
line.set_x2(EOPLN, Terminus(Terminusinp))
label.set_x(EOPLB, Terminus(Terminusinp))
// Afternoon Opening Price Line
if (ShowAFTPP and (time == AfternoonOpenTime) and DOM)
label.delete(AFTLB )
if ShowPrev == false
line.delete(AFTLN )
AFTLN := line.new(x1=AfternoonOpenTime, y1=open, x2=EquitiesOpenTime+52200000, xloc=xloc.bar_time, y2=open, color=AFTOPColP, style=AFTOPLSS, width=AFTOPLW)
if dayofweek == dayofweek.friday and syminfo.type != "crypto"
line.set_x2(AFTLN, EquitiesOpenTime+225000000)
if ShowLabel
AFTLB := label.new(x=EquitiesOpenTime+52200000, y=open, xloc=xloc.bar_time, color=LabelColor, textcolor=AFTOPColP, style=label.style_label_left, size=LabelSize, tooltip="Equities Opening Price")
if dayofweek == dayofweek.friday and syminfo.type != "crypto"
label.set_x(AFTLB, EquitiesOpenTime+225000000)
if ShowLabelText
if SFistrue
if ShowPrices == true
label.set_text(AFTLB, " 01:30 | " + str.tostring(open))
else
label.set_text(AFTLB, " 01:30 ")
label.set_tooltip(AFTLB, " Afternoon Opening Price")
else
if ShowPrices == true
label.set_text(AFTLB, " Afternoon Opening Price | " + str.tostring(open))
else
label.set_text(AFTLB, " Afternoon Opening Price ")
label.set_tooltip(AFTLB, "")
label.set_textcolor(AFTLB, LabelTextColor)
label.set_size(AFTLB,LabelSize)
if Terminusinp != "Terminus @ Next Midnight" and ShowPrev == false
line.set_x2(AFTLN, Terminus(Terminusinp))
label.set_x(AFTLB, Terminus(Terminusinp))
// HTF Variables
var Weekly_open = line.new(x1=na, y1=na, x2=na, xloc=xloc.bar_time, y2=close, color=i_WeekOpenCol, style=WeekOpenLS, width=1)
var Weekly_openlbl = label.new(x=na, y=na, xloc=xloc.bar_time, color=LabelColor, textcolor=LabelTextColor, style=label.style_label_left, size=LabelSize)
var WeeklyOpenTime = time
var Monthly_open = line.new(x1=na, y1=na, x2=na, xloc=xloc.bar_time, y2=close, color=i_MonthOpenCol, style=MonthOpenLS, width=1)
var Monthly_openlbl = label.new(x=na, y=na, xloc=xloc.bar_time, color=LabelColor, textcolor=LabelTextColor, style=label.style_label_left, size=LabelSize)
var MonthlyOpenTime = time
// Get HTF Price levels
WeeklyOpen = request.security(syminfo.tickerid, "W", open, lookahead = barmerge.lookahead_on)
MonthlyOpen = request.security(syminfo.tickerid, "M", open, lookahead = barmerge.lookahead_on)
// Weekly Open
if newWeek
WeeklyOpenTime := time
if ShowWeekOpen and newDay and Last4Weeks
label.delete(Weekly_openlbl )
line.delete(Weekly_open )
// if ShowPrev == false
// line.delete(Weekly_open )
Weekly_open:= line.new(x1=WeeklyOpenTime-25200000, y1=WeeklyOpen, x2=EquitiesOpenTime+52200000, xloc=xloc.bar_time, y2=WeeklyOpen, color=i_WeekOpenCol, style=WeekOpenLS, width=WEEKOPPLW)
if dayofweek == dayofweek.friday and syminfo.type != "crypto"
line.set_x2(Weekly_open, EquitiesOpenTime+225000000)
if ShowLabel
Weekly_openlbl := label.new(x=EquitiesOpenTime+52200000, y=WeeklyOpen, xloc=xloc.bar_time, color=LabelColor, textcolor=LabelTextColor, style=label.style_label_left, size=LabelSize, tooltip="Weekly Open: " + str.tostring(WeeklyOpen))
if dayofweek == dayofweek.friday and syminfo.type != "crypto"
label.set_x(Weekly_openlbl, EquitiesOpenTime+225000000)
if ShowLabelText
if SFistrue
if ShowPrices == true
label.set_text(Weekly_openlbl," W.O. | " + str.tostring(WeeklyOpen))
else
label.set_text(Weekly_openlbl," W.O. ")
label.set_tooltip(Weekly_openlbl, " Weekly Opening Price ")
else
if ShowPrices == true
label.set_text(Weekly_openlbl," Weekly Open | " + str.tostring(WeeklyOpen))
else
label.set_text(Weekly_openlbl," Weekly Open ")
label.set_tooltip(Weekly_openlbl, "")
label.set_textcolor(Weekly_openlbl, LabelTextColor)
label.set_size(Weekly_openlbl, LabelSize)
if timeframe.multiplier > 60
line.set_x2(Weekly_open, AsianEndTime + 232000000)
label.set_x(Weekly_openlbl, AsianEndTime + 232000000)
if timeframe.period == "D"
line.set_x2(Weekly_open, AsianEndTime + 832000000)
label.set_x(Weekly_openlbl, AsianEndTime + 832000000)
if timeframe.period == "M"
line.delete(Weekly_open)
label.delete(Weekly_openlbl)
if Terminusinp != "Terminus @ Next Midnight" and DOM
line.set_x2(Weekly_open, Terminus(Terminusinp))
label.set_x(Weekly_openlbl, Terminus(Terminusinp))
// Monthly Open
if newMonth
MonthlyOpenTime := time
if showMonthOpen and newDay
line.delete(Monthly_open )
label.delete(Monthly_openlbl )
Monthly_open:= line.new(x1=MonthlyOpenTime, y1=MonthlyOpen, x2=AsianEndTime, xloc=xloc.bar_time, y2=MonthlyOpen, color=i_MonthOpenCol, style=MonthOpenLS, width=MONTHOPPLW)
if dayofweek == dayofweek.friday and syminfo.type != "crypto"
line.set_x2(Monthly_open, EquitiesOpenTime+225000000)
if ShowLabel
Monthly_openlbl := label.new(x=AsianEndTime, y=MonthlyOpen, xloc=xloc.bar_time, color=LabelColor, textcolor=LabelTextColor, style=label.style_label_left, size=LabelSize, tooltip="Monthly Open: " + str.tostring(MonthlyOpen))
if dayofweek == dayofweek.friday and syminfo.type != "crypto"
label.set_x(Monthly_openlbl, EquitiesOpenTime+225000000)
if ShowLabelText
if SFistrue
if ShowPrices == true
label.set_text(Monthly_openlbl," M.O. | " + str.tostring(MonthlyOpen))
else
label.set_text(Monthly_openlbl," M.O. ")
label.set_tooltip(Monthly_openlbl, " Monthly Opening Price ")
else
if ShowPrices == true
label.set_text(Monthly_openlbl, " Monthly Open | " + str.tostring(MonthlyOpen))
else
label.set_text(Monthly_openlbl, " Monthly Open ")
label.set_tooltip(Monthly_openlbl, "")
label.set_textcolor(Monthly_openlbl, LabelTextColor)
label.set_size(Monthly_openlbl, LabelSize)
if timeframe.multiplier > 60
line.set_x2(Monthly_open, AsianEndTime + 232000000)
label.set_x(Monthly_openlbl, AsianEndTime + 232000000)
if timeframe.period == "D"
line.set_x2(Monthly_open, AsianEndTime + 832000000)
label.set_x(Monthly_openlbl, AsianEndTime + 832000000)
if timeframe.period == "W"
line.set_x2(Monthly_open, AsianEndTime + 2592000000)
label.set_x(Monthly_openlbl, AsianEndTime + 2592000000)
if timeframe.period == "M"
line.delete(Monthly_open)
label.delete(Monthly_openlbl)
if Terminusinp != "Terminus @ Next Midnight" and DOM
line.set_x2(Monthly_open, Terminus(Terminusinp))
label.set_x(Monthly_openlbl, Terminus(Terminusinp))
// CBDR Stuff
var float cbdr_hi = na
var float cbdr_lo = na
var float cbdr_diff = na
var box cbdrbox = na
var line cbdr_hi_line = na
var line cbdr_lo_line = na
var line dev01negline = na
var line dev02negline = na
var line dev03negline = na
var line dev04negline = na
var line dev01posline = na
var line dev02posline = na
var line dev03posline = na
var line dev04posline = na
if SessionBegins(CBDR) and DOM
cbdr_hi := high
cbdr_lo := low
cbdr_diff := cbdr_hi - cbdr_lo
if ShowTSO
box.delete(cbdrbox )
line.delete(dev01posline )
line.delete(dev01negline )
line.delete(dev02posline )
line.delete(dev02negline )
line.delete(dev03posline )
line.delete(dev03negline )
line.delete(dev04posline )
line.delete(dev04negline )
if ShowCBDR
cbdrbox := box.new(cbdrOpenTime, cbdr_hi, cbdrEndTime, cbdr_lo, color.new(CBDRBoxCol,90), 1, line.style_solid, extend.none, xloc.bar_time, color.new(CBDRBoxCol,90), txt0, size.auto, color.new(box_text_cbdr_col,80), text_wrap=text.wrap_auto)
if dayofweek == dayofweek.friday
box.set_right(cbdrbox, cbdrOpenTime+187200000)
line.set_x2(cbdr_hi_line, cbdrOpenTime+187200000)
line.set_x2(cbdr_lo_line, cbdrOpenTime+187200000)
if box_text_cbdr == false
box.set_text(cbdrbox, "")
if ShowDev and ShowCBDR and bool_cbdr_dev
for i = 1 to DevCount by 1
if i == 1
dev01posline := line.new(cbdrOpenTime, cbdr_hi + cbdr_diff * i, cbdrEndTime, cbdr_hi + cbdr_diff * i, xloc=xloc.bar_time, color=DevLNCol, style=DEVLSS, width=DEVLW)
dev01negline := line.new(cbdrOpenTime, cbdr_hi - cbdr_diff * i, cbdrEndTime, cbdr_lo - cbdr_diff * i, xloc=xloc.bar_time, color=DevLNCol, style=DEVLSS, width=DEVLW)
if dayofweek == dayofweek.friday
line.set_x2(dev01posline, cbdrOpenTime+187200000)
line.set_x2(dev01negline, cbdrOpenTime+187200000)
if i == 2
dev02posline := line.new(cbdrOpenTime, cbdr_hi + cbdr_diff * i, cbdrEndTime, cbdr_lo + cbdr_diff * i, xloc=xloc.bar_time, color=DevLNCol, style=DEVLSS, width=DEVLW)
dev02negline := line.new(cbdrOpenTime, cbdr_hi - cbdr_diff * i, cbdrEndTime, cbdr_lo - cbdr_diff * i, xloc=xloc.bar_time, color=DevLNCol, style=DEVLSS, width=DEVLW)
if dayofweek == dayofweek.friday
line.set_x2(dev02posline, cbdrOpenTime+187200000)
line.set_x2(dev02negline, cbdrOpenTime+187200000)
if i == 3
dev03posline := line.new(cbdrOpenTime, cbdr_hi + cbdr_diff * i, cbdrEndTime, cbdr_lo + cbdr_diff * i, xloc=xloc.bar_time, color=DevLNCol, style=DEVLSS, width=DEVLW)
dev03negline := line.new(cbdrOpenTime, cbdr_hi - cbdr_diff * i, cbdrEndTime, cbdr_lo - cbdr_diff * i, xloc=xloc.bar_time, color=DevLNCol, style=DEVLSS, width=DEVLW)
if dayofweek == dayofweek.friday
line.set_x2(dev03posline, cbdrOpenTime+187200000)
line.set_x2(dev03negline, cbdrOpenTime+187200000)
if i == 4
dev04posline := line.new(cbdrOpenTime, cbdr_hi + cbdr_diff * i, cbdrEndTime, cbdr_lo + cbdr_diff * i, xloc=xloc.bar_time, color=DevLNCol, style=DEVLSS, width=DEVLW)
dev04negline := line.new(cbdrOpenTime, cbdr_hi - cbdr_diff * i, cbdrEndTime, cbdr_lo - cbdr_diff * i, xloc=xloc.bar_time, color=DevLNCol, style=DEVLSS, width=DEVLW)
if dayofweek == dayofweek.friday
line.set_x2(dev04posline, cbdrOpenTime+187200000)
line.set_x2(dev04negline, cbdrOpenTime+187200000)
else if CBDRTime
cbdr_hi := math.max(high, cbdr_hi)
cbdr_lo := math.min(low, cbdr_lo)
cbdr_diff := cbdr_hi - cbdr_lo
for i = 1 to DevCount by 1
if i == 1 and ShowDev
line.set_y1(dev01posline, cbdr_hi + cbdr_diff * i)
line.set_y2(dev01posline, cbdr_hi + cbdr_diff * i)
line.set_y1(dev01negline, cbdr_lo - cbdr_diff * i)
line.set_y2(dev01negline, cbdr_lo - cbdr_diff * i)
if i == 2 and ShowDev
line.set_y1(dev02posline, cbdr_hi + cbdr_diff * i)
line.set_y2(dev02posline, cbdr_hi + cbdr_diff * i)
line.set_y1(dev02negline, cbdr_lo - cbdr_diff * i)
line.set_y2(dev02negline, cbdr_lo - cbdr_diff * i)
if i == 3 and ShowDev
line.set_y1(dev03posline, cbdr_hi + cbdr_diff * i)
line.set_y2(dev03posline, cbdr_hi + cbdr_diff * i)
line.set_y1(dev03negline, cbdr_lo - cbdr_diff * i)
line.set_y2(dev03negline, cbdr_lo - cbdr_diff * i)
if i == 4 and ShowDev
line.set_y1(dev04posline, cbdr_hi + cbdr_diff * i)
line.set_y2(dev04posline, cbdr_hi + cbdr_diff * i)
line.set_y1(dev04negline, cbdr_lo - cbdr_diff * i)
line.set_y2(dev04negline, cbdr_lo - cbdr_diff * i)
if (cbdr_hi > cbdr_hi )
if ShowCBDR
box.set_top(cbdrbox, cbdr_hi)
if (cbdr_lo < cbdr_lo )
if ShowCBDR
box.set_bottom(cbdrbox, cbdr_lo)
if DevDirection == "Upside Only"
line.delete(dev01negline)
line.delete(dev02negline)
line.delete(dev03negline)
line.delete(dev04negline)
else if DevDirection == "Downside Only"
line.delete(dev01posline)
line.delete(dev02posline)
line.delete(dev03posline)
line.delete(dev04posline)
// ASIA Stuff
var float asia_hi = na
var float asia_lo = na
var float asia_diff = na
var box asia_box = na
var line asia_hi_line = na
var line asia_lo_line = na
var line dev01negline_asia = na
var line dev02negline_asia = na
var line dev03negline_asia = na
var line dev04negline_asia = na
var line dev01posline_asia = na
var line dev02posline_asia = na
var line dev03posline_asia = na
var line dev04posline_asia = na
if SessionBegins(ASIA) and DOM
asia_hi := high
asia_lo := low
asia_diff := asia_hi - asia_lo
if ShowTSO
box.delete(asia_box )
line.delete(dev01posline_asia )
line.delete(dev01negline_asia )
line.delete(dev02posline_asia )
line.delete(dev02negline_asia )
line.delete(dev03posline_asia )
line.delete(dev03negline_asia )
line.delete(dev04posline_asia )
line.delete(dev04negline_asia )
if ShowASIA
asia_box := box.new(asiaOpenTime, asia_hi, asiaEndTime, asia_lo, color.new(ASIABoxCol,90), 1, line.style_solid, extend.none, xloc.bar_time, color.new(ASIABoxCol,90), txt1, size.auto, color.new(box_text_asia_col,80), text_wrap=text.wrap_auto)
if box_text_asia == false
box.set_text(asia_box, "")
if ShowDev and ShowASIA and bool_asia_dev
for i = 1 to DevCount by 1
if i == 1
dev01posline_asia := line.new(asiaOpenTime, asia_hi + asia_diff * i, asiaEndTime, asia_hi + asia_diff * i, xloc=xloc.bar_time, color=DevLNCol, style=DEVLSS, width=DEVLW)
dev01negline_asia := line.new(asiaOpenTime, asia_hi - asia_diff * i, asiaEndTime, asia_lo - asia_diff * i, xloc=xloc.bar_time, color=DevLNCol, style=DEVLSS, width=DEVLW)
if i == 2
dev02posline_asia := line.new(asiaOpenTime, asia_hi + asia_diff * i, asiaEndTime, asia_lo + asia_diff * i, xloc=xloc.bar_time, color=DevLNCol, style=DEVLSS, width=DEVLW)
dev02negline_asia := line.new(asiaOpenTime, asia_hi - asia_diff * i, asiaEndTime, asia_lo - asia_diff * i, xloc=xloc.bar_time, color=DevLNCol, style=DEVLSS, width=DEVLW)
if i == 3
dev03posline_asia := line.new(asiaOpenTime, asia_hi + asia_diff * i, asiaEndTime, asia_lo + asia_diff * i, xloc=xloc.bar_time, color=DevLNCol, style=DEVLSS, width=DEVLW)
dev03negline_asia := line.new(asiaOpenTime, asia_hi - asia_diff * i, asiaEndTime, asia_lo - asia_diff * i, xloc=xloc.bar_time, color=DevLNCol, style=DEVLSS, width=DEVLW)
if i == 4
dev04posline_asia := line.new(asiaOpenTime, asia_hi + asia_diff * i, asiaEndTime, asia_lo + asia_diff * i, xloc=xloc.bar_time, color=DevLNCol, style=DEVLSS, width=DEVLW)
dev04negline_asia := line.new(asiaOpenTime, asia_hi - asia_diff * i, asiaEndTime, asia_lo - asia_diff * i, xloc=xloc.bar_time, color=DevLNCol, style=DEVLSS, width=DEVLW)
else if ASIATime
asia_hi := math.max(high, asia_hi)
asia_lo := math.min(low, asia_lo)
asia_diff := asia_hi - asia_lo
for i = 1 to DevCount by 1
if i == 1 and ShowDev
line.set_y1(dev01posline_asia, asia_hi + asia_diff * i)
line.set_y2(dev01posline_asia, asia_hi + asia_diff * i)
line.set_y1(dev01negline_asia, asia_lo - asia_diff * i)
line.set_y2(dev01negline_asia, asia_lo - asia_diff * i)
if i == 2 and ShowDev
line.set_y1(dev02posline_asia, asia_hi + asia_diff * i)
line.set_y2(dev02posline_asia, asia_hi + asia_diff * i)
line.set_y1(dev02negline_asia, asia_lo - asia_diff * i)
line.set_y2(dev02negline_asia, asia_lo - asia_diff * i)
if i == 3 and ShowDev
line.set_y1(dev03posline_asia, asia_hi + asia_diff * i)
line.set_y2(dev03posline_asia, asia_hi + asia_diff * i)
line.set_y1(dev03negline_asia, asia_lo - asia_diff * i)
line.set_y2(dev03negline_asia, asia_lo - asia_diff * i)
if i == 4 and ShowDev
line.set_y1(dev04posline_asia, asia_hi + asia_diff * i)
line.set_y2(dev04posline_asia, asia_hi + asia_diff * i)
line.set_y1(dev04negline_asia, asia_lo - asia_diff * i)
line.set_y2(dev04negline_asia, asia_lo - asia_diff * i)
if (asia_hi > asia_hi )
box.set_top(asia_box, asia_hi)
if (asia_lo < asia_lo )
box.set_bottom(asia_box, asia_lo)
if DevDirection == "Upside Only"
line.delete(dev01negline_asia)
line.delete(dev02negline_asia)
line.delete(dev03negline_asia)
line.delete(dev04negline_asia)
else if DevDirection == "Downside Only"
line.delete(dev01posline_asia)
line.delete(dev02posline_asia)
line.delete(dev03posline_asia)
line.delete(dev04posline_asia)
// FLOUT Stuff
var float flout_hi = na
var float flout_lo = na
var float flout_diff = na
var box floutbox = na
var line flout_hi_line = na
var line flout_lo_line = na
var line dev01negline_flout = na
var line dev02negline_flout = na
var line dev03negline_flout = na
var line dev04negline_flout = na
var line dev01posline_flout = na
var line dev02posline_flout = na
var line dev03posline_flout = na
var line dev04posline_flout = na
if SessionBegins(FLOUT) and DOM
flout_hi := high
flout_lo := low
flout_diff := flout_hi - flout_lo
if ShowTSO
box.delete(floutbox )
line.delete(dev01posline_flout )
line.delete(dev01negline_flout )
line.delete(dev02posline_flout )
line.delete(dev02negline_flout )
line.delete(dev03posline_flout )
line.delete(dev03negline_flout )
line.delete(dev04posline_flout )
line.delete(dev04negline_flout )
if ShowFLOUT
floutbox := box.new(floutOpenTime, flout_hi, floutEndTime, flout_lo, color.new(FLOUTBoxCol,90), 1, line.style_solid, extend.none, xloc.bar_time, color.new(FLOUTBoxCol,90), txt7, size.auto, color.new(box_text_flout_col,80), text_wrap=text.wrap_auto)
if dayofweek == dayofweek.friday
box.set_right(floutbox, floutOpenTime+201600000)
line.set_x2(flout_hi_line, floutOpenTime+201600000)
line.set_x2(flout_lo_line, floutOpenTime+201600000)
if box_text_cbdr == false
box.set_text(floutbox, "")
if ShowDev and ShowFLOUT and bool_flout_dev
for i = 0.5 to DevCount by 0.5
if i == 0.5
dev01posline_flout := line.new(floutOpenTime, flout_hi + flout_diff * i, floutEndTime, flout_hi + flout_diff * i, xloc=xloc.bar_time, color=DevLNCol, style=DEVLSS, width=DEVLW)
dev01negline_flout := line.new(floutOpenTime, flout_hi - flout_diff * i, floutEndTime, flout_lo - flout_diff * i, xloc=xloc.bar_time, color=DevLNCol, style=DEVLSS, width=DEVLW)
if dayofweek == dayofweek.friday
line.set_x2(dev01posline_flout, floutOpenTime+201600000)
line.set_x2(dev01negline_flout, floutOpenTime+201600000)
if i == 1
dev02posline_flout := line.new(floutOpenTime, flout_hi + flout_diff * i, floutEndTime, flout_lo + flout_diff * i, xloc=xloc.bar_time, color=DevLNCol, style=DEVLSS, width=DEVLW)
dev02negline_flout := line.new(floutOpenTime, flout_hi - flout_diff * i, floutEndTime, flout_lo - flout_diff * i, xloc=xloc.bar_time, color=DevLNCol, style=DEVLSS, width=DEVLW)
if dayofweek == dayofweek.friday
line.set_x2(dev02posline_flout, floutOpenTime+201600000)
line.set_x2(dev02negline_flout, floutOpenTime+201600000)
if i == 1.5
dev03posline_flout := line.new(floutOpenTime, flout_hi + flout_diff * i, floutEndTime, flout_lo + flout_diff * i, xloc=xloc.bar_time, color=DevLNCol, style=DEVLSS, width=DEVLW)
dev03negline_flout := line.new(floutOpenTime, flout_hi - flout_diff * i, floutEndTime, flout_lo - flout_diff * i, xloc=xloc.bar_time, color=DevLNCol, style=DEVLSS, width=DEVLW)
if dayofweek == dayofweek.friday
line.set_x2(dev03posline_flout, floutOpenTime+201600000)
line.set_x2(dev03negline_flout, floutOpenTime+201600000)
if i == 2
dev04posline_flout := line.new(floutOpenTime, flout_hi + flout_diff * i, floutEndTime, flout_lo + flout_diff * i, xloc=xloc.bar_time, color=DevLNCol, style=DEVLSS, width=DEVLW)
dev04negline_flout := line.new(floutOpenTime, flout_hi - flout_diff * i, floutEndTime, flout_lo - flout_diff * i, xloc=xloc.bar_time, color=DevLNCol, style=DEVLSS, width=DEVLW)
if dayofweek == dayofweek.friday
line.set_x2(dev04posline_flout, floutOpenTime+201600000)
line.set_x2(dev04negline_flout, floutOpenTime+201600000)
else if FLOUTTime
flout_hi := math.max(high, flout_hi)
flout_lo := math.min(low, flout_lo)
flout_diff := flout_hi - flout_lo
for i = 0.5 to DevCount by 0.5
if i == 0.5 and ShowDev
line.set_y1(dev01posline_flout, flout_hi + flout_diff * i)
line.set_y2(dev01posline_flout, flout_hi + flout_diff * i)
line.set_y1(dev01negline_flout, flout_lo - flout_diff * i)
line.set_y2(dev01negline_flout, flout_lo - flout_diff * i)
if i == 1 and ShowDev
line.set_y1(dev02posline_flout, flout_hi + flout_diff * i)
line.set_y

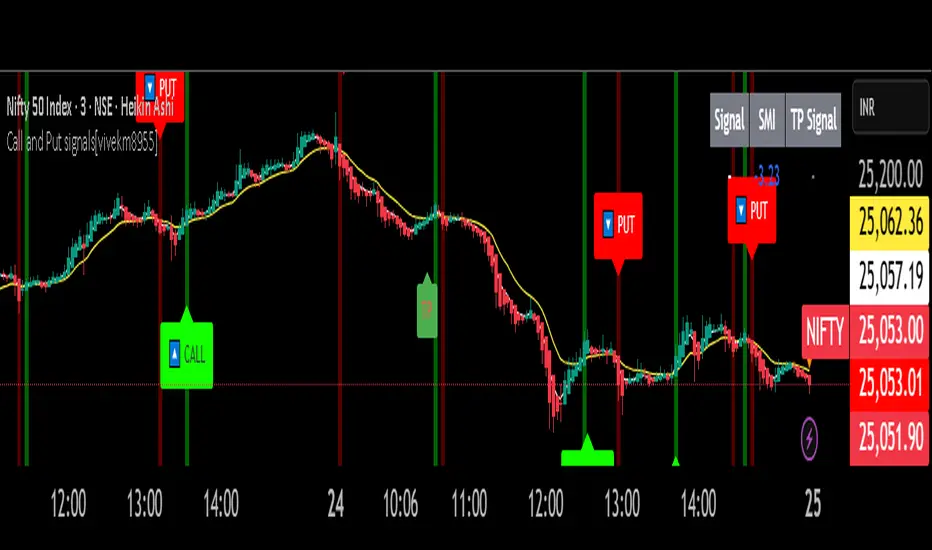
Call and Put signals[vivekm8955]🔍 Strategy Overview
This adaptive strategy generates clear CALL (Buy) and PUT (Sell) signals by combining:
✅ Dual EMA structure
✅ Heikin Ashi trend confirmation
✅ Smoothed Stochastic Momentum Index (SMI)
✅ Take Profit (TP) signals via momentum reversal
✅ Dynamic support from average price action
The goal: Give retail traders institutional-grade signals with clarity, without lag.
📊 Trade Entry Logic
🔼 CALL Signal (Buy):
Fast EMA < Avg Price
Slow EMA < Avg Price
Slow EMA < Fast EMA
Confirmed by crossover
➡️ This implies price has dipped below value zones and is showing strength.
🔽 PUT Signal (Sell):
Fast EMA > Avg Price
Slow EMA > Avg Price
Slow EMA > Fast EMA
Confirmed by crossover
➡️ Indicates price is elevated and showing weakness.
🏁 Exit Logic (Take Profit)
✅ TP Buy Signal: SMI crosses below 0 → Weakening upside
✅ TP Sell Signal: SMI crosses above 0 → Weakening downside
These act as exit cues or partial booking areas.
📌 Visualization & Alerts
🔼 CALL Signal → Green label below candle
🔽 PUT Signal → Red label above candle
✅ TP Signal → Small label (TP) showing ideal exit points
🔔 Real-time alerts enabled (CALL, PUT, TP alerts)
Background color changes based on EMA crossovers for added confirmation.
🕯️ Additional Filters Used
Heikin Ashi Candles: For smoothing out noise and validating trends.
SMI (Double EMA): A momentum indicator better suited for trending markets.
📈 Dashboard Included
Displays current signal, SMI value, and TP status in real-time
Color-coded for easy interpretation
Auto-adaptive table (fixes out-of-bound issues)
📎 Ideal Timeframes
Timeframe Use Case
5m – 15m Intraday Scalping
1h – 4h Swing Trading
1D Positional Plays
🚦 Suggested Usage
Step Action
1️⃣ Confirm signal (CALL or PUT) on 1TF and 1 higher TF
2️⃣ Enter near signal candle close
3️⃣ Exit on TP label OR SMI reversal
4️⃣ Avoid entry during high volatility news events
⚠️ Disclaimer – Use with Caution!
⚠️ This script is for educational & analytical purposes only.
It does NOT guarantee profits, nor is it a financial advisory tool.
Always use risk management: Stop-losses, position sizing, capital preservation.
Do not trade blindly. Backtest it across market conditions.
Past performance is not indicative of future results.
Consult a SEBI-registered advisor for real trading decisions.
🔍 Candle Scanner (75m/D/W/M) + Volume + EMA + Trend//@version=5
indicator("🔍 Candle Scanner (75m/D/W/M) + Volume + EMA + Trend", overlay=true)
is75min = timeframe.period == "75"
// Time Slot Logic for 75-min only
startTime = timestamp("Asia/Kolkata", year, month, dayofmonth, 9, 15)
candle75 = math.floor((time - startTime) / (75 * 60 * 1000)) + 1
candleNo = is75min and candle75 >= 1 and candle75 <= 5 ? candle75 : na
getTimeSlot(n) =>
slot = ""
if n == 1
slot := "09:15–10:30"
else if n == 2
slot := "10:30–11:45"
else if n == 3
slot := "11:45–13:00"
else if n == 4
slot := "13:00–14:15"
else if n == 5
slot := "14:15–15:30"
slot
// EMA Filters
ema20 = ta.ema(close, 20)
ema50 = ta.ema(close, 50)
aboveEMA20 = close > ema20
aboveEMA50 = close > ema50
// Volume Strength
avgVol = ta.sma(volume, 20)
volStrength = volume > avgVol ? "High Volume" : "Low Volume"
// Candle Body Strength
bodySize = math.abs(close - open)
fullSize = high - low
bodyStrength = fullSize > 0 ? (bodySize / fullSize > 0.6 ? "Strong Body" : "Small Body") : "Small Body"
// Prior Trend
priorTrend = close < close and close < close ? "Downtrend" :
close > close and close > close ? "Uptrend" : "Sideways"
// Patterns
bullishEngulfing = close > open and close < open and close > open and open < close
bearishEngulfing = close < open and close > open and close < open and open > close
hammer = (high - low) > 3 * bodySize and (close - low) / (0.001 + high - low) > 0.6 and (open - low) / (0.001 + high - low) > 0.6
shootingStar = (high - low) > 3 * bodySize and (high - close) / (0.001 + high - low) > 0.6 and (high - open) / (0.001 + high - low) > 0.6
doji = bodySize <= fullSize * 0.1
morningStar = close < open and bodySize < (high - low ) * 0.3 and close > (open + close ) / 2
eveningStar = close > open and bodySize < (high - low ) * 0.3 and close < (open + close ) / 2
// Pattern Selection
pattern = ""
sentiment = ""
colorBox = color.gray
yOffset = 15
if bullishEngulfing
pattern := "Bull Engulfing"
sentiment := "Bullish"
colorBox := color.green
yOffset := -15
else if bearishEngulfing
pattern := "Bear Engulfing"
sentiment := "Bearish"
colorBox := color.red
yOffset := 15
else if hammer
pattern := "Hammer"
sentiment := "Bullish"
colorBox := color.green
yOffset := -15
else if shootingStar
pattern := "Shooting Star"
sentiment := "Bearish"
colorBox := color.red
yOffset := 15
else if doji
pattern := "Doji"
sentiment := "Neutral"
colorBox := color.gray
yOffset := 15
else if morningStar
pattern := "Morning Star"
sentiment := "Bullish"
colorBox := color.green
yOffset := -15
else if eveningStar
pattern := "Evening Star"
sentiment := "Bearish"
colorBox := color.red
yOffset := 15
timeSlot = is75min and not na(candleNo) ? getTimeSlot(candleNo) : ""
info = pattern != "" ? "🕒 " + (is75min ? timeSlot + " | " : "") + pattern + " (" + sentiment + ") | " + volStrength + " | " + bodyStrength + " | Trend: " + priorTrend + " | EMA20: " + (aboveEMA20 ? "Above" : "Below") + " | EMA50: " + (aboveEMA50 ? "Above" : "Below") : ""
// Label Draw
var label lb = na
if info != ""
lb := label.new(bar_index, high + yOffset, text=info, style=label.style_label_down, textcolor=color.white, size=size.small, color=colorBox)
label.delete(lb )
// Smart Alert
validAlert = pattern != "" and (volStrength == "High Volume") and bodyStrength == "Strong Body" and (aboveEMA20 or aboveEMA50)
alertcondition(validAlert, title="📢 Smart Candle Alert", message="Smart Alert: Candle with Volume + EMA + Trend + Pattern Filtered")

Volume Labels BABYBOTVolume labels babybot spwan for use with 1 min breakout volume candles OKLO NFLX ASML HIMS

Price discovery indicatorGives an ability to show places where price drops more than n percent in x candles. Use cases: see dips of btc, get a notification when a stablecoin goes crazy, validate that webhook integration works as expected using keep alive messages.
Features included:
- Price dip alerts. Create an alert that sends a notification every time price dips more than expected (yellow zone at the chart).
- Percentage drop threshold. Define how many percents price should drop to trigger an alert and to show a yellow zone.
- Candles length threshold. Define within how many candles this drop should happen. If price drops in 2% within 10 candles, but this option is 5 - the alert will not be triggered because price dropped not as fast as expected.
- Templates of messages on price dip and price recovery. Set your message that should be triggered with alert.
- Keep alive feature. Set to trigger keep alive alerts every period. Can be helpful if you don't check charts often - this feature will trigger alert every period with "hey, the integration is alive" message. I use it to validate on weekly basis that tradingview triggers my alerts (example: you created an alert with expiration date and forgot to recreate it), that webhook integration receives these alerts, that the integration sends these alerts to telegram. Example: I expect to see this message every monday's morning, otherwise something is broken and I have to check what is wrong with my alerting system.
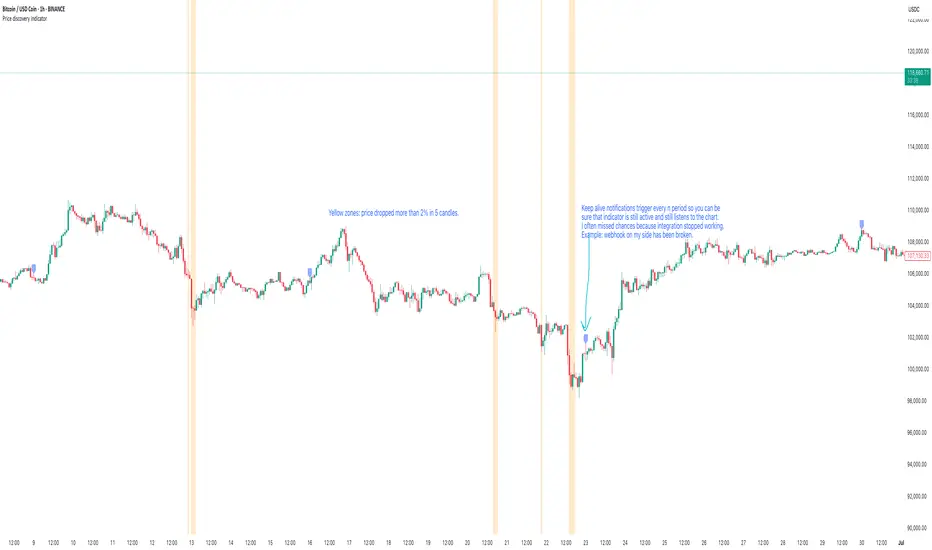
Impulse Alert - Demand (Buy) [Fixed]🔵 Impulse Alert – Demand (Buy)
This indicator is designed to detect high-probability Demand Zones based on impulsive bullish price action, helping traders get alerted only when it matters most.
🧠 Core Logic:
Scans the chart for 2 consecutive bullish impulsive candles with significant range (body size)
Also captures single large bullish impulse candles that often mark institutional buying
Marks the origin of the move as a potential Demand Zone
Sends alerts when such bullish setups form, allowing you to monitor charts passively
⚙️ Features:
✅ Alerts on impulsive move formations
✅ Detects both 2-candle and single-candle impulses
✅ Custom zone detection logic based on pip size and momentum
✅ Cleaner & smarter: removes distractions and avoids false signals
📌 Best Used For:
Smart Money / Supply & Demand traders
Identifying potential institutional buy zones
Executing trades with HTF confluence
Traders who want to get alerted without screen-watching
🔁 Suggested Strategy:
Set HTF directional bias (H1, H4, D1)
Use this indicator on LTF (1M–15M) for impulsive bullish entries
Wait for price to return to the marked zone for low-risk entries
💡 Pro Tip: Combine with your Supply Zone (Sell) indicator to track both sides of market structure and increase R:R
👤 Created by: Rohit Jadhav | YT/Insta/X - @GrowthByTrading
📬 Want updates, enhancements, or personal versions? Leave feedback or reach out through profile!
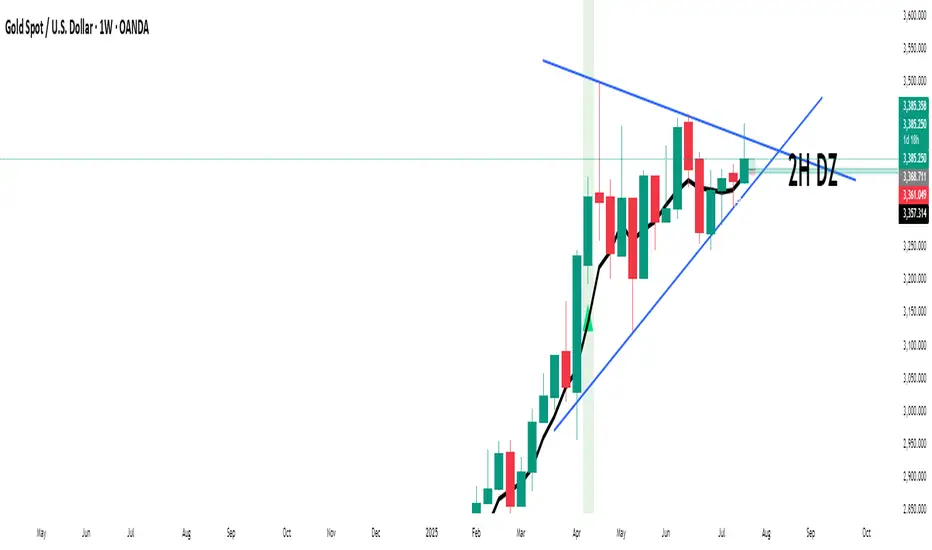
Impulse Alert - Supply (Sell) [Fixed]🟥 Supply Zone (Sell) – Institutional Order Block Detector
This custom indicator automatically detects valid Supply Zones (Sell Zones) based on Smart Money Concepts and institutional trading behavior.
🔍 How It Works:
Identifies strong bearish impulsive moves after price forms a potential Order Block
Valid supply zones are plotted after:
A valid rally–base–drop or drop–base–drop structure
A shift in structure or clear imbalance is detected
The zone is created from the last bullish candle before a strong bearish engulfing move
Zones remain on chart until price revisits and reacts
📊 Use Case:
Ideal for traders using Smart Money Concepts (SMC), Supply & Demand, or ICT-inspired strategies
Perfect for scalping, day trading, or swing setups
Designed for confluence with HTF bias and LTF execution
⚙️ Features:
Supply Zone auto-plotting
Customizable zone color and opacity
Alerts when price returns to the zone (retest entry opportunity)
🧠 Tip for Best Use:
Use in confluence with:
HTF Supply zones (manual or other indicator)
Market Structure breaks
Fair Value Gaps or Imbalance zones
Strong impulsive moves from HTF to LTF
🔁 Future Additions (Coming Soon):
Demand Zone detection
Zone strength rating system
Refined zone filters (volume, candle size, etc.)
Alerts for mitigation or invalidation
📌 Created by: Rohit Jadhav | Real-time market trader | YT/Insta - @GrowthByTrading
💬 Feedback? Drop a comment or connect via profile for updates and tutorials!


Average Daily Range in TicksPurpose: The ADR Ticks Indicator calculates and displays the average daily price range of a financial instrument, expressed in ticks, over a user-specified number of days. It provides traders with a measure of average daily volatility, which can be used for position sizing, setting stop-loss/take-profit levels, or assessing market activity.
Calculation: Computes the average daily range by taking the difference between the daily high and low prices, averaging this range over a customizable number of days, and converting the result into ticks (using the instrument's minimum tick size).
Customization: Includes a user input to adjust the number of days for the average calculation and a toggle to show/hide the ADR Ticks value in the table.
Risk Management: Helps traders estimate typical daily price movement to set appropriate stop-loss or take-profit levels.
Market Analysis: Offers insight into average daily volatility, useful for day traders or swing traders assessing whether a market is trending or ranging.
Technical Notes:
The indicator uses barstate.islast to update the table only on the last bar, reducing computational load and preventing overlap.
The script handles different chart timeframes by pulling daily data via request.security, making it robust across various instruments and timeframes.

MA20/EMA200 Crossover Alert# MA20/EMA200 Crossover Alert with Telegram Integration
**Description:**
This indicator identifies key trend reversals by detecting when the 20-period Simple Moving Average (MA20) crosses the 200-period Exponential Moving Average (EMA200). These crossovers are widely recognized as significant signals for medium to long-term trend changes.
**Key Features:**
- Real-time detection of MA20/EMA200 crossovers on any timeframe (optimized for 1H)
- Visual signals with up/down triangles at crossover points
- Background color highlights for easy identification
- Built-in alert system with JSON-formatted messages for Telegram webhook integration
- Clean, customizable interface with adjustable MA/EMA periods
**Signals:**
- 🟢 **Bullish Signal**: MA20 crosses above EMA200 (potential uptrend beginning)
- 🔴 **Bearish Signal**: MA20 crosses below EMA200 (potential downtrend beginning)
**Alert Integration:**
The indicator includes pre-formatted alert messages designed for direct integration with Telegram bots via webhooks. Each alert contains:
- Symbol and exchange information
- Current price at crossover
- Signal type (BULLISH/BEARISH)
- Descriptive message
**Best Use Cases:**
- Trend following strategies
- Position entry/exit timing
- Multi-timeframe analysis
- Automated trading system triggers
**Note:** This indicator works best on liquid markets and higher timeframes (1H, 4H, 1D) to reduce false signals. Always combine with other analysis methods for confirmation.
**Tags:** ma, ema, moving average, crossover, trend, telegram, alert, webhook, trading, signal
