Premarket High/Low Breakout AlertsPremarket High/Low Breakout Alerts
Description: This custom TradingView indicator helps you track premarket breakouts and breakdowns for a list of selected stocks. The indicator monitors the premarket session and sends an alert every time the stock's price breaks above the premarket high or below the premarket low.
Key Features:
Track Multiple Stocks: Easily monitor multiple stocks (e.g., AAPL, TSLA, NVDA, etc.) and get alerts when they break premarket levels.
Premarket Session Monitoring: The indicator checks for price movements during the premarket session (4:00 AM to 9:30 AM EST).
Customizable Ticker List: Modify the list of tickers directly from the TradingView settings to suit your daily trading needs.
Breakout and Breakdown Alerts: Receive instant alerts for both breakout (above premarket high) and breakdown (below premarket low) conditions.
Plot Premarket Levels: The premarket high and low levels are plotted on the chart for easy reference.
How to Use:
Add this indicator to your chart.
Go to the indicator settings and input your desired stock tickers (e.g., AAPL, TSLA, MSFT).
The indicator will automatically track the premarket levels and send alerts when those levels are broken.
Customize the tickers daily if needed.
Ideal For:
Day Traders who want to track premarket movements.
Swing Traders looking for strong breakouts from premarket levels.
Scalpers who need quick alerts to catch price action early.
Chart patterns

Intraday Low Engulf Line This indicator currently work on Future product as it track the intraday low for the daily session from 6pm to 5pm EST. You may have to manually adjust the code if there is a time difference, or day light saving.
This indicator will track all new intraday low through out the session. Once a new intraday low is made, the indicator will display the high of that candle as an engulf target.
If the next candle making a intraday low, this engulf target will be updated. Until there is no more intraday low is made, we will see a engulf target line which is the high of the candle that make the most recent intraday low.
If there is any candle body is below the intraday low engulf life, you can expect to place a buy stop order to trade the bullish reversal.
You may want to use 5m or 15m, or 30M timeframe to reduce the noise of this indicator.
Your stop loss will be set at the intraday low. Therefore a higher time frame 5m is better for entry, however 1m timeframe will give you the best reward.
The idea is that Indraday low engulf line can be a target for bullish reversal or a bullish retest.
Another way to use this this intraday low engulf line is to treat it as a support. If the support break, the trend can be bearish too.
You have to develop your own price action strategy how to trade this.
I will also add an intraday High engulf indicator later.

ICT Gold Trading ToolFirst, I recall the original code had elements like Break of Structure, Fair Value Gaps, Premium/Discount Zones, Liquidity Pools, and Buy/Sell signals. The user had previous feedback pointing out issues in the code, like incorrect timeframe usage for BOS and FVG inaccuracies. They also suggested improvements, which were incorporated into a revised version.
So, the brief note should highlight the main components of the tool without getting too technical. The user probably wants this for a quick overview, maybe to share with others or for their own reference. They might be a trader familiar with ICT concepts, so using terms like BOS or FVG is okay without explaining each one.
I need to mention that the tool combines multiple ICT strategies into one indicator. It uses higher timeframes for BOS, which is important for structure. FVG detection was corrected in the revised code, so I should note that it identifies 3-candle patterns. The zones and liquidity pools help in identifying market extremes and areas where price might reverse. The buy/sell signals are based on a combination of BOS and zones, which adds confluence.
Also, the user might appreciate knowing that the tool is customizable with inputs for periods, making it adaptable to different trading styles. Emphasizing that it's for visual assistance and not standalone signals is crucial to remind users to use additional analysis.

Pivot Point Calculator PPC V2 by [KhedrFx]📈 Trade Smarter with the Pivot Point Calculator (PPC) by KhedrFx
Want to spot key price levels and make better trading decisions? The Pivot Point Calculator (PPC) by KhedrFx is your go-to TradingView tool for identifying potential support and resistance zones. Whether you’re a Scalper trader, day trader, swing trader, or long-term investor, this script helps you plan precise entries and exits with confidence.
🔹 How to Use Pivot Points in Trading
📊 Step 1: Identify Key Levels
The PPC automatically plots:
Pivot Point (P): The main level where sentiment shifts between bullish and bearish.
Support Levels (S1, S2, S3): Areas where price may bounce higher.
Resistance Levels (R1, R2, R3): Areas where price may face selling pressure.
These levels act as dynamic price zones, helping you anticipate potential market movements.
🔥 Step 2: Choose Your Trading Strategy
1️⃣ Breakout Trading
Buy when the price breaks above the pivot point (P) with strong momentum.
Sell when the price drops below the pivot point (P) with strong momentum.
Use R1, R2, or R3 as profit targets in an uptrend and S1, S2, or S3 in a downtrend.
2️⃣ Reversal (Bounce) Trading
Buy when the price pulls back to S1, S2, or S3 and shows bullish confirmation (e.g., candlestick patterns like a bullish engulfing or hammer).
Sell when the price rallies to R1, R2, or R3 and shows bearish confirmation (e.g., rejection wicks or a bearish engulfing pattern).
🎯 Step 3: Set Smart Stop-Loss & Take-Profit Levels
Stop-Loss: Place it slightly below support (for buy trades) or above resistance (for sell trades).
Take-Profit: Use the next pivot level as a target.
Extreme Zones: R3 and S3 often signal strong reversals or breakouts—watch them closely!
🚀 How to Get Started
1️⃣ Add the PPC script to your TradingView chart.
2️⃣ Choose a timeframe that fits your strategy (5m, 15m, 30m, 1H, 4H, Daily, or Weekly).
3️⃣ Use the pivot points and support/resistance levels to fine-tune your trade entries, exits, and risk management.
⚠️ Trade Responsibly
This tool helps you analyze the market, but it’s not a guarantee of profits. Always do your own research, manage risk, and trade with caution.
💡 Ready to take your trading to the next level? Try the Pivot Point Calculator (PPC) by KhedrFx and start trading with confidence today! 🚀

Scalping Entry/Exit Indicator by DiGetImagine having a tool that not only spots high-probability entry signals but also visually marks them on your chart with color-coded cues and automated alerts. The Scalping Entry/Exit Indicator by DiGet does exactly that—by fusing a range of classic candlestick patterns (such as Bullish Hammers, Engulfing patterns, and Morning/Evening Stars) with dynamic risk management levels, this script empowers you to make swift and informed trading decisions. Whether you're an active trader or an algorithm enthusiast, this indicator offers both precision and clarity in identifying scalp opportunities, making your chart analysis more efficient and visually engaging.
Indicator Breakdown
Input Parameters:
The indicator accepts a customizable risk-reward ratio, an ATR period for volatility measurement, and a lookback period to scan for valid candlestick patterns.
ATR & Candle Calculations:
It computes the Average True Range (ATR) to dynamically set stop-loss and take-profit levels. Additionally, it determines the body and wick sizes of each candlestick to help identify key reversal patterns.
Pattern Detection:
Multiple bullish patterns (Hammer, Engulfing, Morning Star) and bearish patterns (Shooting Star, Engulfing, Evening Star) are detected. There’s also a simplified version of the Head & Shoulders pattern, offering further validation for reversal signals.
Signal Generation & Trade Levels:
The script consolidates the pattern signals into combined “buy” and “sell” triggers. It then calculates the respective stop-loss (SL) and take-profit (TP) levels based on the current price and ATR, providing a robust risk management framework.
Visual Aids & Alerts:
To enhance usability, the indicator changes the chart’s background color to green for buy signals and red for sell signals. It also draws labels, lines (representing SL and TP), and markers directly on the chart, along with alert conditions to notify traders of actionable signals.
This indicator is an excellent addition to your TradingView toolkit—ideal for scalpers and short-term traders seeking clarity, precision, and automated signal generation on their charts.
Enjoy trading with confidence and precision!

MLB Momentum IndicatorMLB Momentum Indicator is a no‐lookahead technical indicator designed to signal intraday trend shifts and potential reversal points. It combines several well‐known technical components—Moving Averages, MACD, RSI, and optional ADX & Volume filters—to deliver high‐probability buy/sell signals on your chart.
Below is an overview of how it works and what each part does:
1. Moving Average Trend Filter
The script uses two moving averages (fast and slow) to determine the primary trend:
isUpTrend if Fast MA > Slow MA
isDownTrend if Fast MA < Slow MA
You can select the MA method—SMA, EMA, or WMA—and customize lengths.
Why it matters: The indicator only gives bullish signals if the trend is up, and bearish signals if the trend is down, helping avoid trades that go against the bigger flow.
2. MACD Confirmation (Momentum)
Uses MACD (with user‐defined Fast, Slow, and Signal lengths) to check momentum:
macdBuySignal if the MACD line crosses above its signal line (bullish)
macdSellSignal if the MACD line crosses below its signal line (bearish)
Why it matters: MACD crossovers confirm an emerging momentum shift, aligning signals with actual price acceleration rather than random fluctuation.
3. RSI Overbought/Oversold Filter
RSI (Relative Strength Index) is calculated with a chosen length, plus Overbought & Oversold thresholds:
For long signals: the RSI must be below the Overbought threshold (e.g. 70).
For short signals: the RSI must be above the Oversold threshold (e.g. 30).
Why it matters: Prevents buying when price is already overbought or shorting when price is too oversold, filtering out possible poor‐risk trades.
4. Optional ADX Filter (Trend Strength)
If enabled, ADX must exceed a chosen threshold (e.g., 20) for a signal to be valid:
This ensures you’re only taking trades in markets that have sufficient directional momentum.
Why it matters: It weeds out choppy, sideways conditions where signals are unreliable.
5. Optional Volume Filter (High‐Participation Moves)
If enabled, the indicator checks whether current volume is above a certain multiple of its moving average (e.g., 1.5× average volume).
Why it matters: High volume often indicates stronger institutional interest, validating potential breakouts or reversals.
6. ATR & Chandelier (Visual Reference)
For reference only, the script can display ATR‐based stop levels or a Chandelier Exit line:
ATR (Average True Range) helps gauge volatility and can inform stop‐loss distances.
Chandelier Exit is a trailing stop technique that adjusts automatically as price moves.
Why it matters: Though this version of the script doesn’t execute trades, these lines help you see how far to place stops or how to ride a trend.
7. Final Bullish / Bearish Signal
When all conditions (trend, MACD, RSI, optional ADX, optional Volume) line up for a long, a green “Long” arrow appears.
When all conditions line up for a short, a red “Short” arrow appears.
Why it matters: You get a clear, on‐chart signal for each potential entry, rather than needing to check multiple indicators manually.
8. Session & Date Filtering
The script allows choosing a start/end date and an optional session window (e.g. 09:30–16:00).
Why it matters: Helps limit signals to a specific historical backtest range or trading hours, which can be crucial for day traders (e.g., stock market hours only).
Putting It All Together
Primary Trend → ensures you trade in line with the bigger direction.
MACD & RSI → confirm momentum and avoid overbought/oversold extremes.
ADX & Volume → optional filters for strong trend strength & genuine interest.
Arrows → each potential buy (Long) or sell (Short) signal is clearly shown on your chart.
Use Cases
5‐Minute Scalping: Shorter RSI/MACD lengths to catch small, frequent intraday moves.
Swing Trading: Larger MAs, bigger RSI thresholds, and using ADX to filter only major trends.
Cautious Approach: Enable volume & ADX filters to reduce false signals in choppy markets.
Benefits & Limitations
Benefits:
Consolidates multiple indicators into one overlay.
Clear buy/sell signals with optional dynamic volatility references.
Flexible user inputs adapt to different trading styles/timeframes.
Limitations:
Like all technical indicators, it can produce false signals in sideways or news‐driven markets.
Success depends heavily on user settings and the particular market’s behavior.
Summary
The MLB Momentum Indicator combines a trend filter (MAs), momentum check (MACD), overbought/oversold gating (RSI), and optional ADX/Volume filters to create clear buy/sell arrows on your chart. This approach encourages trading in sync with both trend and momentum, and helps avoid suboptimal entries when volume or trend strength is lacking. It can be tailored to scalp micro‐moves on lower timeframes or used for higher‐timeframe swing trading by adjusting the input settings.

Absolute Rate Of Changeabsolute value of ROC indicator. helpful for determining if the momentum is accelerating in regardless of direction

Similar Bars Pattern DetecterDescription:
The Similar Bars Pattern Detector is a professional Pine Script indicator designed for TradingView users who want to identify sequences of similar candlesticks in a row. Whether you're looking for bullish or bearish patterns, this tool helps you spot repeating formations based on customizable settings.
Features:
✅ Detects patterns of consecutive similar bars
✅ Works for both bullish and bearish trends
✅ Uses tick-based range filtering for precise detection
✅ Fully customizable: adjust number of candles, trend type, and range
✅ Highlights detected patterns directly on the chart
🔹 Ideal for traders who rely on pattern recognition to confirm trends and price movements.
🔹 Works across all markets and timeframes.
💡 How to Use:
1️⃣ Set the number of candles to detect a repeating pattern.
2️⃣ Choose bullish or bearish trend direction.
3️⃣ Adjust the tick range to fine-tune pattern similarity.
🚀 Enhance your trading analysis with this powerful pattern recognition tool!

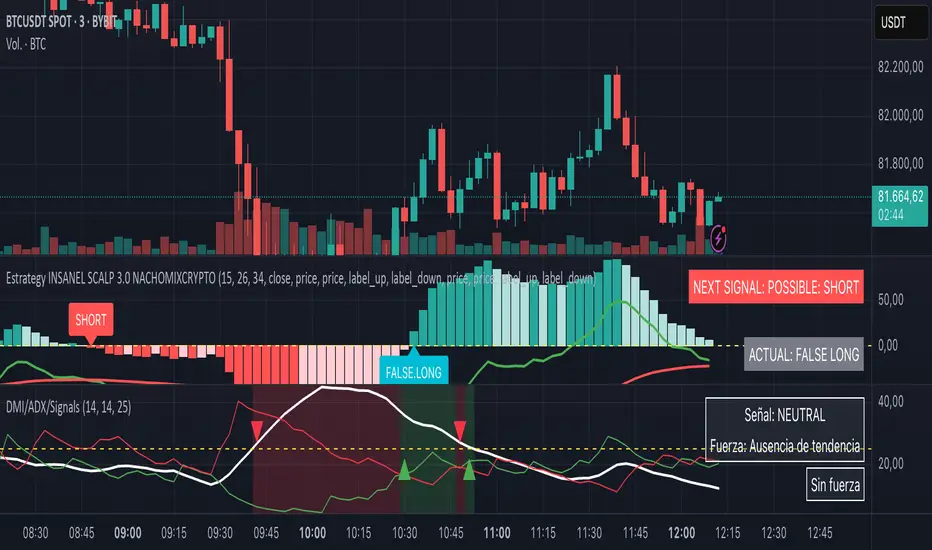
DMI + ADX + Key Level NACHOMIXCRYPTOThe DMI + ADX + Key Level NACHOMIXCRYPTO indicator is a technical analysis tool that combines the Directional Movement Index (DMI) and the Average Directional Index (ADX) to assess trend strength and direction. It also includes customizable key levels for better visualization.
Components:
ADX (Average Directional Index):
Measures the strength of a trend, regardless of its direction.
Values below 25 indicate a weak trend or range-bound market.
Values between 25-50 suggest a strong trend.
Values between 50-75 indicate a very strong trend.
Values above 75 represent an extremely strong trend.
+DI (Positive Directional Indicator) and -DI (Negative Directional Indicator):
+DI indicates bullish strength, shown in green.
-DI indicates bearish strength, shown in red.
The comparison between these two lines helps determine the market direction.
Features:
Trend Detection:
When +DI is above -DI and ADX is above the key level, it signals a bullish trend.
When -DI is above +DI and ADX is above the key level, it signals a bearish trend.
Key Level Line:
A customizable horizontal line that marks the threshold for trend strength.
Trend Background Color:
Green for strong uptrends and red for strong downtrends.
Signal Arrows:
A green upward triangle is plotted when a new bullish trend starts.
A red downward triangle is plotted when a new bearish trend starts.
Trend Strength Labels:
The indicator displays the current market strength classification and whether the trend is bullish, bearish, or neutral.
Strength Analysis Table:
Provides insights on whether the market has bullish, bearish, mixed strength, or no strength at all.
This indicator is particularly useful for traders looking to identify strong trends and catch early trend reversals.
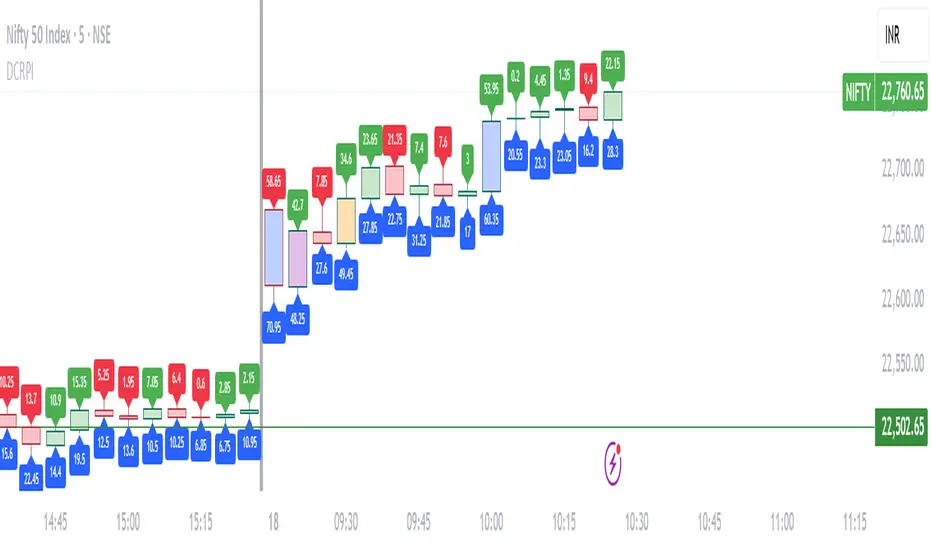
Dynamic Candle Range Point IndicatorThe "Dynamic Candle Range Point Indicator" (DCRPI) does two important jobs at once. For each candle on your chart, it shows you exactly how many points the price moved in two different ways:
1. At the top of each candle, you'll see how many points the price moved from open to close (the body range)
2. At the bottom, you'll see the total movement from the highest to lowest point (the full range)
The really smart part is how it colors the borders of candles based on how much the price moved. This gives you a quick visual way to spot significant price movements:
- Small movements keep the standard green/red colors
- Medium movements (25-30 points) show as yellow
- Larger movements get more unique colors (orange, purple, blue, etc.)
This makes it easy to instantly identify which candles had the most significant price movement without having to read all the numbers. You can quickly spot the most volatile candles across your chart by their distinctive border colors.
The indicator is lightweight and should run smoothly on most charts without causing performance issues.
RSI Disparity SignalRSI Disparity Signal Indicator
Overview:
This TradingView indicator detects when the RSI is significantly lower than its RSI-based moving average (RSI MA). Whenever the RSI is 20 points or more below the RSI MA, a signal (red dot) appears above the corresponding candlestick.
How It Works:
Calculates RSI using the default 14-period setting.
Calculates the RSI-based Moving Average (RSI MA) using a 14-period simple moving average (SMA).
Measures the disparity between the RSI and its MA.
Generates a signal when the RSI is 20 points or more below the RSI MA.
Plots a red circle above the candlestick whenever this condition is met.
Customization:
You can modify the RSI length and MA period to fit your trading strategy.
Change the plotshape() style to use different symbols like triangles or arrows.
Adjust the disparity threshold (currently set at 20) to make the signal more or less sensitive.
Use Case:
This indicator can help identify potentially oversold conditions where RSI is significantly below its average, signaling possible price reversals.

Fair Value Gap Finder [Find Better Trades]Fair Value Gap Finder (FVG) – Spot Institutional Imbalances
📈 Identify Key Market Imbalances
The Fair Value Gap Finder automatically detects price inefficiencies where aggressive buying or selling has created an imbalance in liquidity. These gaps, often left by institutional traders, can serve as key areas for price to revisit before continuing its trend.
🔍 How It Works:
Highlights bullish Fair Value Gaps (FVGs) in green, signaling potential support zones.
Highlights bearish Fair Value Gaps (FVGs) in red, signaling potential resistance zones.
Uses ATR-based filtering to eliminate small, insignificant gaps, focusing only on high-probability setups.
Alerts included! Get notified when a valid Fair Value Gap is detected.
📊 How to Trade Using FVGs:
✅ For Buy Trades: Wait for price to return to a bullish FVG and confirm support before entering long.
✅ For Sell Trades: Wait for price to revisit a bearish FVG and confirm resistance before entering short.
✅ Use with candlestick patterns, trend analysis, or volume for additional confirmation.
⚙️ Customizable Settings:
Adjust the ATR Multiplier to control how large a gap must be before triggering a signal.
Enable alerts to stay informed in real time when new FVGs appear.
💡 Why Use This Indicator?
Fair Value Gaps are widely used by professional traders to spot areas of liquidity, making them valuable for scalping, swing trading, and institutional-style trading.
🚀 Add it to your TradingView chart and start trading with precision!

Quarterly Theory ICT 03 [TradingFinder] Precision Swing Points🔵 Introduction
Precision Swing Point (PSP) is a divergence pattern in the closing of candles between two correlated assets, which can indicate a potential trend reversal. This structure appears at market turning points and highlights discrepancies between the price behavior of two related assets.
PSP typically forms in key timeframes such as 5-minute, 15-minute, and 90-minute charts, and is often used in combination with Smart Money Concepts (SMT) to confirm trade entries.
PSP is categorized into Bearish PSP and Bullish PSP :
Bearish PSP : Occurs when an asset breaks its previous high, and its middle candle closes bullish, while the correlated asset closes bearish at the same level. This divergence signals weakness in the uptrend and a potential price reversal downward.
Bullish PSP : Occurs when an asset breaks its previous low, and its middle candle closes bearish, while the correlated asset closes bullish at the same level. This suggests weakness in the downtrend and a potential price increase.
🟣 Trading Strategies Using Precision Swing Point (PSP)
PSP can be integrated into various trading strategies to improve entry accuracy and filter out false signals. One common method is combining PSP with SMT (divergence between correlated assets), where traders identify divergence and enter a trade only after PSP confirms the move.
Additionally, PSP can act as a liquidity gap, meaning that price tends to react to the wick of the PSP candle, making it a favorable entry point with a tight stop-loss and high risk-to-reward ratio. Furthermore, PSP combined with Order Blocks and Fair Value Gaps in higher timeframes allows traders to identify stronger reversal zones.
In lower timeframes, such as 5-minute or 15-minute charts, PSP can serve as a confirmation for more precise entries in the direction of the higher timeframe trend. This is particularly useful in scalping and intraday trading, helping traders execute smarter entries while minimizing unnecessary stop-outs.
🔵 How to Use
PSP is a trading pattern based on divergence in candle closures between two correlated assets. This divergence signals a difference in trend strength and can be used to identify precise market turning points. PSP is divided into Bullish PSP and Bearish PSP, each applicable for long and short trades.
🟣 Bullish PSP
A Bullish PSP forms when, at a market turning point, the middle candle of one asset closes bearish while the correlated asset closes bullish. This discrepancy indicates weakness in the downtrend and a potential price reversal upward.
Traders can use this as a signal for long (buy) trades. The best approach is to wait for price to return to the wick of the PSP candle, as this area typically acts as a liquidity level.
f PSP forms within an Order Block or Fair Value Gap in a higher timeframe, its reliability increases, allowing for entries with tight stop-loss and optimal risk-to-reward ratios.
🟣 Bearish PSP
A Bearish PSP forms when, at a market turning point, the middle candle of one asset closes bullish while the correlated asset closes bearish. This indicates weakness in the uptrend and a potential price decline.
Traders use this pattern to enter short (sell) trades. The best entry occurs when price retests the wick of the PSP candle, as this level often acts as a resistance zone, pushing price lower.
If PSP aligns with a significant liquidity area or Order Block in a higher timeframe, traders can enter with greater confidence and place their stop-loss just above the PSP wick.
Overall, PSP is a highly effective tool for filtering false signals and improving trade entry precision. Combining PSP with SMT, Order Blocks, and Fair Value Gaps across multiple timeframes allows traders to execute higher-accuracy trades with lower risk.
🔵 Settings
Mode :
2 Symbol : Identifies PSP and PCP between two correlated assets.
3 Symbol : Compares three assets to detect more complex divergences and stronger confirmation signals.
Second Symbol : The second asset used in PSP and correlation calculations.
Third Symbol : Used in three-symbol mode for deeper PSP and PCP analysis.
Filter Precision X Point : Enables or disables filtering for more precise PSP and PCP detection. This filter only identifies PSP and PCP when the base asset's candle qualifies as a Pin Bar.
Trend Effect : By changing the Trend Effect status to "Off," all Pin bars, whether bullish or bearish, are displayed regardless of the current market trend. If the status remains "On," only Pin bars in the direction of the main market trend are shown.
Bullish Pin Bar Setting : Using the "Ratio Lower Shadow to Body" and "Ratio Lower Shadow to Higher Shadow" settings, you can customize your bullish Pin bar candles. Larger numbers impose stricter conditions for identifying bullish Pin bars.
Bearish Pin Bar Setting : Using the "Ratio Higher Shadow to Body" and "Ratio Higher Shadow to Lower Shadow" settings, you can customize your bearish Pin bar candles. Larger numbers impose stricter conditions for identifying bearish Pin bars.
🔵 Conclusion
Precision Swing Point (PSP) is a powerful analytical tool in Smart Money trading strategies, helping traders identify precise market turning points by detecting divergences in candle closures between correlated assets. PSP is classified into Bullish PSP and Bearish PSP, each playing a crucial role in detecting trend weaknesses and determining optimal entry points for long and short trades.
Using the PSP wick as a key liquidity level, integrating it with SMT, Order Blocks, and Fair Value Gaps, and analyzing higher timeframes are effective techniques to enhance trade entries. Ultimately, PSP serves as a complementary tool for improving entry accuracy and reducing unnecessary stop-outs, making it a valuable addition to Smart Money trading methodologies.

Gold Scalping BOS & CHoCHThis strategy is designed for scalping gold (XAU/USD) on the 3-minute timeframe, utilizing Break of Structure (BOS) and Change of Character (CHoCH) to identify high-probability trade setups. Unlike traditional SMA crossover strategies, this method focuses purely on price action and market structure shifts, allowing for early entries and better risk management.
Core Concepts:
Break of Structure (BOS) – Confirms a continuation of the trend when price breaks the last swing high (bullish) or last swing low (bearish).
Change of Character (CHoCH) – Detects possible trend reversals by identifying a shift in market momentum.
Dynamic Support & Resistance – Uses the last 10-bar highs and lows to determine adaptive stop-loss (SL) and take-profit (TP) levels.
Risk-to-Reward Ratio (1:2 RR) – Ensures trades are executed with a favorable risk/reward ratio.
Entry Conditions:
Buy Entry:
BOS (Bullish) confirmed (price breaks the previous swing high).
CHoCH (Bullish) confirms trend shift.
Price crosses back above the last swing low (confirmation of support).
Sell Entry:
BOS (Bearish) confirmed (price breaks the previous swing low).
CHoCH (Bearish) confirms trend shift.
Price crosses back below the last swing high (confirmation of resistance).
Exit Conditions:
Stop Loss (SL): Set at the most recent dynamic support (for buys) or resistance (for sells).
Take Profit (TP): 2x the risk (1:2 risk-reward ratio).
Advantages of This Strategy:
✅ No lagging indicators – Uses price action for real-time entries.
✅ High probability setups – Focuses only on strong structural breaks.
✅ Adaptive SL/TP – Uses real market structure instead of fixed values.
✅ Optimized for Scalping – Best suited for quick in-and-out trades.
Best Time to Trade:
🔹 London & New York Sessions (High volatility for gold).

High and Low in a Given Date/Time RangeThis Pine Script v5 indicator plots horizontal lines at both the highest and lowest price levels reached within a user-defined date/time range.
Description:
Inputs:
The user specifies a start and an end date/time by providing the year, month, day, hour, and minute for each. These inputs are converted into timestamps based on the chart’s timezone.
How It Works:
Timestamp Conversion: The script converts the provided start and end dates/times into timestamps using the chart’s timezone.
Bar Check: It examines every bar and checks if the bar’s timestamp falls between the start and end timestamps.
Price Updates:
If a bar’s time is within the specified range, the indicator updates the highest price if the current bar's high exceeds the previously recorded high, and it updates the lowest price if the current bar's low is lower than the previously recorded low.
Drawing Lines:
A red horizontal line is drawn at the highest price, and a green horizontal line is drawn at the lowest price. Both lines start from the first bar in the range and extend dynamically to the current bar, updating as new high or low values are reached.
End of Range: Once a bar's time exceeds the end timestamp, the lines stop updating.
This tool offers a clear and straightforward way to monitor key price levels during a defined period without any extra fluff.

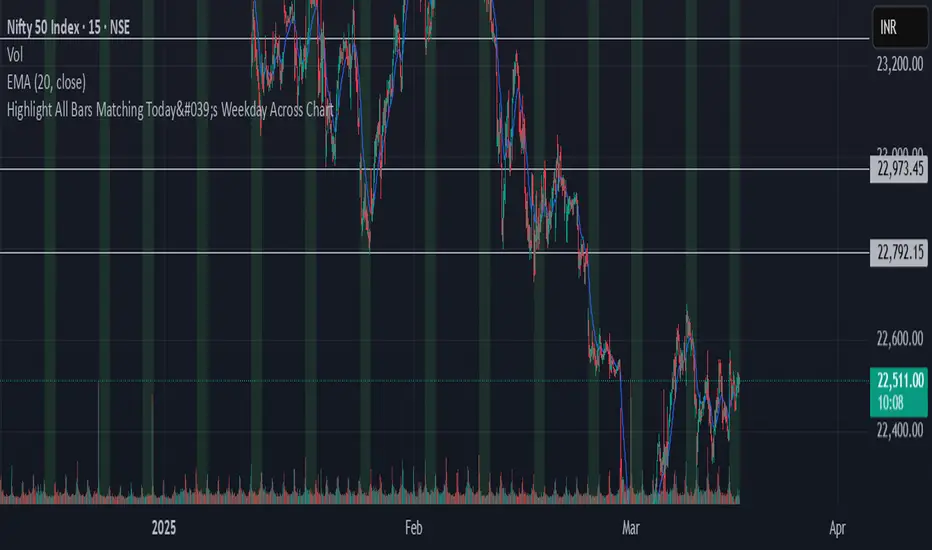
Highlight All Bars Matching Today's Weekday Across ChartThis indicator highlights all bars on the chart that correspond to the same weekday as today. It is designed to help traders identify recurring patterns or behaviors that may appear consistently on specific weekdays.
By visually marking these repeating days, traders can more easily observe potential time-based market tendencies and enhance pattern recognition in their analysis.
Renz-GPT IndicatorThe Renz-GPT Indicator is a powerful, all-in-one trading tool designed to simplify decision-making and improve trade accuracy using a combination of trend, momentum, and volume analysis.
🔍 How It Works
Trend Detection:
Uses two EMAs (Exponential Moving Averages) to identify the current market trend.
A higher timeframe EMA acts as a trend filter to align trades with the larger market trend.
Momentum Confirmation:
RSI (Relative Strength Index) confirms the momentum strength.
Only takes trades when the momentum aligns with the trend.
Volume Confirmation:
Uses On-Balance Volume (OBV) to verify if volume supports the trend direction.
Signal Calculation:
Combines trend, momentum, and volume signals to create a high-probability trade setup.
Filters out weak signals to avoid false trades.
Entry, Stop Loss & Take Profit:
Displays clear LONG and SHORT markers on the chart.
Automatically calculates and displays Stop Loss and Take Profit levels based on ATR (Average True Range).
Alerts:
Sends real-time alerts when a valid buy or sell signal occurs.
Alerts include entry price, stop loss, and take profit levels.

Grease Trap V1.0The Grease Trap V1.0 indicator is a dynamic, Fibonacci-based strategy that calculates unique moving averages to generate trading signals. Below is an overview of its main components and functionality:
How It Works
Fibonacci Grouped Averages:
Dynamic Fibonacci Sequence:
The indicator uses a custom function that dynamically builds a Fibonacci sequence. The user can set the number of Fibonacci elements for two separate calculations:
One for the Indicator Average (default: 9 elements).
One for the Base Average (default: 14 elements).
Grouped Averaging:
Using these Fibonacci numbers, the script groups historical closing prices into segments. For each group (with a length determined by a Fibonacci number), it computes an average. These individual group averages are then averaged together to produce a single dynamic average.
Plotting and Visual Cues:
Two Lines:
The indicator plots two lines on the chart:
Primary Dynamic Fibonacci Grouped Average
Base Dynamic Fibonacci Grouped Average
Color Coding:
The colors of these lines change based on their relationship to the current high price and to each other. For example, if the primary average is above the high or crosses above the base average, it might be shown in green or yellow, whereas certain conditions trigger red, signaling caution.
Crossover Dots:
When the primary average crosses above the base (a bullish signal), a green dot is plotted. Conversely, when it crosses below (a bearish signal), a red dot is displayed. These dots help visually pinpoint the moments of potential trade entry or exit.
Trading Signals and Orders:
Buy Signal:
Triggered when the primary average crosses above the base average. On a buy signal:
If in a short position, it closes that position.
Then, it enters a long position.
Sell Signal:
Triggered when the primary average crosses below the base average. On a sell signal:
If in a long position, it closes that position.
Then, it enters a short position.
Profit Target Management:
The indicator includes automated profit management:
For long positions, it sets an exit order when the price rises by a user-defined percentage (default: 2%).
For short positions, it sets an exit order when the price falls by a similar percentage.
Alerts:
The script is equipped with alert conditions. Traders receive notifications whenever a buy or sell signal is generated, helping them stay on top of potential trading opportunities.
Customization
User Inputs:
Traders can adjust:
The number of Fibonacci elements for each average calculation.
Profit target percentages for both long and short positions.
Data Length Requirement:
The script ensures it uses at least 200 data points (or the total number of available bars, whichever is greater) for a robust calculation of the averages.
In Summary
The Grease Trap V1.0 indicator combines the mathematical elegance of Fibonacci sequences with dynamic grouped averaging. It offers:
Innovative Moving Averages: Based on Fibonacci groupings of historical price data.
Clear Visual Cues: Through color-coded lines and crossover dots.
Automated Trading Actions: With built-in order management and profit targets.
Alert Notifications: So traders are instantly aware of key market signals.
This makes the Grease Trap V1.0 a comprehensive tool for both signal generation and automated strategy execution, suitable for traders looking to integrate Fibonacci principles into their trading systems.

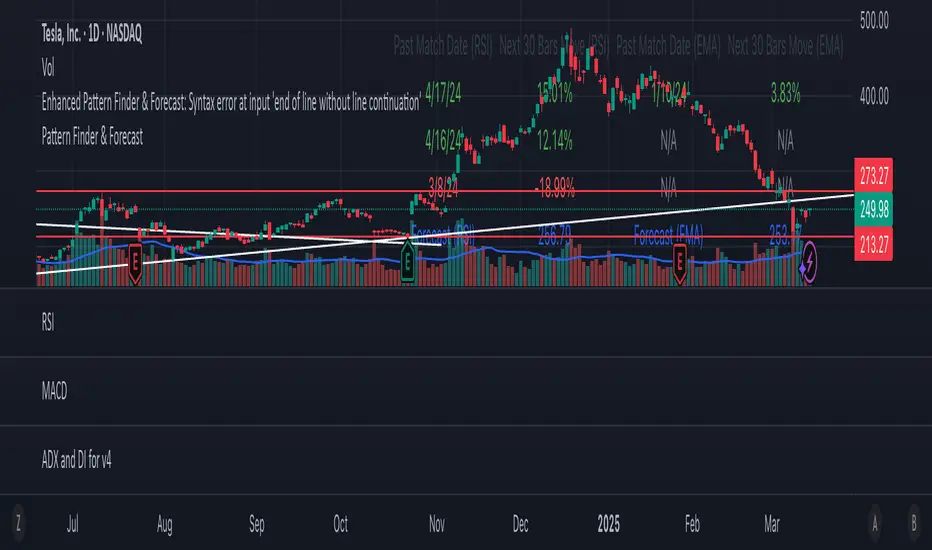
Pattern Finder & ForecastThis script is a pattern-finding and forecasting tool that analyzes historical price data based on EMA (Exponential Moving Averages) and RSI (Relative Strength Index). It identifies past occurrences where the last 30 bars of data resemble the most recent 30 bars and predicts the future price movement based on those past patterns.
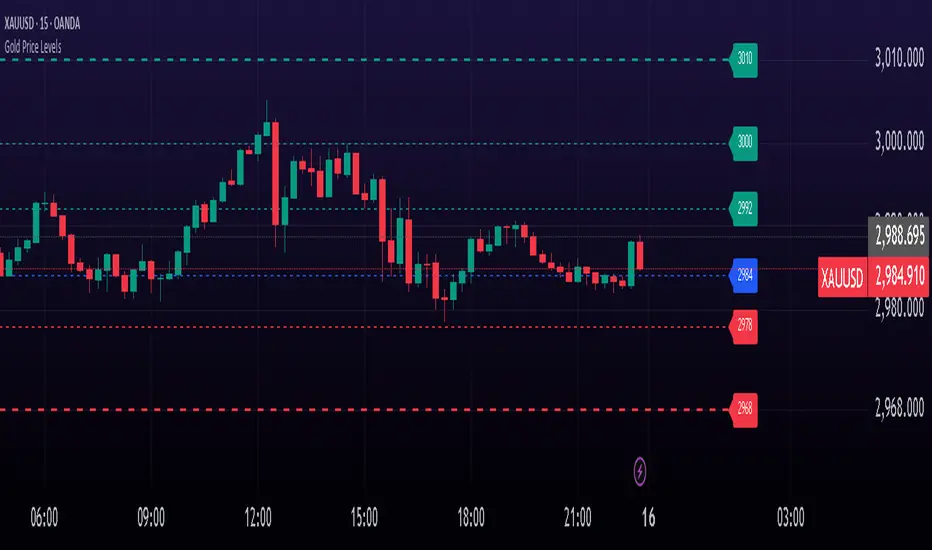
Gold Price LevelsThis indicator identifies and displays key price levels for gold trading. It highlights important psychological and technical price points that often act as support and resistance levels.
Features
Automatically identifies and displays key price levels ending in 92, 84, 78, 55, 42, 27, and 00
Special emphasis on critical levels ending in 68, 32, and 10 with increased line width
Color-coded visualization: green for levels above current price, red for levels below
Customizable line style, width, and label visibility
Automatically adjusts to different price ranges (works with any gold price)
How to Use
This indicator helps gold traders identify potential support and resistance zones. Watch for price reactions at these levels for potential trade entries, exits, or stop placement. The thicker lines (68, 32, 10) often represent more significant price levels where stronger reactions may occur.
Perfect for both day traders and swing traders looking to optimize their gold trading strategy with key price levels.
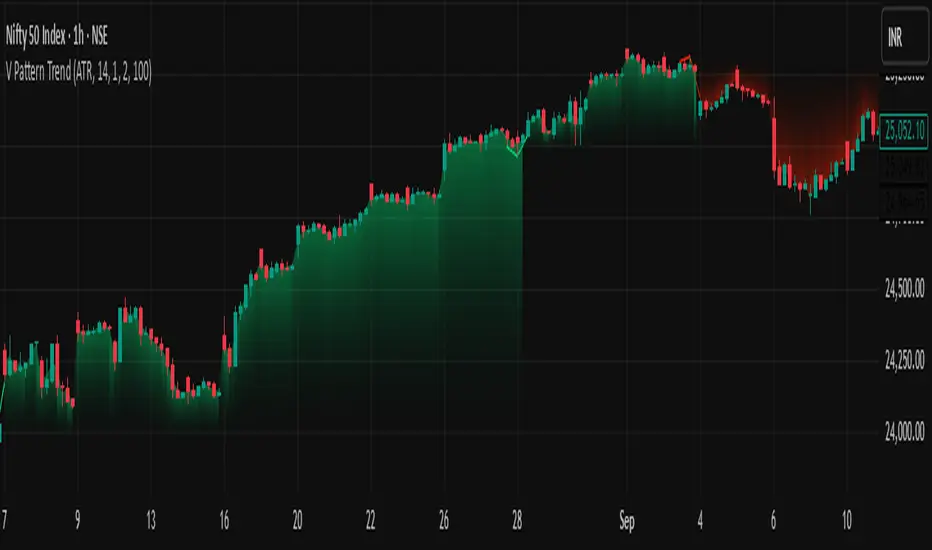
V Pattern TrendDESCRIPTION:
The V Pattern Trend Indicator is designed to identify and highlight V-shaped reversal patterns in price action. It detects both bullish and bearish V formations using a five-candle structure, helping traders recognize potential trend reversal points. The indicator filters out insignificant patterns by using customizable settings based on ATR, percentage, or points, ensuring that only meaningful V patterns are displayed.
CALCULATION METHOD
The user can choose how the minimum length of a V pattern is determined. The available options are:
- ATR (Average True Range) – Filters V patterns based on ATR, making the detection adaptive to market volatility.
- Percentage (%) – Considers V patterns where the absolute price difference between the V low and V high is greater than a user-defined percentage of the V high.
- Points – Uses a fixed number of points to filter valid V patterns, making it useful for assets with consistent price ranges.
ATR SETTINGS
- ATR Length – Defines the number of periods for ATR calculation.
- ATR Multiplier – Determines the minimum V length as a multiple of ATR.
PERCENTAGE THRESHOLD
- Sets a minimum percentage difference between the V high and V low for a pattern to be considered valid.
POINTS THRESHOLD
- Defines the minimum price movement (in points) required for a V pattern to be considered significant.
PATTERN VISUALIZATION
- A bullish V pattern is plotted using two upward-sloping lines, with a filled green region to highlight the formation.
- A bearish V pattern is plotted using two downward-sloping lines, with a filled red region to indicate the reversal.
- The indicator dynamically updates and marks only the most recent valid patterns.
UNDERSTANDING V PATTERNS
A V pattern is a sharp reversal formation where price moves strongly in one direction and then rapidly reverses in the opposite direction, forming a "V" shape on the chart.
BULLISH V PATTERN
- A bullish V pattern is formed when the price makes three consecutive lower lows, followed by two consecutive higher lows.
- The pattern is confirmed when the highest high of the formation is greater than the previous highs within the structure.
- This pattern suggests a potential trend reversal from bearish to bullish.
- The lowest point of the pattern represents the V low, which acts as a support level.
bull_five_candle_v = low > low and low > low and low > low and low > low
and high > math.max(high , high , high ) and high > math.max(high , high , high )
BEARISH V PATTERN
- A bearish V pattern is detected when the price makes three consecutive higher highs, followed by two consecutive lower highs.
- The pattern is confirmed when the lowest low of the formation is lower than the previous lows within the structure.
- This pattern signals a possible trend reversal from bullish to bearish.
- The highest point of the pattern represents the V high, which acts as a resistance level.
bear_five_candle_v = high < high and high < high and high < high and high < high
and low < math.min(low , low , low ) and low < math.min(low , low , low )
HOW THIS IS UNIQUE
- Advanced Filtering Mechanism – Unlike basic reversal indicators, this tool provides customizable filtering based on ATR, percentage, or points, ensuring that only significant V patterns are displayed.
- Enhanced Visual Clarity – The indicator uses color-coded fills and structured plotting to make reversal patterns easy to recognize.
- Works Across Market Conditions – Adaptable to different market environments, filtering out weak or insignificant price fluctuations.
- Multi-Timeframe Usability – Can be applied across different timeframes and asset classes, making it useful for both intraday and swing trading.
HOW TRADERS CAN USE THIS INDICATOR
- Identify potential trend reversals early based on structured price action.
- Filter out weak or insignificant reversals to focus only on strong V formations.
- Use the V pattern’s highs and lows as key support and resistance zones for trade entries and exits.
- Combine with other indicators like moving averages, trendlines, or momentum oscillators for confirmation.
Volume-Price Divergence RSIUnderstanding the Display
Once added, you'll see a new panel below your price chart with:
Purple Line: This is the RSI (Relative Strength Index)
Red Dashed Line: The overbought threshold (default: 70)
Green Dashed Line: The oversold threshold (default: 30)
Blue Columns: Volume histogram
Dark Blue Line: Volume moving average
Trading Signals
Look for these markers on the indicator panel:
Green Triangle (↑): Buy signal - appears when there's a bullish divergence AND RSI conditions are met (oversold and rising)
Red Triangle (↓): Sell signal - appears when there's a bearish divergence AND RSI conditions are met (overbought and falling)
Lime Diamond (◆): Bullish divergence without RSI confirmation
Orange Diamond (◆): Bearish divergence without RSI confirmation
What These Signals Mean
Buy Signal (Green Triangle):
Price is making lower lows BUT volume is making higher lows
RSI is in oversold territory (below 30) and starting to rise
This suggests potential upward reversal
Sell Signal (Red Triangle):
Price is making higher highs BUT volume is making lower highs
RSI is in overbought territory (above 70) and starting to fall
This suggests potential downward reversal
Customizing the Indicator
To adjust settings:
Right-click on the indicator
Select "Settings"
In the "Inputs" tab, you can modify:
RSI Period (default: 14)
Volume MA Period (default: 20)
Lookback Period for finding pivot points (default: 10)
RSI Overbought level (default: 70)
RSI Oversold level (default: 30)
Setting Alerts
To get notified when a signal appears:
Right-click on the indicator
Select "Add Alert"
Choose the condition you want to be alerted for:
Buy Signal
Sell Signal
Bullish Divergence
Bearish Divergence
Configure notification preferences and save
Trading Strategy
This indicator is best used:
On higher timeframes (4H, Daily) for more reliable signals
As confirmation with other indicators or price action
At market extremes where divergences are more meaningful
With proper risk management (stop losses below recent swing lows for buys, above recent swing highs for sells)
Remember that no indicator is 100% accurate. This tool works by identifying situations where price movement isn't confirmed by volume, suggesting a potential reversal, especially when RSI conditions align.
Valerio Diotallevi

Support & Resistance + EMA + Swing SL (3 Min)### **📌 Brief Description of the Script**
This **Pine Script indicator** for TradingView displays **Support & Resistance levels, EMAs (21 & 26), and Swing High/Low-based Stop-Loss (SL) points** on a **3-minute timeframe**.
---
### **🔹 Key Features & Functionality**
1️⃣ **🟥 Support & Resistance Calculation:**
- Finds the **highest & lowest price over the last 50 candles**
- Plots **Resistance (Red) & Support (Green) levels**
2️⃣ **📈 EMA (Exponential Moving Averages):**
- **21 EMA (Blue)** and **26 EMA (Orange)** for trend direction
- Helps in identifying bullish or bearish momentum
3️⃣ **📊 Swing High & Swing Low Detection:**
- Identifies **Swing Highs (Higher than last 5 candles) as SL for Short trades**
- Identifies **Swing Lows (Lower than last 5 candles) as SL for Long trades**
- Plots these levels as **Purple (Swing High SL) & Yellow (Swing Low SL) dotted lines**
4️⃣ **📌 Labels on Swing Points:**
- **"HH SL"** is placed on Swing Highs
- **"LL SL"** is placed on Swing Lows
5️⃣ **⚡ Breakout Detection:**
- Detects if **price crosses above Resistance** (Bullish Breakout)
- Detects if **price crosses below Support** (Bearish Breakout)
- Background color changes to **Green (Bullish)** or **Red (Bearish)**
6️⃣ **🚨 Alerts for Breakouts:**
- Sends alerts when **price breaks above Resistance or below Support**
---
### **🎯 How to Use This Indicator?**
- **Trade with Trend:** Follow **EMA crossovers** and Support/Resistance levels
- **Set Stop-Loss:** Use **Swing High as SL for Shorts** & **Swing Low as SL for Longs**
- **Look for Breakouts:** Enter trades when price **crosses Resistance or Support**
This script is **ideal for scalping & intraday trading** in a **3-minute timeframe** 🚀🔥
Let me know if you need **any modifications or improvements!** 📊💹

Clean OHLC Lines | BaksPlots clean, non-repainting OHLC lines from higher timeframes onto your chart. Ideal for tracking key price levels (open, high, low, close) with precision and minimal clutter.
Core Functionality
Clean OHLC Lines = Historical Levels + Non-Repainting Logic
• Uses lookahead=on to anchor historical lines, ensuring no repainting.
• Displays OHLC lines for customizable timeframes (15min to Monthly).
• Optional candlestick boxes for visual context.
Key Features
• Multi-Timeframe OHLC:
Plot lines from 15min, 30min, 1H, 4H, Daily, Weekly, or Monthly timeframes.
• Non-Repainting Logic:
Historical lines remain static and never recalculate.
• Customizable Styles:
Adjust colors, line widths (1px-4px), and transparency for high/low/open/close lines.
• Candle Display:
Toggle candlestick boxes with bull/bear colors and adjustable borders.
• Past Lines Limit:
Control how many historical lines are displayed (1-500 bars).
User Inputs
• Timeframe:
Select the OHLC timeframe (e.g., "D" for daily).
• # Past Lines:
Limit historical lines to avoid overcrowding (default: 10).
• H/L Mode:
Draw high/low lines from the current or previous period.
• O/C Mode:
Anchor open/close lines to today’s open or yesterday’s close.
• Line Styles:
Customize colors, transparency, and styles (solid/dotted/dashed).
• Candle Display:
Toggle boxes/wicks and adjust bull/bear colors.
Important Notes
⚠️ Alignment:
• Monthly/weekly timeframes use fixed approximations (30d/7d).
• For accuracy, ensure your chart’s timeframe ≤ the selected OHLC timeframe (e.g., use 1H chart for daily lines).
⚠️ Performance:
• Reduce # Past Lines on low-end devices for smoother performance.
Risk Disclaimer
Trading involves risk. OHLC lines reflect historical price levels and do not predict future behavior. Use with other tools and risk management.
Open-Source Notice
This script is open-source under the Mozilla Public License 2.0. Modify or improve it freely, but republishing must follow TradingView’s House Rules.
📈 Happy trading!
