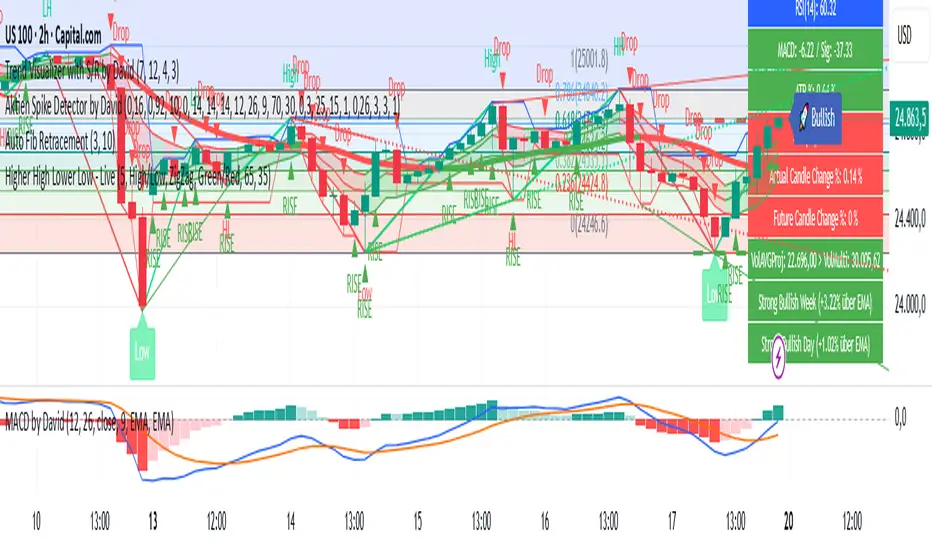
Aktien Spike Detector by DavidDescription:
This indicator marks the daily high and low on the chart and provides a visual and audible alert whenever the current price touches either of these levels. Additionally, the indicator highlights the candlestick that reaches the daily high or low to quickly identify significant market movements or potential reversal points.
Features:
📈 Daily high and low are automatically calculated and displayed as lines on the chart.
🔔 Alert notification when the price touches the daily high or low.
🕯️ Highlighting of the touch candlestick (e.g., color-coded) for better visual orientation.
💡 Ideal for traders trading breakouts, rejections, or intraday reversals.
Areas of application:
Perfect for day traders, scalpers, and intraday analysts who want to see precisely when the market reaches key daily levels.
Chart patterns

Aktien Spike Detector by DavidDescription:
This indicator marks the daily high and low on the chart and provides a visual and audible alert whenever the current price touches either of these levels. Additionally, the indicator highlights the candlestick that reaches the daily high or low to quickly identify significant market movements or potential reversal points.
Features:
📈 Daily high and low are automatically calculated and displayed as lines on the chart.
🔔 Alert notification when the price touches the daily high or low.
🕯️ Highlighting of the touch candlestick (e.g., color-coded) for better visual orientation.
💡 Ideal for traders trading breakouts, rejections, or intraday reversals.
Areas of application:
Perfect for day traders, scalpers, and intraday analysts who want to see precisely when the market reaches key daily levels.
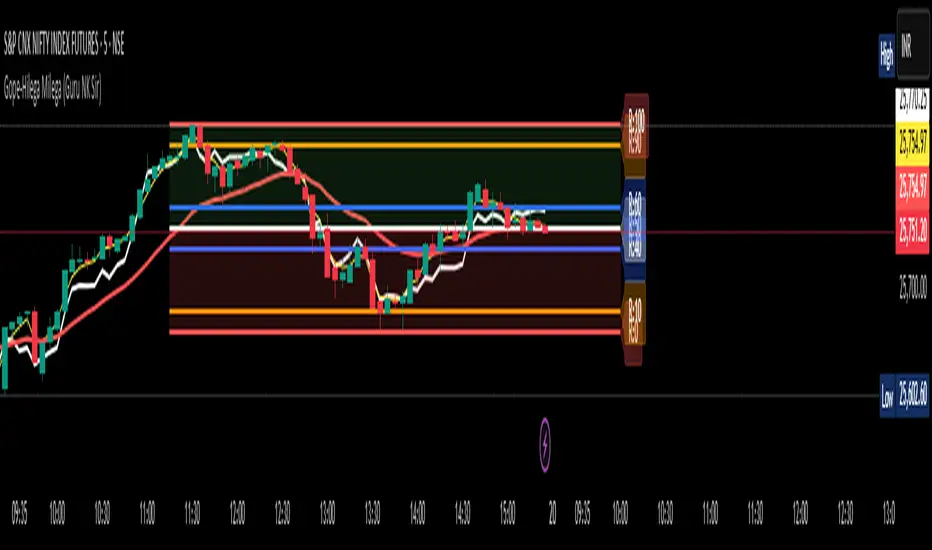
Gope-Hilega Milega (Guru NK Sir)buy above rsi whit line and yellow line sell below rsi whit and yellow line. trend red line(ema-21)
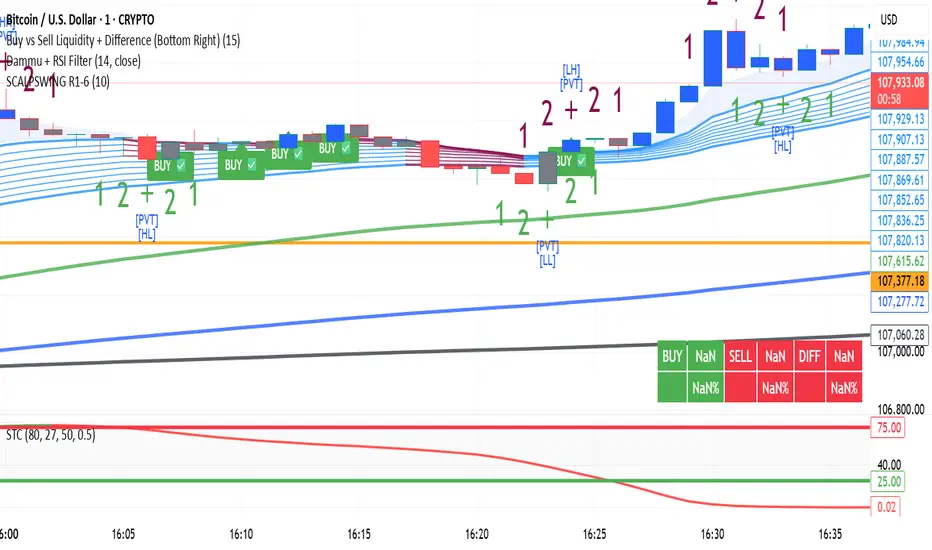
DAMMU SWING TRADING PROScalping and swing trading tool for 15-min and 1-min charts.
Designed for trend, pullback, and reversal analysis.
Works optionally with Heikin Ashi candles.
Indicators Used
EMAs:
EMA89/EMA75 (green)
EMA200/EMA180 (blue)
EMA633/EMA540 (black)
EMA5-12 channel & EMA12-36 ribbon for short-term trends
Price Action Channel (PAC) – EMA high/low/close, length adjustable
Fractals & Pristine Fractals (BW filter)
Higher High (HH), Lower High (LH), Higher Low (HL), Lower Low (LL) detection
Pivot Points – optional, disables fractals automatically
Bar color coding based on PAC:
Blue → Close above PAC
Red → Close below PAC
Gray → Close inside PAC
Trading Signals
PAC swing alerts: arrows or shapes when price exits PAC with optional 200 EMA filter.
RSI 14 signals (if added):
≥50 → BUY
<50 → SELL
Chart Setup
Two panes: 15-min (trend anchor) + 1-min (entry)
Optional Heikin Ashi candles
Use Sweetspot Gold2 for support/resistance “00” and “0” lines
Trendlines can be drawn using HH/LL or Pivot points
Usage Notes
Trade long only if price above EMA200; short only if below EMA200
Pullback into EMA channels/ribbons signals potential continuation
Fractals or pivot points help define trend reversals
PAC + EMA36 used for strong momentum confirmation
Alerts
Up/Down PAC exit alerts configurable with big arrows or labels
RSI labels show buy/sell zones (optional)
Works on both 15-min and 1-min timeframes
If you want, I can make an even shorter “super cheat-sheet” version for 1-page quick reference for trading. It will list only inputs, signals, and colors.

HA Reversal + Doji 🔥 Heikin Ashi Reversal + Stochastic Filter (Precision Entry System)
This indicator is designed to detect high–quality reversal entries using a Heikin Ashi candle pattern (Doji + 2 no–wick confirmation) combined with a strict Stochastic filter that uses memory of extreme touches to control trade direction.
✅ Entry Logic
🔹 Bullish BUY Signal
A BUY is triggered only when:
A valid reversal pattern is detected:
Doji candle (pivot) 3 bars back
Followed by 2 bullish candles with no lower wicks
Stochastic touched Oversold (≤ 20) at least once before the signal
Pattern + Stoch alignment = BUY
🔹 Bearish SELL Signal
A SELL is triggered only when:
Valid bearish reversal pattern:
Doji candle (pivot) 3 bars back
Followed by 2 bearish candles with no upper wicks
Stochastic touched Overbought (≥ 80) before the signal
Pattern + Stoch alignment = SELL
🧠 Stochastic “Memory” Filter
This is not a basic OB/OS filter — it uses event memory:
If Stochastic touches Oversold, the system becomes ready for BUY
If it touches Overbought, it becomes ready for SELL
Both directions can be armed at once
Once a BUY or SELL actually triggers, memory resets to neutral
Prevents “signal spam” during chop and keeps direction meaningful
🎯 Why This Works
✔ Filters out random countertrend noise
✔ Only trades after momentum exhaustion
✔ Uses strict Heikin Ashi reversal structure
✔ Works great across crypto, forex, indices, metals
✔ Designed for precision entries and swing continuation traps
⚙️ Customizable Options
Doji detection mode (body % / ticks / hybrid)
Wick tolerance
Heikin Ashi source (chart or calculated)
Stochastic source (raw or smoothed)
Option to avoid duplicate same-direction signals
Visual aids: pattern markers, blocked signals, doji debugging
📌 Best Use Cases
Reversal scalping on 5m/15m
Swing entries on 1H/4H
Trend exhaustion confirmation
Smart Money Concepts entry refinement
Entry timing after liquidity sweeps
🚨 Important
This is not a repainting system. Signals are generated at bar close only. Always combine with proper risk management and market context.
Let me know if you want:
✅ A shorter description
✅ An SEO optimized TradingView title
✅ A strategy version with backtesting
✅ Alerts version for automation

5/15-Min-ORB-Trend-Finder-WiPIndicator Features:
> "Open" flag for each market day.
> Toggleable 5-min and 15-min High/Low markings.
> Horizontal support (red) and resistance (blue) lines.
> EMA-based trend line: green for long/buy, purple for short/sell.
> Recommended to use with my other indicator: Buy-or-Sell-WiP.
Strategy:
> Use with 1-min chart with 5-min High/Low or 5-min chart with 15-min High/Low
> After a breakout, wait for confirmation before placing a trade, which is:
- Two confirming candles (green for long/buy, red for short/sell)
and
- Buy-or-Sell-WiP histogram: green for long/buy, red for short/sell

EMA 9 + VWAP Lower Band Buy SignalEMA 9 + VWAP Lower Band Buy Signal. It uses Ema 9 and VWAP lower band. Has buy alerts

MACD + Supertrend + DEMA StrategySTRATEGY 📊 STRATEGY LOGIC:
Long Entry: When ALL of these occur simultaneously:
MACD histogram crosses above 0
Supertrend is bullish (green)
Short DEMA > Long DEMA
Short Entry: When ALL of these occur simultaneously:
MACD histogram crosses below 0
Supertrend is bearish (red)
Short DEMA < Long DEMA
Exits: Based on your TP/SL percentages from entry price
This follows the same clean structure as your MACD strategy but adds the alignment concept and proper risk management!

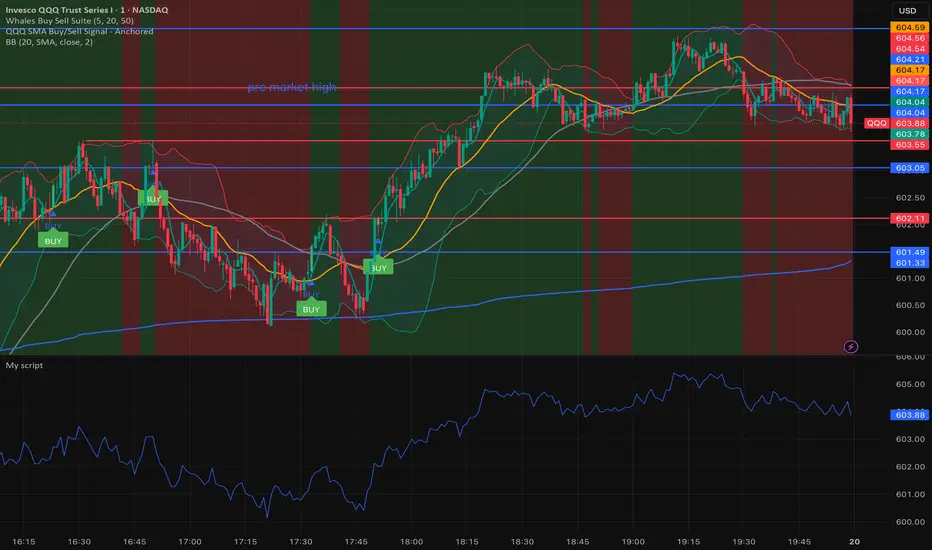
Whales buy & sell🐋 Whales on Wall Street — Buy & Sell Signal Indicator
The Whales on Wall Street Signal Indicator is a precision-built trading tool designed to simplify your decision-making and give you real-time clarity in the market.
It automatically identifies high-probability reversal zones, momentum shifts, and trend confirmations — marking exact Buy (green) and Sell (red) signals based on price action, volume confirmation, and momentum strength.
Built for day traders and scalpers, this indicator eliminates the guesswork by combining multiple technical confluences such as:
EMA & RSI alignment for trend direction
Smart volume spikes for institutional activity
Volatility filters to reduce false signals
Dynamic alerts for entries and exits in real time
Whether you’re trading SPY, QQQ, NVDA, or Tesla, this indicator adapts to any ticker and timeframe — giving you crystal-clear entries, cleaner exits, and the confidence to trade like a whale.
DAMMU Swing Trading PRODammu Scalping Pro – Short Notes
1️⃣ Purpose:
Scalping and swing trading tool for 15-min and 1-min charts.
Designed for trend continuation, pullbacks, and reversals.
Works well with Heikin Ashi candles (optional).
2️⃣ Core Components:
EMAs:
Fast: EMA5-12
Medium: EMA12-36 Ribbon
Long: EMA75/89 (1-min), EMA180/200 (15-min), EMA540/633
Price Action Channel (PAC): EMA-based High, Low, Close channel.
Fractals: Regular & filtered (BW) fractals for swing recognition.
Higher Highs / Lower Highs / Higher Lows / Lower Lows (HH, LH, HL, LL).
Pivot Points: Optional display with labels.
3️⃣ Bar Coloring:
Blue: Close above PAC
Red: Close below PAC
Gray: Close inside PAC
4️⃣ Alerts:
Swing Buy/Sell arrows based on PAC breakout and EMA200 filter.
Optional “Big Arrows” mode for visibility.
Alert messages: "SWING_UP" and "SWING_DN"
5️⃣ Workflow / Usage Tips:
Set chart to 15-min (for trend) + 1-min (for entry).
Optionally enable Heikin Ashi candles.
Trade long only above EMA200, short only below EMA200.
Watch for pullbacks into EMA channels or ribbons.
Confirm trend resumption via PAC breakout & bar color change.
Use fractals and pivot points to draw trendlines and locate support/resistance.
6️⃣ Optional Filters:
Filter PAC signals with 200 EMA.
Filter fractals for “Pristine/Ideal” patterns (BW filter).
7️⃣ Visuals:
EMA ribbons, PAC fill, HH/LL squares, fractal triangles.
Pivot labels & candle numbering for patterns.
8️⃣ Notes:
No extra indicators needed except optionally SweetSpot Gold2 for major S/R levels.
Suitable for scalping pullbacks with trend confirmation.
If you want, I can make an even shorter “one-screen cheat sheet” with colors, alerts, and EMAs, perfect for real-time chart reference.
Do you want me to do that?

DAMMU Swing Trading PRODammu Scalping Pro – Short Notes
1️⃣ Purpose:
Scalping and swing trading tool for 15-min and 1-min charts.
Designed for trend continuation, pullbacks, and reversals.
Works well with Heikin Ashi candles (optional).
2️⃣ Core Components:
EMAs:
Fast: EMA5-12
Medium: EMA12-36 Ribbon
Long: EMA75/89 (1-min), EMA180/200 (15-min), EMA540/633
Price Action Channel (PAC): EMA-based High, Low, Close channel.
Fractals: Regular & filtered (BW) fractals for swing recognition.
Higher Highs / Lower Highs / Higher Lows / Lower Lows (HH, LH, HL, LL).
Pivot Points: Optional display with labels.
3️⃣ Bar Coloring:
Blue: Close above PAC
Red: Close below PAC
Gray: Close inside PAC
4️⃣ Alerts:
Swing Buy/Sell arrows based on PAC breakout and EMA200 filter.
Optional “Big Arrows” mode for visibility.
Alert messages: "SWING_UP" and "SWING_DN"
5️⃣ Workflow / Usage Tips:
Set chart to 15-min (for trend) + 1-min (for entry).
Optionally enable Heikin Ashi candles.
Trade long only above EMA200, short only below EMA200.
Watch for pullbacks into EMA channels or ribbons.
Confirm trend resumption via PAC breakout & bar color change.
Use fractals and pivot points to draw trendlines and locate support/resistance.
6️⃣ Optional Filters:
Filter PAC signals with 200 EMA.
Filter fractals for “Pristine/Ideal” patterns (BW filter).
7️⃣ Visuals:
EMA ribbons, PAC fill, HH/LL squares, fractal triangles.
Pivot labels & candle numbering for patterns.
8️⃣ Notes:
No extra indicators needed except optionally SweetSpot Gold2 for major S/R levels.
Suitable for scalping pullbacks with trend confirmation.
If you want, I can make an even shorter “one-screen cheat sheet” with colors, alerts, and EMAs, perfect for real-time charT
Dammu AI ADVANCED PRO1. Indicator Overview
Name: Dammu
Type: Overlay indicator (draws on price chart)
Purpose: Combines SuperTrend, SMA/EMA trends, Swing/Structure analysis, Order Blocks, Fair Value Gaps, High/Low levels, TP/SL labels, and alerts.
Pine Script Version: v5
2. SuperTrend Module
Computes SuperTrend line using ATR and sensitivity.
Signals:
Bullish: Price crosses above SuperTrend.
Bearish: Price crosses below SuperTrend.
Plots buy/sell labels 🚀🐻 based on SMA comparison and SuperTrend cross.
3. SMA/EMA Trend Components
SMA8 & SMA9: Used for additional trend confirmation.
EMA lines: Multiple EMAs with different multipliers for trend detection.
Trend Cloud: Uses Hull MA for trend smoothing.
4. Risk Management
TP/SL Levels: Automatic calculation of stop-loss and take-profit (TP1, TP2, TP3).
Configurable ATR-based risk percentage.
Lines and labels drawn for visual TP/SL.
5. Chart Features
Smooth Range Filter: Filters noise for trend detection.
Colored Trend Cloud: Upward trend = cyan, downward = red.
Sideways Market: ADX filter to color bars purple if trend is weak/sideways.
Bar Colors: Green/red based on SuperTrend signals.
6. Swing & Structure Analysis
Detects Swing Highs/Lows, labels as HH, LH, LL, HL.
Detects CHoCH (Change of Character) or BOS (Break of Structure).
Can show internal or swing structures with configurable label size and color.
7. Order Blocks (Smart Money Concepts)
Detects Internal Order Blocks (iOB) and Swing Order Blocks (OB).
Stores top/bottom/left/time/type in arrays.
Colors and shows boxes based on bullish/bearish type.
Automatically deletes OB if price breaks the block.
8. Fair Value Gaps (FVG)
Identifies gaps between candles as potential trading zones.
Configurable bullish/bearish colors and extension bars.
9. EQH/EQL (Equal Highs/Lows)
Detects equal highs/lows using a threshold.
Plots dotted lines and labels EQH/EQL.
10. High/Low Levels MTF
Optional plotting of previous daily, weekly, monthly highs/lows.
11. Premium/Discount Zones
Plots Premium, Discount, and Equilibrium Zones.
Colors: Premium = red, Discount = green, Equilibrium = gray.
12. Alerts
Buy/Sell alerts for:
SuperTrend crossover
BOS/CHoCH (swing/internal)
EQH/EQL triggers
13. Miscellaneous
Configurable visuals: line style, label size, transparency.
Adjustable volatility filters, ATR lengths, smoothing constants.
Integrated risk & reward visualization.
✅ In short:
This is an all-in-one Smart Money + Trend indicator with SuperTrend signals, swing/structure detection, order blocks, FVGs, EQH/EQL, TP/SL visualization, and optional alerts. It’s designed for both trend-following and order-block-based trading.
If you want, I can make a super-short 1-paragraph version that summarizes it even faster for quick reference.

TradeVision Pro - Multi-Factor Analysis System═══════════════════════════════════════════════════════════════════
TRADEVISION PRO - MULTI-FACTOR ANALYSIS SYSTEM
Created by Zakaria Safri
═══════════════════════════════════════════════════════════════════
A comprehensive technical analysis tool combining multiple factors for
signal generation, trend analysis, and dynamic risk management visualization.
Designed for educational purposes to study multi-factor convergence trading
strategies across all markets and timeframes.
⚠️ IMPORTANT DISCLAIMER:
This indicator is provided for EDUCATIONAL and INFORMATIONAL purposes only.
It does NOT constitute financial advice, investment advice, or trading advice.
Past performance does not guarantee future results. Trading involves
substantial risk of loss. Always do your own research and consult a
financial advisor before making trading decisions.
🎯 KEY FEATURES
═══════════════════════════════════════════════════════════════════
✅ MULTI-FACTOR SIGNAL GENERATION
• Price Volume Trend (PVT) analysis
• Rate of Change (ROC) momentum confirmation
• Volume-Weighted Moving Average (VWMA) trend filter
• Simple Moving Average (SMA) price smoothing
• Signals only when all factors align
✅ DYNAMIC RISK VISUALIZATION (Educational Only)
• ATR-based stop loss calculation
• Risk-reward based take profit levels (1-5 targets)
• Visual lines and labels showing entry, SL, and TPs
• Automatically adapts to market volatility
• ⚠️ VISUAL REFERENCE ONLY - Does not execute trades
✅ SUPPORT & RESISTANCE DETECTION
• Automatic pivot-based level identification
• Red dashed lines for resistance zones
• Green dashed lines for support areas
• Helps identify key price levels
✅ VWMA TREND BANDS
• Volume-weighted moving average with standard deviation
• Color-changing bands (Green = Uptrend, Red = Downtrend)
• Filled band area for easy visualization
• Volume-confirmed trend strength
✅ TREND DETECTION SYSTEM
• Counting-based trend confirmation
• Three states: Up Trend, Down Trend, Ranging
• Requires threshold of consecutive bars
• Independent trend validation
✅ PRICE RANGE VISUALIZATION
• High/Low range lines showing market structure
• Filled area highlighting price volatility
• Helps identify breakout zones
✅ COMPREHENSIVE INFO TABLE
• Real-time trend status
• Last signal type (BUY/SELL)
• Entry price display
• Stop loss level
• All active take profit levels
• Clean, professional layout
✅ OPTIONAL FEATURES
• Bar coloring by trend direction
• Customizable alert notifications
• Toggle visibility for all components
• Fully configurable parameters
📊 HOW IT WORKS
═══════════════════════════════════════════════════════════════════
SIGNAL METHODOLOGY:
BUY SIGNAL generates when ALL conditions are met:
• Smoothed price > Moving Average (upward price trend)
• PVT > PVT Average (volume supporting uptrend)
• ROC > 0 (positive momentum)
• Close > VWMA (above volume-weighted average)
SELL SIGNAL generates when ALL conditions are met:
• Smoothed price < Moving Average (downward price trend)
• PVT < PVT Average (volume supporting downtrend)
• ROC < 0 (negative momentum)
• Close < VWMA (below volume-weighted average)
This multi-factor approach filters out weak signals and waits for
strong convergence before generating alerts.
RISK CALCULATION:
Stop Loss = Entry ± (ATR × SL Multiplier)
• Uses Average True Range for volatility measurement
• Automatically adjusts to market conditions
Take Profit Levels = Entry ± (Risk Distance × TP Multiplier × Level)
• Risk Distance = |Entry - Stop Loss|
• Creates risk-reward based targets
• Example: TP Multiplier 1.0 = 1:1, 2:2, 3:3 risk-reward
⚠️ NOTE: All risk levels are VISUAL REFERENCES for educational study.
They do not execute trades automatically.
⚙️ SETTINGS GUIDE
═══════════════════════════════════════════════════════════════════
SIGNAL SETTINGS:
• Signal Length (14): Main calculation period for averages
• Smooth Length (8): Price data smoothing period
• PVT Length (14): Price Volume Trend calculation period
• ROC Length (9): Rate of Change momentum period
RISK MANAGEMENT (Visual Only):
• ATR Length (14): Volatility measurement lookback
• SL Multiplier (2.2): Stop loss distance (× ATR)
• TP Multiplier (1.0): Risk-reward ratio per TP level
• TP Levels (1-5): Number of take profit targets to display
• Show TP/SL Lines: Toggle visual reference lines
SUPPORT & RESISTANCE:
• Pivot Lookback (10): Sensitivity for S/R detection
• Show SR: Toggle support/resistance lines
VWMA BANDS:
• VWMA Length (20): Volume-weighted average period
• Show Bands: Toggle band visibility
TREND DETECTION:
• Trend Threshold (5): Consecutive bars required for trend
PRICE LINES:
• Period (20): High/low calculation lookback
• Show: Toggle price range visualization
DISPLAY OPTIONS:
• Signals: Show/hide BUY/SELL labels
• Table: Show/hide information panel
• Color Bars: Enable trend-based bar coloring
ALERTS:
• Enable: Activate alert notifications for signals
💡 USAGE INSTRUCTIONS
═══════════════════════════════════════════════════════════════════
RECOMMENDED APPROACH:
• Works on all timeframes (1m to Monthly)
• Suitable for all markets (Stocks, Forex, Crypto, etc.)
• Best used with additional analysis and confirmation
• Always practice proper risk management
ENTRY STRATEGY:
1. Wait for BUY or SELL signal to appear
2. Check trend table for trend confirmation
3. Verify VWMA band color matches signal direction
4. Look for nearby support/resistance confluence
5. Consider entering on next candle open
6. Use visual SL level for risk management
EXIT STRATEGY:
1. Use TP levels as potential exit zones
2. Consider scaling out at multiple TP levels
3. Exit on opposite signal
4. Adjust stops as trade progresses
5. Account for spread and slippage
TREND TRADING:
• "Up Trend" → Focus on BUY signals
• "Down Trend" → Focus on SELL signals
• "Ranging" → Wait for clear trend or use range strategies
🎨 VISUAL ELEMENTS
═══════════════════════════════════════════════════════════════════
• GREEN VWMA BANDS → Bullish trend indication
• RED VWMA BANDS → Bearish trend indication
• ORANGE DASHED LINE → Entry price reference
• RED SOLID LINE → Stop loss level
• GREEN DOTTED LINES → Take profit targets
• RED DASHED LINES → Resistance levels
• GREEN DASHED LINES → Support levels
• GREY FILLED AREA → Price high/low range
• GREEN BUY LABEL → Long signal
• RED SELL LABEL → Short signal
• BLUE INFO TABLE → Current trade details
• GREEN/RED BARS → Trend direction (optional)
⚠️ IMPORTANT NOTES
═══════════════════════════════════════════════════════════════════
RISK WARNING:
• Trading involves substantial risk of loss
• You can lose more than your initial investment
• Past performance does not guarantee future results
• No indicator is 100% accurate
• Always use proper position sizing
• Never risk more than you can afford to lose
EDUCATIONAL PURPOSE:
• This tool is for learning and research
• Not a complete trading system
• Should be combined with other analysis
• Requires interpretation and context
• Test thoroughly before live use
• Consider consulting a financial advisor
TECHNICAL LIMITATIONS:
• Signals lag price action (all indicators lag)
• False signals occur in choppy markets
• Works better in trending conditions
• Support/resistance levels are approximate
• TP/SL levels are suggestions, not guarantees
📚 METHODOLOGY
═══════════════════════════════════════════════════════════════════
This indicator combines established technical analysis concepts:
• Price Volume Trend (PVT): Volume-weighted price momentum
• Rate of Change (ROC): Momentum measurement
• Volume-Weighted Moving Average (VWMA): Trend identification
• Average True Range (ATR): Volatility measurement (J. Welles Wilder)
• Pivot Points: Support/resistance detection
All methods are based on publicly available technical analysis
principles. No proprietary or "secret" algorithms are used.
⚖️ FULL DISCLAIMER
═══════════════════════════════════════════════════════════════════
LIABILITY:
The creator (Zakaria Safri) assumes NO liability for:
• Trading losses or damages of any kind
• Loss of capital or profits
• Incorrect signal interpretation
• Technical issues, bugs, or errors
• Any consequences of using this tool
USER RESPONSIBILITY:
By using this indicator, you acknowledge that:
• You are solely responsible for your trading decisions
• You understand the substantial risks involved
• You will not hold the creator liable for losses
• You will conduct your own research and analysis
• You may consult a licensed financial professional
• You are using this tool entirely at your own risk
AS-IS PROVISION:
This indicator is provided "AS IS" without warranty of any kind,
express or implied, including but not limited to warranties of
merchantability, fitness for a particular purpose, or non-infringement.
The creator is not a registered investment advisor, financial planner,
or broker-dealer. This tool is not approved or endorsed by any
financial authority.
📞 ABOUT THE CREATOR
═══════════════════════════════════════════════════════════════════
Created by: Zakaria Safri
Specialization: Technical analysis indicator development
Focus: Multi-factor analysis, risk visualization, trend detection
This is an educational tool designed to demonstrate technical
analysis concepts and multi-factor signal generation methods.
📋 VERSION INFO
═══════════════════════════════════════════════════════════════════
Version: 1.0
Platform: TradingView Pine Script v5
License: Mozilla Public License 2.0
Creator: Zakaria Safri
Year: 2024
═══════════════════════════════════════════════════════════════════
Study Carefully, Trade Wisely, Manage Risk Properly
TradeVision Pro - Educational Trading Tool
Created by Zakaria Safri
═══════════════════════════════════════════════════════════════════

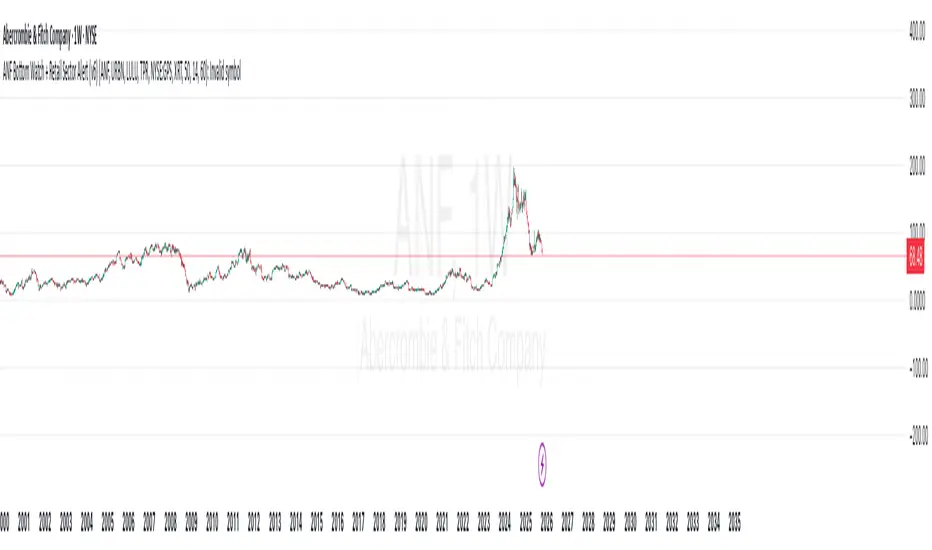
ANF Bottom Watch + Retail Sector Alert (v6) Detect when ANF crosses above its 50-day moving average (technical recovery signal).
Show visual + alert when RSI recovers above 40 (momentum bottom confirmation).
Track peer strength (URBN, LULU, TPR, GPS) — if 3+ peers are trading above their own 50-day MA, the script flags a sector rotation (bullish context).
Give a “Bottom Watch Active” label when all three signals align.
Elliott Wave (𝐒𝐓𝐄𝐄𝐋 𝐂𝐈𝐓𝐘 𝐂𝐑𝐄𝐀𝐓𝐎𝐑𝐒)This indicator provides a rules-based helper for visually identifying potential Elliott Wave patterns — including 1–5 impulse structures and optional A–B–C corrective moves. It automatically detects pivot highs/lows using the user-defined left/right swing settings and connects them with a ZigZag line filtered by either ATR or percentage change to reduce market noise.
When a valid 5-wave impulse structure is found (either bullish or bearish), the indicator labels waves 1–5 on the chart. After completion of the fifth wave, it optionally monitors for an A–B–C corrective pattern and labels those points when detected. Alerts are generated when an impulse or correction is confirmed.
Features
✅ Automatic pivot detection using configurable left/right swing bars.
✅ ATR or %-based swing filter to avoid small fluctuations.
✅ ZigZag plotting to visualize price structure.
✅ Automatic labeling of potential Elliott impulse waves (1–5).
✅ Optional A–B–C correction detection after wave 5.
✅ Alerts when impulses and corrections complete.
✅ Customizable visuals (colors, sensitivity, pivot length).
✅ Works on all symbols and timeframes.
Usage Tips
For best results, use larger timeframes (e.g., 1H–1D) where Elliott structures are cleaner.
Adjust Pivot Left/Right and ATR Multiplier for your chart’s volatility.
Remember: Elliott Wave theory is interpretive — this tool provides objective swing logic to assist manual analysis, not a guaranteed automatic wave count.

Dammu AI PROType & Purpose
Multi-functional trend, swing, and smart money concept indicator.
Combines SuperTrend, SMA, ATR-based risk management, swing structures, order blocks, EQH/EQL, and Fair Value Gaps (FVG).
Designed for identifying trends, entries/exits, and support/resistance zones.
2. Trend Detection
SuperTrend with ATR smoothing (nsensitivity*7 factor) for buy/sell signals.
SMA filter (8 & 9 periods) confirms trend strength.
Bar color changes:
Green if close > supertrend.
Red if close < supertrend.
Cirrus Cloud highlights trend zones with semi-transparent colors.
3. Swing & Structure
Detects pivot highs/lows and labels them as HH/LH (Highs), HL/LL (Lows).
Generates BOS (Break of Structure) and CHoCH (Change of Character) signals.
Internal swing structures and order blocks for short-term intraday moves.
4. Order Blocks
Internal Order Blocks (iOBs) and Swing Order Blocks (OBs).
Boxes drawn for bullish/bearish zones.
Auto-delete when broken.
Option to filter blocks by ATR or Cumulative Mean Range.
5. Risk Management
TP/SL levels based on ATR and user-defined % risk.
Shows lines and labels for:
Entry
Stop Loss
TP1, TP2, TP3
Adjustable line style (solid/dashed/dotted).
6. Fair Value Gaps (FVG)
Highlights bullish and bearish gaps.
Option for auto-threshold filtering.
Extendable FVG boxes.
7. EQH/EQL
Detects Equal Highs (EQH) and Equal Lows (EQL) for potential reversals.
Dotted lines with labels.
8. Smart Money Concepts (SMC) Features
Shows:
Swings (internal & swing structure)
Internal order blocks
Premium/Discount zones
Fair Value Gaps
Highs/Lows from previous day/week/month
Configurable for historical vs present display.
9. Alerts
Buy/Sell triggers:
bull = crossover of close above SuperTrend.
bear = crossunder of close below SuperTrend.
Alerts for BOS/CHoCH, EQH/EQL, and OB breaks.
10. Visualization
Trend clouds, colored bars, SMA markers, SuperTrend labels.
Multi-layered info displayed without cluttering the chart.
Customizable colors, line styles, and transparency.
✅ Summary:
This indicator is a comprehensive trading tool for trend detection, swing structure, order block analysis, and risk management. It’s built for smart money and SMC-based trading, offering visual cues and alerts for key trading decisions.

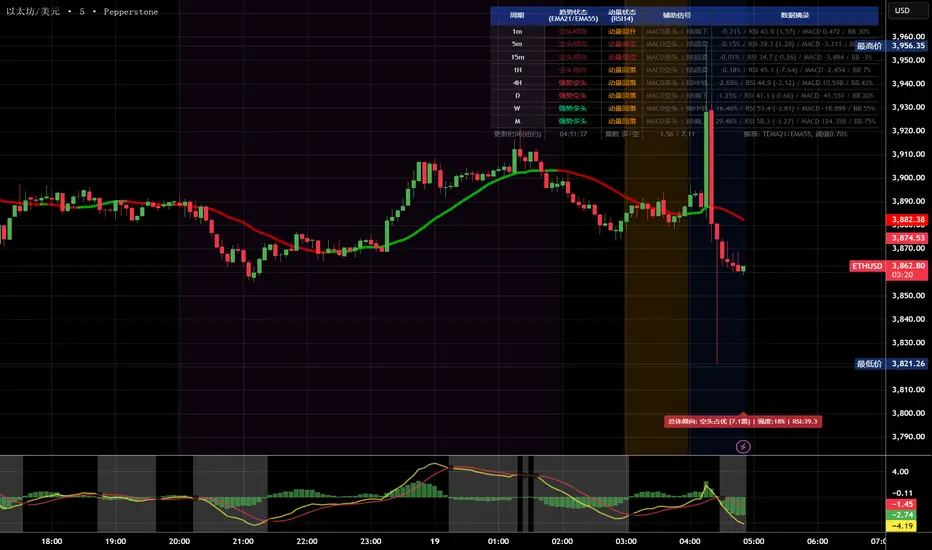
多周期趋势动量面板加强版(Multi-Timeframe Trend Momentum Panel - User Guide)多周期趋势动量面板(Multi-Timeframe Trend Momentum Panel - User Guide)(english explanation follows.)
📖 指标功能详解 (精简版):
🎯 核心功能:
1. 多周期趋势分析 同时监控8个时间周期(1m/5m/15m/1H/4H/D/W/M)
2. 4维度投票系统 MA趋势+RSI动量+MACD+布林带综合判断
3. 全球交易时段 可视化亚洲/伦敦/纽约交易时间
4. 趋势强度评分 0100%量化市场力量
5. 智能警报 强势多空信号自动推送
________________________________________
📚 重要名词解释:
🔵 趋势状态 (MA均线分析):
名词 含义 信号强度
强势多头 快MA远高于慢MA(差值≥0.35%) ⭐⭐⭐⭐⭐ 做多
多头倾向 快MA略高于慢MA(差值<0.35%) ⭐⭐⭐ 谨慎做多
震荡 快慢MA缠绕,无明确方向 ⚠️ 观望
空头倾向 快MA略低于慢MA ⭐⭐⭐ 谨慎做空
强势空头 快MA远低于慢MA ⭐⭐⭐⭐⭐ 做空
简单理解: 快MA就像短跑运动员(反应快),慢MA是长跑运动员(稳定)。短跑远超长跑=强势多头,反之=强势空头。
________________________________________
🟠 动量状态 (RSI力度分析):
名词 含义 操作建议
动量上攻↗ RSI>60且快速上升 强烈买入信号
动量高位 RSI>60但上升变慢 警惕回调,可减仓
动量中性 RSI在4060之间,平稳 等待方向明确
动量低位 RSI<40但下跌变慢 警惕反弹,可止盈
动量下压↘ RSI<40且快速下降 强烈卖出信号
简单理解: RSI就像汽车速度表。"动量上攻"=油门踩到底加速,"动量高位"=已经很快但不再加速了。
________________________________________
🟣 辅助信号:
MACD:
• MACD多头 = 柱状图>0 = 买方力量强
• MACD空头 = 柱状图<0 = 卖方力量强
布林带(BB):
• BB超买 = 价格在布林带上轨附近 = 可能回调
• BB超卖 = 价格在布林带下轨附近 = 可能反弹
• BB中轨 = 价格在中间位置 = 平衡状态
________________________________________
💡 快速上手 3步看懂面板:
第1步: 看"综合结论标签" (K线上方)
• 绿色"多头占优" → 可以做多
• 红色"空头占优" → 可以做空
• 橙色"震荡/均衡" → 观望
第2步: 看"票数 多/空" (面板最下方)
• 多头票数远大于空头 (差距>2) → 趋势强
• 票数接近 (差距<1) → 震荡市
第3步: 看"趋势强度" (综合标签中)
• 强度>70% → 强势趋势,可重仓
• 强度5070% → 中等趋势,正常仓位
• 强度<50% → 弱势,轻仓或观望
________________________________________
🎨 时段背景色含义:
• 紫色背景 = 亚洲时段 (东京交易时间) 波动较小
• 橙色背景 = 伦敦时段 (欧洲交易时间) 波动增大
• 蓝色背景 = 纽约凌晨 美盘准备阶段
• 红色背景 = 纽约关键5分钟 (09:3009:35) ⚠️ 最重要! 市场最活跃,趋势易形成
• 绿色背景 = 纽约上午后段 延续早盘趋势
交易建议: 重点关注红色关键时段,这5分钟往往决定全天方向!
________________________________________
⚙️ 三大市场推荐设置
🥇 黄金: Hull MA 12/EMA 34, 阈值0.250.35%
₿ 比特币: EMA 21/EMA 55, 阈值0.801.20%
💎 以太坊: TEMA 21/EMA 55, 阈值0.600.80%
参数优化建议
黄金 (XAUUSD)
快速MA: Hull MA 12 (超灵敏捕捉黄金快速波动)
慢速MA: EMA 34 (斐波那契数列)
RSI周期: 9 (加快反应)
强趋势阈值: 0.25%
周期: 5, 15, 60, 240, 1440
比特币 (BTCUSD)
快速MA: EMA 21
慢速MA: EMA 55
RSI周期: 14
强趋势阈值: 0.8% (波动大,阈值需提高)
周期: 15, 60, 240, D, W
外汇 EUR/USD
快速MA: TEMA 10 (快速响应)
慢速MA: T3 30, 因子0.7 (平滑噪音)
RSI周期: 14
强趋势阈值: 0.08% (外汇波动小)
周期: 5, 15, 60, 240, 1440
📖 Indicator Function Details (Concise Version):
🎯 Core Functions:
1. MultiTimeframe Trend Analysis Monitors 8 timeframes simultaneously (1m/5m/15m/1H/4H/D/W/M)
2. 4Dimensional Voting System Comprehensive judgment based on MA trend + RSI momentum + MACD + Bollinger Bands
3. Global Trading Sessions Visualizes Asia/London/New York trading hours
4. Trend Strength Score Quantifies market strength from 0100%
5. Smart Alerts Automatically pushes strong bullish/bearish signals
📚 Key Term Explanations:
🔵 Trend Status (MA Analysis):
| Term | Meaning | Signal Strength |
| | | |
| Strong Bull | Fast MA significantly > Slow MA (Diff ≥0.35%) | ⭐⭐⭐⭐⭐ Long |
| Bullish Bias | Fast MA slightly > Slow MA (Diff <0.35%) | ⭐⭐⭐ Caution Long |
| Ranging | MAs intertwined, no clear direction | ⚠️ Wait & See |
| Bearish Bias | Fast MA slightly < Slow MA | ⭐⭐⭐ Caution Short |
| Strong Bear | Fast MA significantly < Slow MA | ⭐⭐⭐⭐⭐ Short |
Simple Understanding: Fast MA = sprinter (fast reaction), Slow MA = longdistance runner (stable). Sprinter far ahead = Strong Bull, opposite = Strong Bear.
🟠 Momentum Status (RSI Analysis):
| Term | Meaning | Trading Suggestion |
| | | |
| Momentum Up ↗ | RSI >60 & rising rapidly | Strong Buy Signal |
| Momentum High | RSI >60 but rising slower | Watch for pullback, consider reducing position |
| Momentum Neutral | RSI between 4060, stable | Wait for clearer direction |
| Momentum Low | RSI <40 but falling slower | Watch for rebound, consider taking profit |
| Momentum Down ↘ | RSI <40 & falling rapidly | Strong Sell Signal |
Simple Understanding: RSI = car speedometer. "Momentum Up" = full throttle acceleration, "Momentum High" = already fast but not accelerating further.
🟣 Auxiliary Signals:
MACD:
MACD Bullish = Histogram >0 = Strong buyer power
MACD Bearish = Histogram <0 = Strong seller power
Bollinger Bands (BB):
BB Overbought = Price near upper band = Possible pullback
BB Oversold = Price near lower band = Possible rebound
BB Middle = Price near middle band = Balanced state
💡 Quick Start 3 Steps to Understand the Panel:
Step 1: Check "Composite Conclusion Label" (Above the chart)
Green "Bulls Favored" → Consider Long
Red "Bears Favored" → Consider Short
Orange "Ranging/Balanced" → Wait & See
Step 2: Check "Votes Bull/Bear" (Bottom of the panel)
Bull votes significantly > Bear votes (Difference >2) → Strong Trend
Votes close (Difference <1) → Ranging Market
Step 3: Check "Trend Strength" (In the composite label)
Strength >70% → Strong Trend, consider heavier position
Strength 5070% → Moderate Trend, normal position size
Strength <50% → Weak Trend, light position or wait & see
🎨 Trading Session Background Color Meanings:
Purple = Asian Session (Tokyo hours) Lower volatility
Orange = London Session (European hours) Increased volatility
Blue = NY Early Morning US session preparation phase
Red = NY Critical 5 Minutes (09:3009:35) ⚠️ Most Important! Market most active, trends easily form
Green = NY Late Morning Continuation of early session trend
Trading Tip: Focus on the red critical period; these 5 minutes often determine the day's direction!
⚙️ Recommended Settings for Three Major Markets
🥇 Gold (XAUUSD):
Fast MA: Hull MA 12 (Highly sensitive for gold's fast moves)
Slow MA: EMA 34 (Fibonacci number)
RSI Period: 9 (Faster reaction)
Strong Trend Threshold: 0.25%
Timeframes: 5, 15, 60, 240, 1440
₿ Bitcoin (BTCUSD):
Fast MA: EMA 21
Slow MA: EMA 55
RSI Period: 14
Strong Trend Threshold: 0.8% (High volatility, requires higher threshold)
Timeframes: 15, 60, 240, D, W
💎 Ethereum (ETHUSD):
Fast MA: TEMA 21
Slow MA: EMA 55
RSI Period: 14
Strong Trend Threshold: 0.600.80%
Timeframes: 15, 60, 240, D, W
💱 Forex EUR/USD:
Fast MA: TEMA 10 (Fast response)
Slow MA: T3 30, Factor 0.7 (Smooths noise)
RSI Period: 14
Strong Trend Threshold: 0.08% (Forex has low volatility)
Timeframes: 5, 15, 60, 240, 1440
Swing AURORA v4.0 — Refined Trend Signals### Swing Algo v4.0 — Refined Trend Signals
#### Overview
Swing Algo v4.0 is an advanced technical indicator designed for TradingView, built to detect trend changes and provide actionable buy/sell signals in various market conditions. It combines multiple technical elements like moving averages, ADX for trend strength, Stochastic RSI for timing, and RSI divergence for confirmation, all while adapting to different timeframes through auto-tuning. This indicator overlays on your chart, highlighting trend regimes with background colors, displaying buy/sell labels (including "strong" variants), and offering early "potential" signals for proactive trading decisions. It's suitable for swing trading, trend following, or as a filter for other strategies across forex, stocks, crypto, and other assets.
#### Purpose
The primary goal of Swing Algo v4.0 is to help traders identify high-probability trend reversals and continuations early, reducing noise and false signals. It aims to provide clear, non-repainting signals that align with market structure, volatility, and momentum. By incorporating filters like higher timeframe (HTF) alignment, bias EMAs, and divergence, it refines entries for better accuracy. The indicator emphasizes balanced performance across aggressive, balanced, and conservative modes, making it versatile for both novice and experienced traders seeking to optimize their decision-making process.
#### What It Indicates
- **Trend Regimes (Background Coloring)**: The chart background changes color to reflect the current market regime:
- **Green (Intense for strong uptrends, faded when cooling)**: Indicates bullish trends where price is above the baseline and EMAs are aligned upward.
- **Red/Maroon (Intense maroon for strong downtrends, faded red when cooling)**: Signals bearish trends with price below the baseline and downward EMA alignment.
- **Faded Yellow**: Marks "no-trade" zones or potential trend changes, where conditions are choppy, weak, or neutral (e.g., low ADX, near baseline, or low volatility).
- **Buy/Sell Signals**: Labels appear on the chart for confirmed entries:
- "BUY" or "STRONG BUY" for bullish signals (strong variants require higher scores and optional divergence).
- "SELL" or "STRONG SELL" for bearish signals.
- **Potential Signals**: Early warnings like "Potential BUY" or "Potential SELL" appear before full confirmation, allowing traders to anticipate moves (confirmed after a few bars based on the trigger window).
- **Divergence Marks**: Small "DIV↑" (bullish) or "DIV↓" (bearish) labels highlight RSI divergences on pivots, adding confluence for strong signals.
- **Lines**: Optional plots for baseline (teal), EMA13/21 (lime/red based on crossover), providing visual trend context.
Signals are anchored either to the current bar or confirmed pivots, ensuring alignment with price action. The indicator avoids repainting by confirming on close if enabled.
#### Key Parameters and Customization
Swing Algo v4.0 offers minimal yet efficient parameters for fine-tuning, with defaults optimized for common use cases. Most can be auto-tuned based on timeframe for simplicity:
- **Confirm on Close (no repaint)**: Boolean (default: true) – Ensures signals don't repaint by waiting for bar confirmation.
- **Auto-tune by Timeframe**: Boolean (default: true) – Automatically adjusts lengths and sensitivity for 5-15m, 30-60m, 2-4h, or higher frames.
- **Mode**: String (options: Aggressive, Balanced , Conservative) – Controls signal thresholds; Aggressive for more signals, Conservative for fewer but higher-quality ones.
- **Signal Anchor**: String (options: Pivot (divLB) , Current bar) – Places labels on confirmed pivots or the current bar.
- **Trigger Window (bars)**: Integer (default: 3) – Window for signal timing; auto-tuned if enabled.
- **Baseline Type**: String (options: HMA , EMA, ALMA) – Core trend line; lengths auto-tune (e.g., 55 for short frames).
- **Use Bias EMA Filter**: Boolean (default: false) – Adds a long-term EMA for trend bias.
- **Use HTF Filter**: Boolean (default: false) – Aligns with higher timeframe (auto or manual like 60m, 240m, D); override for stricter scoring.
- **Sensitivity (10–90)**: Integer (default: 55) – Adjusts ADX threshold for trend detection; higher = more sensitive.
- **Use RSI-Stoch Trigger**: Boolean (default: true) – Enables Stochastic RSI for entry timing; customizable lengths, smooths, and levels.
- **Use RSI Divergence for STRONG**: Boolean (default: true) – Requires divergence for strong signals; pivot lookback (default: 5).
- **Visual Options**: Booleans for background regime, labels, divergence marks, and lines (all default: true).
These parameters are grouped for ease, with tooltips in TradingView for quick reference. Start with defaults and tweak based on backtesting.
#### How It Works
At its core, Swing Algo v4.0 calculates a baseline (e.g., HMA) to define the trend direction. It then scores potential buys/sells using factors like:
- **Trend Strength**: ADX above a dynamic threshold, combined with EMA crossovers (13/21) and slope analysis.
- **Volatility/Volume**: Bollinger/Keltner squeeze exits, volume z-score, and ATR filters to avoid choppy markets.
- **Timing**: Stochastic RSI crossovers or micro-timing via DEMA/TEMA for precise entries.
- **Filters**: Bias EMA, HTF alignment, gap from baseline, and no-trade zones (weak ADX, near baseline, low vol).
- **Divergence**: RSI pivots confirm strong signals.
- **Scoring**: Buy/sell scores (min 3-5 based on mode) trigger labels only when all gates pass, with early "potential" detection for foresight.
The algorithm processes these in real-time, auto-adapting to timeframe for efficiency. Signals flip only on direction changes to prevent over-trading. For best results, use on liquid assets and combine with risk management.
#### Disclaimer
This indicator is for educational and informational purposes only and does not constitute financial advice, investment recommendations, or trading signals. Trading involves significant risk of loss and is not suitable for all investors. Past performance is not indicative of future results. Always backtest the indicator on your preferred assets and timeframes, and consult a qualified financial advisor before making any trading decisions. The author assumes no liability for any losses incurred from using this script. Use at your own risk.

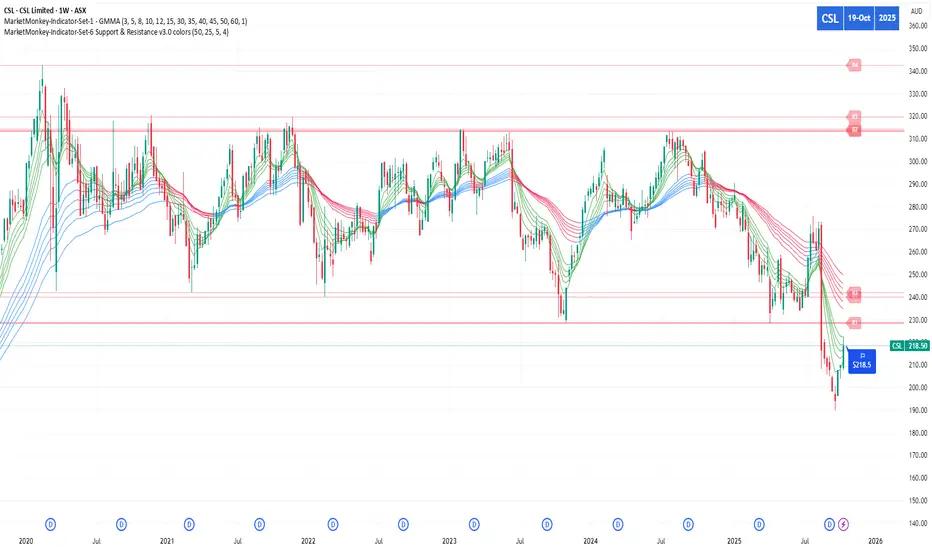
MarketMonkey-Indicator-Set-6 Support & Resistance v3.0 colorsMarketMonkey-Indicator-Set-6 Support & Resistance v3.0 colors
Automatically detects and plots up to four recent support and resistance levels using pivot highs and lows. Lines update dynamically with adaptive colours, highlighting key price zones in real time. Optional R1–R4 and S1–S4 labels keep charts clean yet informative. Ideal for identifying trend reversals, breakout points, and areas where buyers or sellers are likely to act.
________________________________________
🔍 What It Does
The script uses pivot highs and pivot lows to detect recent swing points — the moments where price has clearly turned.
• Resistance levels are drawn at recent pivot highs (red lines).
• Support levels are drawn at recent pivot lows (blue lines).
• Each level automatically updates as new price data forms, keeping your analysis current.
The indicator displays up to four recent resistance and support levels on each side (R1–R4, S1–S4), with labels and colours that adapt to whether the line is above or below current price.
________________________________________
🎨 Features
• Dynamic Detection: Automatically identifies and updates support and resistance using pivot logic.
• Multi-Level Display: Shows up to four most recent highs and lows for a broader market view.
• Customisable Inputs: Adjust the number of bars used to confirm pivots and control how many levels are displayed.
• Colour-Coded Clarity:
o Resistance lines = soft red tone (indicating potential ceiling levels).
o Support lines = soft blue tone (indicating price floors).
• Optional Labels: Toggle on/off “R1–R4” and “S1–S4” tags for quick reference.
• Strong Level Highlighting: The nearest (most recent) levels are drawn thicker for emphasis.

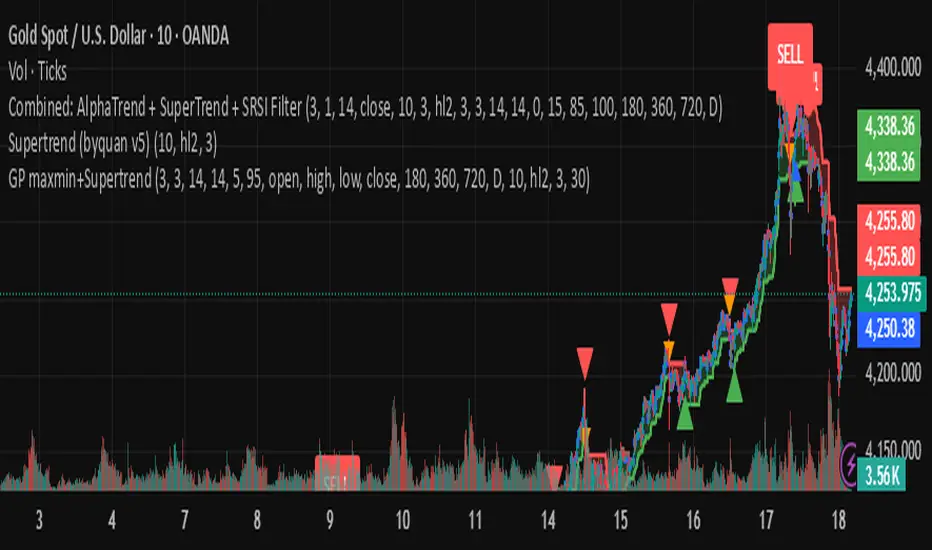
byquan AlphaTrend + Supertrend Combo🔍 Overview
The AlphaTrend + SuperTrend Combo is a smart confirmation-based trading indicator that blends two powerful trend-following systems — AlphaTrend and SuperTrend — into one unified tool.
Its main purpose is to filter out false breakouts and improve entry accuracy by waiting for both indicators to confirm a signal within a specified number of candles.
This combination gives traders high-confidence BUY and SELL signals, clearly marked on the chart, with optional alert notifications.
⚙️ How It Works
🧠 1. AlphaTrend Logic
The AlphaTrend component calculates dynamic support and resistance bands based on Average True Range (ATR) and Money Flow Index (MFI) or RSI (if no volume data).
It identifies momentum shifts using:
upT = Lower ATR band
downT = Upper ATR band
Depending on whether the MFI (or RSI) is above or below 50, AlphaTrend adapts to bullish or bearish conditions.
Signals:
✅ Buy Signal → When AlphaTrend crosses above its past level (momentum turning up).
❌ Sell Signal → When AlphaTrend crosses below its past level (momentum turning down).
📈 2. SuperTrend Logic
The SuperTrend indicator uses ATR to track trend direction based on price and volatility.
A green SuperTrend implies a bullish trend.
A red SuperTrend implies a bearish trend.
It triggers signals when trend direction changes:
✅ SuperTrend Buy → Price breaks above the SuperTrend line.
❌ SuperTrend Sell → Price drops below the SuperTrend line.
Users can choose whether to use the standard ATR or a smoothed ATR version for calculation (changeATR option).
🔄 3. Combo Confirmation Logic
The indicator’s core strength is signal confirmation.
When one indicator (AlphaTrend or SuperTrend) gives a signal, it waits for the other to confirm within a certain number of candles — defined by the “Wait Bars” input.
Example:
AlphaTrend gives a Buy → within the next 3 candles, if SuperTrend also turns bullish → confirmed BUY.
SuperTrend gives a Sell → within the next 3 candles, if AlphaTrend confirms → confirmed SELL.
This filtering greatly reduces false signals caused by volatility or short-term noise.
🧭 Inputs & Settings
Parameter Description
Wait Bars Number of candles to wait for confirmation from the other indicator.
Show Labels Toggle visibility of BUY/SELL labels on chart.
AlphaTrend Multiplier / Period / Source Adjusts AlphaTrend’s sensitivity.
Use RSI (no volume) If true, replaces MFI with RSI for instruments without volume data (e.g., crypto indexes).
SuperTrend ATR Period / Multiplier Controls SuperTrend sensitivity and reactivity.
Use Standard ATR? If disabled, uses smoothed ATR instead.
SuperTrend Source Usually hl2, but can be customized.
📊 Signals & Visualization
🟢 BUY Label: Both indicators confirm an uptrend.
🔴 SELL Label: Both indicators confirm a downtrend.
Labels appear directly on the chart (abovebar for SELL, belowbar for BUY).
Alerts are automatically triggered for both confirmed directions.
🔔 Alerts
Two alert conditions are built in:
"Combo BUY: AlphaTrend + SuperTrend confirmed!"
"Combo SELL: AlphaTrend + SuperTrend confirmed!"
You can use these in TradingView’s alert system to receive push notifications or email alerts.
💡 Trading Tips
✅ Works best on trending markets (crypto, forex, stocks).
✅ Use on 15m–4h timeframes for optimal balance between speed and reliability.
✅ Combine with volume or higher timeframe trend filters for stronger entries.
✅ Adjust Wait Bars (2–5) depending on volatility.
⚖️ Summary
The AlphaTrend + SuperTrend Combo helps traders trade confidently by requiring dual confirmation before signaling a trade.
Key Features:
Combines two proven trend systems.
Reduces false entries through confirmation logic.
Visual BUY/SELL markers.
Built-in alerts for both signals.
Customizable sensitivity and timeframe adaptability.
🎯 Trade only when AlphaTrend and SuperTrend agree — let the market confirm your direction.
byquan GP - SRSI Channel🔍 What Is It?
The GP – SRSI Channel is a momentum-based oscillator that measures the relative strength of price movements across multiple timeframes using the Stochastic RSI (SRSI) method.
Instead of using a single RSI line, this indicator analyzes four price inputs and four timeframes to create a dynamic channel that reflects the true market momentum — helping traders identify overbought and oversold zones with higher accuracy.
⚙️ How It Works
The indicator combines multiple layers of analysis to produce a smooth and reliable momentum channel.
1. Multi-Source RSI Calculation
It computes RSI and Stochastic RSI values for four different price sources:
Open
High
Low
Close
Each source generates its own SRSI value:
dsopen, dshigh, dslow, and dsclose
From these, it extracts:
starraymin: the lowest (most oversold) SRSI value
starraymax: the highest (most overbought) SRSI value
This forms a momentum range based on all price inputs.
2. Multi-Timeframe (MTF) Integration
To strengthen signal reliability, it repeats this SRSI analysis across four higher timeframes (configurable by user):
Parameter Default Value Meaning
Time 1 180 minutes 3-hour chart
Time 2 360 minutes 6-hour chart
Time 3 720 minutes 12-hour chart
Time 4 1D Daily chart
Each timeframe produces its own set of minimum, maximum, and close SRSI values.
These are then combined and normalized to a 0–100 scale.
3. Normalization and Channel Plot
The combined results create three main lines:
Min Line (Green–Red gradient) → represents oversold strength
Max Line (Green–Red gradient) → represents overbought strength
Close Line (White) → represents average SRSI value
The area between the Min and Max lines is filled with a color gradient to form the SRSI Channel, visually showing momentum strength and range.
4. Signal & Alerts
Two alert levels are defined:
Alert Min Level → Default = 5 (oversold)
Alert Max Level → Default = 95 (overbought)
When:
oranmin ≤ Alert Min Level → Market is in an oversold state (potential reversal up).
oranmax ≥ Alert Max Level → Market is in an overbought state (potential reversal down).
When either of these thresholds is crossed, the indicator triggers:
A white square marker on the chart.
A custom alert with the message:
“SRSI Channel reached alert threshold (oranmax ≥ MaxLevel or oranmin ≤ MinLevel)”
🧭 How to Use It
🪄 Step 1 — Add to Chart
Copy the code into a new Pine Script in TradingView.
Click Add to chart.
You’ll see three lines and a colored channel between them.
⚙️ Step 2 — Adjust Inputs
Core SRSI Settings
Setting Description
K, D Smoothing factors for Stochastic RSI.
RSI Length Number of bars for RSI calculation.
S Length Period used for %K in Stochastic RSI.
Alert Min/Max Level Defines oversold/overbought zones.
Multi-Timeframe Settings
Change Time 1 to Time 4 to suit your trading style:
Shorter timeframes → faster but more noise.
Longer timeframes → smoother, more reliable momentum.
📈 Step 3 — Interpret the Chart
Indicator Element Meaning
🟩 Lower Boundary (Min) Lowest SRSI reading → momentum weakness / possible rebound area
🟥 Upper Boundary (Max) Highest SRSI reading → strong momentum / possible exhaustion
⚪ Middle Line (Close) Average of all SRSI readings → overall momentum strength
🌈 Channel Fill Visualizes balance between overbought and oversold levels
When the channel widens → market volatility and strength increase.
When it narrows → consolidation or low-momentum phase.
🔔 Step 4 — Alerts
You can create alerts using:
Condition: SRSI Extreme
Message: SRSI Channel reached alert threshold
Use this to receive notifications when the market hits extreme momentum levels (great for reversal traders).
💡 Trading Tips
✅ Combine with Supertrend, MACD, or Moving Averages for confirmation.
✅ Look for SRSI extremes aligning with price support/resistance for stronger reversal entries.
✅ Use different timeframe combinations (e.g., 1H–4H–12H–1D) depending on your trading style.
✅ Treat it as a momentum filter — not a direct buy/sell signal tool.
⚖️ Summary
The GP – SRSI Channel is a sophisticated multi-timeframe momentum indicator that helps traders visualize market strength and identify overbought or oversold conditions with exceptional clarity.
Features:
4 price sources × 4 timeframes = deep momentum insight
Dynamic, color-coded SRSI channel
Built-in alert system for extreme conditions
Clean and intuitive visual design
Best suited for:
Swing and position traders
Traders who use RSI/Stoch indicators
Those seeking to confirm entries with multi-timeframe momentum data
🎯 Understand the market’s true momentum — before it moves.
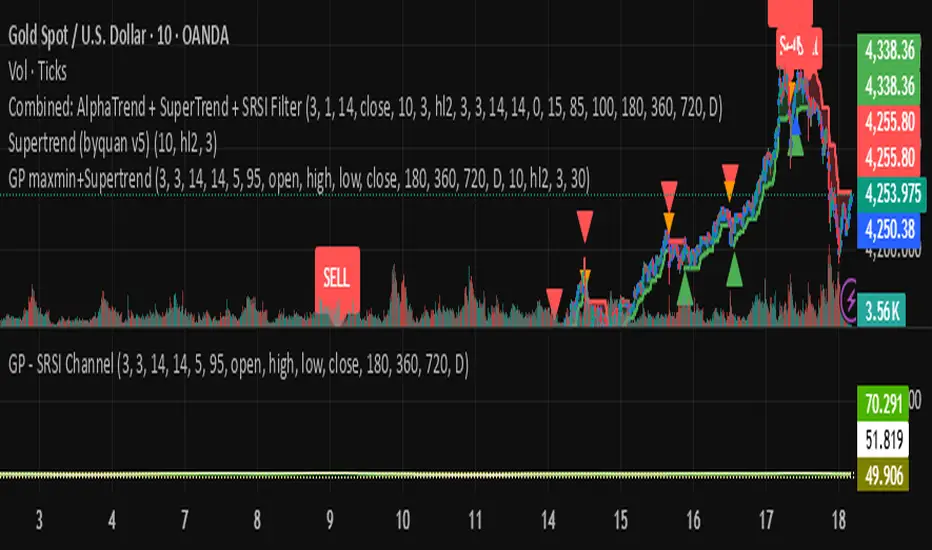
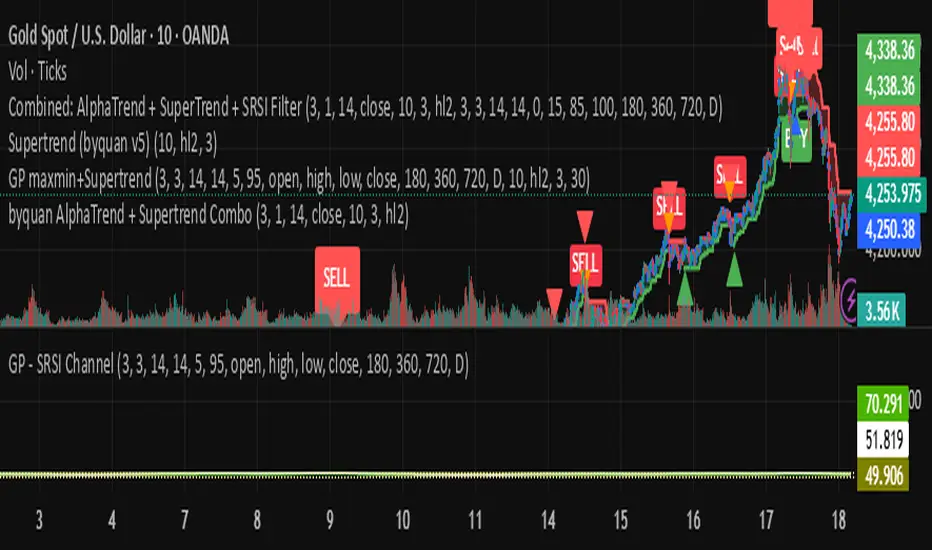
byquan GP maxmin+Supertrend🔍 Overview
The GP MaxMin + Supertrend indicator is an advanced trend-following tool that combines the power of the Supertrend indicator with a multi-timeframe Stochastic RSI (SRSI) filter.
It aims to generate high-confidence buy and sell signals by confirming Supertrend breakouts only when the market’s momentum (based on SRSI) supports them.
In other words:
Supertrend gives you trend direction,
and SRSI ensures you only trade when the market is ready to move.
⚙️ How It Works
The indicator operates in three main layers:
1. SRSI Channel Analysis
It calculates Stochastic RSI values on four price sources:
Open
High
Low
Close
From these, it extracts both minimum (oversold) and maximum (overbought) SRSI readings.
To make the signal more robust, the script collects SRSI data from four different timeframes:
3 hours (180 minutes)
6 hours (360 minutes)
12 hours (720 minutes)
1 day
These multi-timeframe readings are averaged and normalized between 0 and 100.
Key thresholds:
Below 5 → Oversold zone (potential BUY zone)
Above 95 → Overbought zone (potential SELL zone)
2. Supertrend Core
The indicator uses a standard Supertrend logic:
ATR Period: 10
ATR Multiplier: 3.0
It dynamically plots the Supertrend line that shifts between bullish and bearish zones.
When the price crosses the Supertrend line, a trend change is detected:
From bearish to bullish → Buy signal
From bullish to bearish → Sell signal
3. SRSI-Based Signal Filtering
To avoid false breakouts, the Supertrend signals are filtered through the SRSI logic.
Here’s how it works:
When the market becomes oversold, the script records that event.
If a Supertrend Buy signal appears within a certain number of bars (default = 30) after that oversold event → the signal is validated.
The same applies for Sell signals after an overbought event.
This creates a smart “confirmation window,” ensuring that only those Supertrend signals that align with market momentum are displayed.
🧭 How to Use It
✅ Step 1: Add to Your Chart
Copy and paste the script into a new Pine Script editor window in TradingView, then click “Add to chart.”
✅ Step 2: Configure Parameters
SRSI Settings
K, D, RSI Length, S Length: Standard SRSI parameters.
Alert Min Level and Alert Max Level: Define overbought/oversold zones (default 5 and 95).
Timeframes: You can adjust the four MTF levels if you want faster or slower momentum confirmation.
Supertrend Settings
ATR Period: A higher value smooths the trend.
ATR Multiplier: Controls signal sensitivity (lower = more signals, higher = fewer).
Filter Settings
Signal Filter Window: Defines how long after an overbought/oversold event a Supertrend signal remains valid (default = 30 bars).
✅ Step 3: Interpret Signals
Signal Type Condition Interpretation
Buy Supertrend flips to bullish and SRSI was recently oversold Start of an uptrend
Sell Supertrend flips to bearish and SRSI was recently overbought Start of a downtrend
Each signal is marked on the chart:
🟢 Green “Buy” label → potential long entry
🔴 Red “Sell” label → potential short entry
You can also enable or disable background highlighting to visually track bullish/bearish zones.
✅ Step 4: Set Alerts
You can create alerts using the built-in alert condition:
SRSI-Filtered SuperTrend Signal Triggered!
This triggers whenever a filtered Buy or Sell signal appears.
💡 Trading Tips
Combine this indicator with price action or volume confirmation for best results.
Adjust the filter window to fit your preferred timeframe (short-term vs swing trading).
Avoid trading against higher-timeframe Supertrend direction.
⚖️ Advantages
✅ Filters out false Supertrend signals
✅ Uses multi-timeframe momentum confirmation
✅ Clean visual layout with clear entry markers
✅ Supports alerts for automation or notifications
⚠️ Limitations
⚠️ The indicator is computationally heavy due to multi-timeframe requests.
⚠️ It’s a confirmation tool — not a standalone strategy.
⚠️ Results depend on correct parameter tuning for your market and timeframe.
📈 Summary
The GP MaxMin + Supertrend is a hybrid indicator that blends trend detection with momentum filtering.
It helps traders:
Avoid false breakouts
Enter trades at better timing
Stay aligned with both trend and momentum
Perfect for swing traders, crypto traders, and anyone who wants cleaner Supertrend signals with deeper confirmation logic.