IU Three Line Strike Candlestick PatternIU Three Line Strike Candlestick Pattern
This indicator identifies the Three Line Strike candlestick pattern — a rare yet powerful 4-bar reversal setup that captures exhaustion and momentum shifts at the end of strong trends.
Pattern Logic:
The Three Line Strike is a 4-candle pattern that typically signals a sharp reversal after a sustained directional move. This script detects both bullish and bearish variations using strict criteria to ensure accuracy.
Bullish Three Line Strike:
* Previous three candles must be bearish (red)
* Each of these candles must close progressively lower (indicating a strong downtrend)
* The current candle must:
* Be bullish (green)
* Open below the prior close
* Completely engulf the previous three candles by closing above the first candle's open
* And make a higher high than the last 3 bars — confirming a strong reversal
* Once confirmed, a green shaded box is drawn around the 4-bar zone to highlight the pattern
Bearish Three Line Strike:
* Previous three candles must be bullish (green)
* Each must close progressively higher (indicating a strong uptrend)
* The current candle must:
* Be bearish (red)
* Open above the prior close
* Completely engulf the prior three candles by closing below the first candle's open
* And make a lower low than the last 3 bars — confirming downside strength
* A red shaded box is plotted around the 4-bar formation to emphasize the reversal zone
Why this is unique:
Most candlestick tools focus on 1–2 bar patterns. The Three Line Strike goes a step further by combining trend exhaustion (3 same-colored candles) with a full reversal engulfing candle. This pattern is both rare and highly expressive of sentiment shift, making it a standout signal for discretionary and algorithmic traders alike.
How users can benefit:
* High-probability setups: Filters out weak signals using multi-bar confirmation logic
* Clear visual cues: Dynamic shaded boxes and labels make spotting reversals effortless
* Cross-timeframe compatible: Works on intraday and higher timeframes across all markets
* Real-time alerts: Get notified instantly when a bullish or bearish setup forms
This indicator is a valuable addition for traders who want to capture key reversals backed by strong multi-bar price action logic. Whether you are a price action purist or a pattern-based strategist, the IU Three Line Strike gives you a reliable edge.
Disclaimer:
This script is for educational purposes only and does not constitute financial advice. Trading involves risk, and past performance is not indicative of future results. Always do your own research and consult with a licensed financial advisor before making trading decisions.
Educational

Bloomberg Financial Conditions Index (Proxy)The Bloomberg Financial Conditions Index (BFCI): A Proxy Implementation
Financial conditions indices (FCIs) have become essential tools for economists, policymakers, and market participants seeking to quantify and monitor the overall state of financial markets. Among these measures, the Bloomberg Financial Conditions Index (BFCI) has emerged as a particularly influential metric. Originally developed by Bloomberg L.P., the BFCI provides a comprehensive assessment of stress or ease in financial markets by aggregating various market-based indicators into a single, standardized value (Hatzius et al., 2010).
The original Bloomberg Financial Conditions Index synthesizes approximately 50 different financial market variables, including money market indicators, bond market spreads, equity market valuations, and volatility measures. These variables are normalized using a Z-score methodology, weighted according to their relative importance to overall financial conditions, and then aggregated to produce a composite index (Carlson et al., 2014). The resulting measure is centered around zero, with positive values indicating accommodative financial conditions and negative values representing tighter conditions relative to historical norms.
As Angelopoulou et al. (2014) note, financial conditions indices like the BFCI serve as forward-looking indicators that can signal potential economic developments before they manifest in traditional macroeconomic data. Research by Adrian et al. (2019) demonstrates that deteriorating financial conditions, as measured by indices such as the BFCI, often precede economic downturns by several months, making these indices valuable tools for predicting changes in economic activity.
Proxy Implementation Approach
The implementation presented in this Pine Script indicator represents a proxy of the original Bloomberg Financial Conditions Index, attempting to capture its essential features while acknowledging several significant constraints. Most critically, while the original BFCI incorporates approximately 50 financial variables, this proxy version utilizes only six key market components due to data accessibility limitations within the TradingView platform.
These components include:
Equity market performance (using SPY as a proxy for S&P 500)
Bond market yields (using TLT as a proxy for 20+ year Treasury yields)
Credit spreads (using the ratio between LQD and HYG as a proxy for investment-grade to high-yield spreads)
Market volatility (using VIX directly)
Short-term liquidity conditions (using SHY relative to equity prices as a proxy)
Each component is transformed into a Z-score based on log returns, weighted according to approximated importance (with weights derived from literature on financial conditions indices by Brave and Butters, 2011), and aggregated into a composite measure.
Differences from the Original BFCI
The methodology employed in this proxy differs from the original BFCI in several important ways. First, the variable selection is necessarily limited compared to Bloomberg's comprehensive approach. Second, the proxy relies on ETFs and publicly available indices rather than direct market rates and spreads used in the original. Third, the weighting scheme, while informed by academic literature, is simplified compared to Bloomberg's proprietary methodology, which may employ more sophisticated statistical techniques such as principal component analysis (Kliesen et al., 2012).
These differences mean that while the proxy BFCI captures the general direction and magnitude of financial conditions, it may not perfectly replicate the precision or sensitivity of the original index. As Aramonte et al. (2013) suggest, simplified proxies of financial conditions indices typically capture broad movements in financial conditions but may miss nuanced shifts in specific market segments that more comprehensive indices detect.
Practical Applications and Limitations
Despite these limitations, research by Arregui et al. (2018) indicates that even simplified financial conditions indices constructed from a limited set of variables can provide valuable signals about market stress and future economic activity. The proxy BFCI implemented here still offers significant insight into the relative ease or tightness of financial conditions, particularly during periods of market stress when correlations among financial variables tend to increase (Rey, 2015).
In practical applications, users should interpret this proxy BFCI as a directional indicator rather than an exact replication of Bloomberg's proprietary index. When the index moves substantially into negative territory, it suggests deteriorating financial conditions that may precede economic weakness. Conversely, strongly positive readings indicate unusually accommodative financial conditions that might support economic expansion but potentially also signal excessive risk-taking behavior in markets (López-Salido et al., 2017).
The visual implementation employs a color gradient system that enhances interpretation, with blue representing neutral conditions, green indicating accommodative conditions, and red signaling tightening conditions—a design choice informed by research on optimal data visualization in financial contexts (Few, 2009).
References
Adrian, T., Boyarchenko, N. and Giannone, D. (2019) 'Vulnerable Growth', American Economic Review, 109(4), pp. 1263-1289.
Angelopoulou, E., Balfoussia, H. and Gibson, H. (2014) 'Building a financial conditions index for the euro area and selected euro area countries: what does it tell us about the crisis?', Economic Modelling, 38, pp. 392-403.
Aramonte, S., Rosen, S. and Schindler, J. (2013) 'Assessing and Combining Financial Conditions Indexes', Finance and Economics Discussion Series, Federal Reserve Board, Washington, D.C.
Arregui, N., Elekdag, S., Gelos, G., Lafarguette, R. and Seneviratne, D. (2018) 'Can Countries Manage Their Financial Conditions Amid Globalization?', IMF Working Paper No. 18/15.
Brave, S. and Butters, R. (2011) 'Monitoring financial stability: A financial conditions index approach', Economic Perspectives, Federal Reserve Bank of Chicago, 35(1), pp. 22-43.
Carlson, M., Lewis, K. and Nelson, W. (2014) 'Using policy intervention to identify financial stress', International Journal of Finance & Economics, 19(1), pp. 59-72.
Few, S. (2009) Now You See It: Simple Visualization Techniques for Quantitative Analysis. Analytics Press, Oakland, CA.
Hatzius, J., Hooper, P., Mishkin, F., Schoenholtz, K. and Watson, M. (2010) 'Financial Conditions Indexes: A Fresh Look after the Financial Crisis', NBER Working Paper No. 16150.
Kliesen, K., Owyang, M. and Vermann, E. (2012) 'Disentangling Diverse Measures: A Survey of Financial Stress Indexes', Federal Reserve Bank of St. Louis Review, 94(5), pp. 369-397.
López-Salido, D., Stein, J. and Zakrajšek, E. (2017) 'Credit-Market Sentiment and the Business Cycle', The Quarterly Journal of Economics, 132(3), pp. 1373-1426.
Rey, H. (2015) 'Dilemma not Trilemma: The Global Financial Cycle and Monetary Policy Independence', NBER Working Paper No. 21162.

Future Events TableTo show any type of Future Events Table.
Example shows "astronomical cycle reversal dates" in 2025
*no change, just on a clean chart

Market Map – AK_TradesMarket Map – AK_Trades
A clean, context-driven market structure tool built to enhance the Futures Scalping Signal.
🔹 Dynamic Support & Resistance (auto-adjusting, dashed lines)
🔹 Real-Time Trend Detection with EMA Background
🔹 Breakout Signals using ATR-based filters
🔹 Minimalist, powerful, and clutter-free
Disclaimer: This script is for educational and informational purposes only. It is not financial advice. Use at your own risk. The author assumes no responsibility for any trading losses incurred.


Improved ICT Order Block StrategyThis code is characterized by:
Combining multiple ICT techniques into a single tool to save chart space and enable users to test multiple models.
Drawing important price zones such as Breaker Blocks, Rejection Blocks, Order Blocks, Fair Value Gaps (FVG), and Equal Levels.
Providing clear entry and exit signals based on ICT rules with improved risk management.
Allowing customization of settings like timeframe selection, entry ratios, and profit/loss targets.
Supporting alerts to facilitate monitoring trading opportunities.
In short, it is a comprehensive advanced tool that helps traders practically and effectively apply the ICT methodology, with the ability to test performance and optimize the strategy before live trading.

Multi-Pair MTF Crypto Strategy (Backtest Version)Multi-Pair MTF Crypto Scanner (Smart Long/Short Indicator)
This advanced TradingView indicator is designed for crypto traders seeking precise, risk-filtered signals across multiple pairs and timeframes. It combines institutional-grade signal logic with customizable risk management and clean visual labeling.
🔍 Core Features:
✅ Multi-Pair & Multi-Timeframe Scanning
Scans assets like BTC, ETH, SOL across timeframes (15m, 1H, 4H)
✅ Buy/Sell Signal Engine
Based on EMA 50/200 crossover, RSI, and volume spikes
✅ Dynamic Risk Management
Calculates Stop Loss (SL), Take Profit (TP), and Risk-Reward Ratio (RRR) using ATR
✅ RRR Filter
Signals only shown if RRR meets your defined minimum (default 1.5)
✅ Confirmation Mode
Optional setting to avoid premature signals by requiring bar-close confirmation
✅ Visual Trade Zones
Entry, SL, and TP levels plotted directly on chart
✅ Debug Mode
Shows labels when trades are rejected due to RRR filters
🧠 Ideal For:
Crypto scalpers, swing traders, and algorithmic signal testers
Traders focused on high probability entries with defined risk
📣 Alerts:
Real-time alerts for qualified BUY and SHORT signals
Configurable for automated webhook systems or mobile push
Open-source script
In true TradingView spirit, the creator of this script has made it open-source, so that traders can review and verify its functionality. Kudos to the author! While you can use it for free, remember that republishing the code is subject to our House Rules.
flydreams143
Disclaimer
The information and publications are not meant to be, and do not constitute, financial, investment, trading, or other types of advice or recommendations supplied or endorsed by TradingView. Read more in the Terms of Use.


RSI - SECUNDARIO - mauricioofsousaSecondary RSI – MGO
Reading the rhythm behind the price action
The Secondary RSI is a specialized oscillator developed as part of the MGO (Matriz Gráficos ON) methodology. It works as a refined strength filter, designed to complement traditional RSI readings by isolating the true internal rhythm of price action and reducing the influence of market noise.
While the standard RSI measures price momentum, the Secondary RSI focuses on identifying breaks in oscillatory balance—the moments when the market shifts from accumulation to distribution or from compression to expansion.
🎯 What the Secondary RSI highlights:
Internal imbalances in energy between buyers and sellers
Micro-divergences not visible on standard RSI
Areas of price fatigue or overextension that often precede reversals
Confirmation zones for MGO oscillatory events (RPA, RPB, RBA, RBB)
📊 Recommended use:
Combine with the Primary RSI for dual-layer validation
Use as a noise-reduction tool before entering trends
Ideal in medium timeframes (12H / 4H) where oscillatory patterns form clearly
🧠 How it works:
The Secondary RSI recalculates the momentum signal using a block-based interpretation (aligned with the MGO structure) instead of simply following raw candle data. It adapts to the periodic nature of price behavior and provides the trader with a more stable and reliable measure of true market strength.

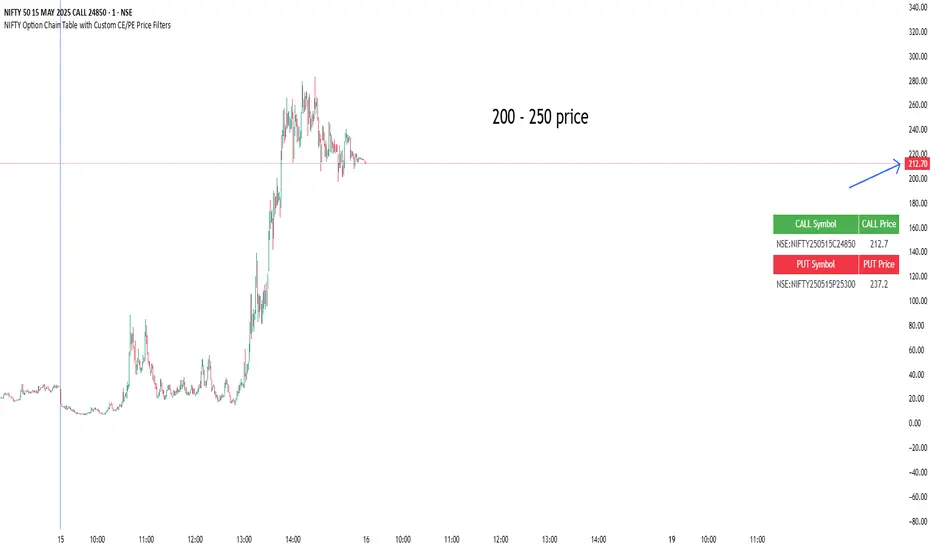
NIFTY Option Chain Table with Custom CE/PE Price FiltersThis Pine Script creates a powerful and visually organized option chain dashboard for NIFTY Index Options, showing 10 Call Options (CE) and 10 Put Options (PE), with real-time prices updated on a 5-minute chart.
You can filter and view only the most relevant option contracts based on your preferred price ranges, helping you make quick decisions for scalping, intraday, or positional trades.
🔍 How It Works:
You manually select up to 10 Call Option symbols and 10 Put Option symbols from NSE (e.g., NIFTY240530C18000, NIFTY240530P18000, etc.).
Keep that time options this are old options in defalt so there will be a error
The script fetches the real-time close price of each option using the request.security() function.
You define the minimum and maximum price range separately for Calls and Puts.
The script filters out any options that fall outside of your desired price range.
Only a limited number of matching options (as set by you) are displayed in the table for both Calls and Puts.
The table is shown at your preferred location on the chart (Bottom Right, Top Left, etc.).
✅ Features:
🔟 Supports exactly 10 CE and 10 PE options for tracking.
📈 Live price updates pulled directly from the chart timeframe (5-min).
🎯 Custom price filters for CE and PE (separate inputs).
📊 Show only the top X number of contracts that meet your filter criteria.
🧱 Vertical layout with clear headers and color-coded sections (green for Calls, red for Puts).
🎛️ Position the table wherever it's most convenient on your chart.
⚡ Helps you quickly spot low premium or range-bound options during the day.
📌 Use Case:
Ideal for:
Option scalpers and day traders who want to focus only on options within a specific price zone.
Traders who want to monitor multiple strikes simultaneously without clutter.
Users building custom NIFTY strategies based on option premiums.
RSI Crossover with RSI EMAdfsffefdfnsdbhavddd
dnadghvadudvhbdasbdjadd
sdcasdvscdhgasvxdhzvjx
sasvhx zhxvjhx

UNITED TRADING COMMUNITY WaterMarkWATER MARK indicator. Will allow you to improve the order of the entries you need on the chart.
1. Name and date for the traded instrument
2. Watermarks to protect your charts (in the center and around the perimeter of the chart)
3. The new "notes" option will allow you to keep focus on the factors that are important to you on the chart.
Very flexible settings for any notes, labels, watermarks on the chart that are important to you.
Индикатор WATER MARK . Даст возможность вам улучшить порядок нужных вам записей на графике.
1. Название и дата для торгуемого инструмента
2. Водные знаки для защиты ваших графиков ( в центре и по периметру графика)
3. Новая опция "заметки" позволит вам держать фокус на важных для вас факторах на графике.
Очень гибкая настройка , любых значимых для вас заметок , лейблов , вотермарк на графике.

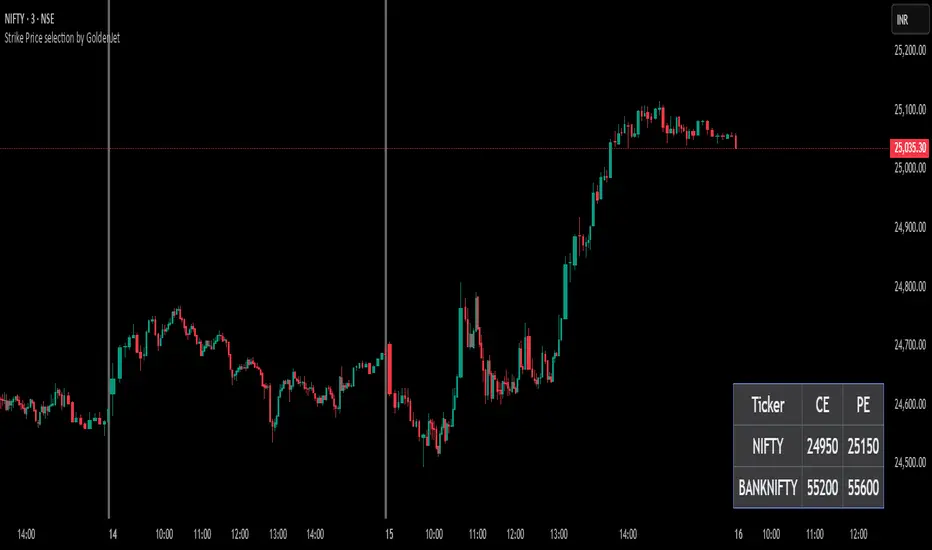
Strike Price selection by GoldenJetThis script is designed to assist options traders in selecting appropriate strike prices based on the latest prices of two financial instruments. It retrieves the latest prices, rounds them to the nearest significant value, and calculates potential strike prices for both call and put options. The results are displayed in a customizable table, allowing traders to quickly see the relevant strike prices for their trading decisions.
The strike prices shown are In-The-Money (ITM), which helps options traders in several ways:
Saving from Theta Decay: On expiry day, ITM options experience less time decay (Theta), which can help preserve the option's value.
Capturing Good Points: ITM options have a higher Delta, meaning they move more in line with the underlying asset's price. This can help traders capture a good amount of points as the underlying asset's price changes.
In essence, this tool simplifies the process of determining strike prices, making it easier for traders to make informed decisions and potentially improve their trading outcomes.
Market sessionsMarket sessions on chart. I used some coding from a large code. I wanted to see the market sessions on chart once each session opens. i am going to look at adding in supply and demand zones. Hopefully this can be a nice add on to any chart.


Global M2 Money Supply (USD) (27 currencies)M2 for 27 currencies, converted into USD.
Does not constitute 100% of global M2, but ~90% accounted for.
Leverages Dylan LeClair's starting point, adds to it.

RSI - PRIMARIO -mauricioofsousa
MGO Primary – Matriz Gráficos ON
The Blockchain of Trading applied to price behavior
The MGO Primary is the foundation of Matriz Gráficos ON — an advanced graphical methodology that transforms market movement into a logical, predictable, and objective sequence, inspired by blockchain architecture and periodic oscillatory phenomena.
This indicator replaces emotional candlestick reading with a mathematical interpretation of price blocks, cycles, and frequency. Its mission is to eliminate noise, anticipate reversals, and clearly show where capital is entering or exiting the market.
What MGO Primary detects:
Oscillatory phenomena that reveal the true behavior of orders in the book:
RPA – Breakout of Bullish Pivot
RPB – Breakout of Bearish Pivot
RBA – Sharp Bullish Breakout
RBB – Sharp Bearish Breakout
Rhythmic patterns that repeat in medium timeframes (especially on 12H and 4H)
Wave and block frequency, highlighting critical entry and exit zones
Validation through Primary and Secondary RSI, measuring the real strength behind movements
Who is this indicator for:
Traders seeking statistical clarity and visual logic
Operators who want to escape the subjectivity of candlesticks
Anyone who values technical precision with operational discipline
Recommended use:
Ideal timeframes: 12H (high precision) and 4H (moderate intensity)
Recommended assets: indices (e.g., NASDAQ), liquid stocks, and futures
Combine with: structured risk management and macro context analysis
Real-world performance:
The MGO12H achieved a 92% accuracy rate in 2025 on the NASDAQ, outperforming the average performance of major global quantitative strategies, with a net score of over 6,200 points for the year.

Trading Time Highlighter v2Check boxes for days of week.
Set the time you want to trade or backtest.
Adjust for UTC time.
GM

Futures Scalping Signal by AK_Trades – RISK PROTECTED MODEFutures Scalping Signal by AK_Trades – RISK PROTECTED MODE
This precision-built scalping indicator is designed for futures traders who demand clarity, speed, and protection.
✅ Smart Signal Logic:
Based on UT Bot ATR trailing stop logic
Requires minimum price movement for confirmation
Prevents repeated signals in the same direction using trend memory
✅ Visuals That Guide You, Not Distract:
Clear Buy/Sell signals labeled on the chart
Dynamic support or resistance line always visible
Price-tagged signal entries (Buy @, Sell @)
✅ Candlestick Awareness:
Highlights key patterns: Engulfing, Doji, Hammer, Shooting Star
Patterns are visual only — no interference with signal flow
✅ Trend Label:
Clean top-right corner label updates periodically to guide sentiment
⚠️ Disclaimer:
This tool is for educational purposes only. No financial advice is provided. Use at your own risk.
Built by @AK_Trades to help scalpers trade smarter, not harder.

Bar ColorHis BTCUSDT Script to easy way in trade from next moving Guys due to the past levels spot and resistance and also where did price will break and push to upside,
key levels to watch
Take long hold in blue zone see our goal in long time with prefect entries
Like Pivot point
Resistance zone
Support levels
Breakout Points
Keep eye on these levels you may find details more in script

SMA Strategy Indicator ZeenuThis indicator is created to visualize the buying opportunities in death cross and selling opportunities in gold cross. This is only for educational purpose.

ZMVZMV-STRATEGY
Z – Zero-Based Thinking
At the core of the ZMV-STRATEGY lies zero-based thinking: the practice of assessing actions, projects, or goals as if starting from scratch. This principle encourages:
Eliminating outdated assumptions
Prioritizing current relevance over historical momentum
Making decisions based on present and future potential, not sunk costs
M – Momentum Mapping
Momentum is essential for sustained progress. The "M" emphasizes:
Identifying key areas where traction exists
Mapping energy flows within a team, project, or market
Leveraging small wins to catalyze exponential growth
V – Value Alignment
Finally, the “V” represents value alignment, which ensures that:
Every move aligns with core values and purpose
Stakeholders are engaged through shared vision
Ethical, meaningful impact is prioritized alongside metrics


Correlation Drift📈 Correlation Drift
The Correlation Drift indicator is designed to detect shifts in market momentum by analyzing the relationship between correlation and price lag. It combines the principles of correlation analysis and lag factor measurement to provide a unique perspective on trend alignment and momentum shifts.
🔍 Core Concept:
The indicator calculates the Correlation vs PLF Ratio, which measures the alignment between an asset’s price movement and a chosen benchmark (e.g., BTCUSD). This ratio reflects how well the asset’s momentum matches the market trend while accounting for price lag.
📊 How It Works:
Correlation Calculation:
The script calculates the correlation between the asset and the selected benchmark over a specified period.
A higher correlation indicates that the asset’s price movements are in sync with the benchmark.
Price Lag Factor (PLF) Calculation:
The PLF measures the difference between long-term and short-term price momentum, dynamically scaled by recent volatility.
It highlights potential overextensions or lags in the asset’s price movements.
Combining Correlation and PLF:
The Correlation vs PLF Ratio combines these metrics to detect momentum shifts relative to the trend.
The result is a dynamic, smoothed histogram that visualizes whether the asset is leading or lagging behind the trend.
💡 How to Interpret:
Positive Values (Green/Aqua Bars):
Indicates bullish alignment with the trend.
Aqua: Rising bullish momentum, suggesting continuation.
Teal: Decreasing bullish momentum, signaling caution.
Negative Values (Purple/Fuchsia Bars):
Indicates bearish divergence from the trend.
Fuchsia: Falling bearish momentum, indicating increasing pressure.
Purple: Rising bearish momentum, suggesting potential reversal.
Clipping for Readability:
Values are clipped between -3 and +3 to prevent outliers from compressing the histogram.
This ensures clear visualization of typical momentum shifts while still marking extreme cases.
🚀 Best Practices:
Use Correlation Drift as a confirmation tool in conjunction with trend indicators (e.g., moving averages) to identify momentum alignment or divergence.
Look for transitions from positive to negative (or vice versa) as signals of potential trend shifts.
Combine with volume analysis to strengthen confidence in breakout or breakdown signals.
⚠️ Key Features:
Customizable Settings: Adjust the correlation length, PLF length, and smoothing factor to fine-tune the indicator for different market conditions.
Visual Gradient: The histogram changes color based on the strength and direction of the ratio, making it easy to identify shifts at a glance.
Zero Line Reference: Clearly distinguishes between bullish and bearish momentum zones.
🔧 Recommended Settings:
Correlation Length: 14 (for short to medium-term analysis)
PLF Length: 50 (to smooth out noise while capturing trend shifts)
Smoothing Factor: 3 (for enhanced clarity without excessive lag)
Benchmark Symbol: BTCUSD (or another relevant market indicator)
By providing a quantitative measure of trend alignment while accounting for price lag, the Correlation Drift indicator helps traders make more informed decisions during periods of momentum change. Whether you are trading crypto, forex, or equities, this tool can be a powerful addition to your momentum-based trading strategies.
⚠️ Disclaimer:
The Correlation Drift indicator is a technical analysis tool designed to aid in identifying potential shifts in market momentum and trend alignment. It is intended for informational and educational purposes only and should not be considered as financial advice or a recommendation to buy, sell, or hold any financial instrument.
Trading financial instruments, including cryptocurrencies, involves significant risk and may result in the loss of your capital. Past performance is not indicative of future results. Always conduct thorough research and seek advice from a certified financial professional before making any trading decisions.
The developer (RWCS_LTD) is not responsible for any trading losses or adverse outcomes resulting from the use of this indicator. Users are encouraged to test and validate the indicator in a simulated environment before applying it to live trading. Use at your own risk.
