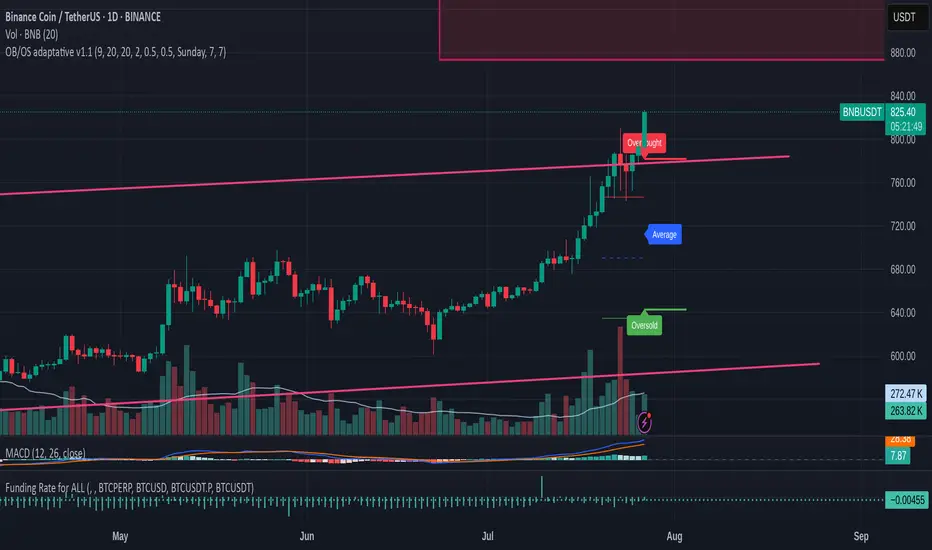
OB/OS adaptative v1.1# OB/OS Adaptative v1.1 - Multi-Timeframe Adaptive Overbought/Oversold Indicator
## Overview
The `tradingview_indicator_emas.pine` script is a sophisticated multi-timeframe indicator designed to identify dynamic overbought and oversold levels in financial markets. It combines EMA (Exponential Moving Average) crossovers and Bollinger Bands across monthly, weekly, and daily timeframes to create adaptive support and resistance levels that adjust to changing market conditions.
## Core Functionality
### Multi-Timeframe Analysis
The indicator analyzes three timeframes simultaneously:
- **Monthly (M)**: Long-term trend identification
- **Weekly (W)**: Intermediate-term trend identification
- **Daily (D)**: Short-term volatility measurement
### Technical Indicators Used
- **EMA 9 and EMA 20**: For trend identification and momentum assessment
- **Bollinger Bands (20-period)**: For volatility measurement and extreme level identification
- **Price action**: For confirmation of level validity and signal generation
## Key Features
### Adaptive Level Calculation
The indicator dynamically determines overbought and oversold levels based on market structure and trend bias:
#### Monthly Level Logic
- **Bullish Bias** (when monthly open > EMA20):
- Oversold = lower of EMA9 or EMA20
- Overbought = upper of EMA9 or Bollinger Upper Band
- **Bearish/Neutral Bias** (when monthly open ≤ EMA20):
- Oversold = Bollinger Lower Band
- Overbought = upper of EMA20 or EMA9
#### Weekly Level Logic
- **Bullish Bias** (when weekly open > EMA20):
- Oversold = lower of EMA9 or EMA20
- Overbought = Bollinger Upper Band
- **Bearish/Neutral Bias** (when weekly open ≤ EMA20):
- Oversold = Bollinger Lower Band
- Overbought = upper of EMA20 or EMA9
#### Daily Level Logic
- Simple Bollinger Bands:
- Oversold = Bollinger Lower Band
- Overbought = Bollinger Upper Band
### Final Level Determination
The indicator combines all three timeframes through a weighted averaging process:
1. Calculates initial values as the average of monthly, weekly, and daily levels
2. Ensures mathematical consistency by enforcing overbought_final ≥ oversold_final using min/max functions
3. Calculates a midpoint average level as the center of the range
### Visual Elements
- **Dynamic Lines**: Draws horizontal lines for current and previous period overbought, oversold, and average levels
- **Labels**: Places clear textual labels at the start of each period
- **Color Coding**:
- Red for overbought levels (resistance)
- Green for oversold levels (support)
- Blue for average levels (pivot point)
- **Transparency**: Previous period lines use semi-transparent colors to distinguish between current and historical levels
### Update Mechanism
- **Calculation Day**: User-defined day of the week (default: Monday)
- On the specified calculation day, the indicator:
- Updates all levels based on previous bar's data
- Draws new lines extending forward for a user-defined number of days
- Maintains previous period lines for comparison and trend analysis
- Automatically deletes and recreates lines to ensure clean visualization
### Proximity Detection
- Alerts when price approaches overbought/oversold levels (configurable distance in percentage)
- Helps identify potential reversal zones before actual crossovers occur
- Distance thresholds are user-configurable for both overbought and oversold conditions
### Alert Conditions
The indicator provides four distinct alert types:
1. **Cross below oversold**: Triggered when price crosses below the oversold level
2. **Cross above overbought**: Triggered when price crosses above the overbought level
3. **Near oversold**: Triggered when price approaches the oversold level within the configured distance
4. **Near overbought**: Triggered when price approaches the overbought level within the configured distance
### Debug Mode
When enabled, displays comprehensive debug information including:
- Current values for all levels (oversold, overbought, average)
- Timeframe-specific calculations and raw data points
- System status information (current day, calculation day, etc.)
- Lines existence and timing information
- Organized in multiple labels at different price levels to avoid overlap
## Configuration Parameters
| Parameter | Default Value | Description |
|---------|---------------|-------------|
| Short EMA (9) | 9 | Length for short-term EMA calculation |
| Long EMA (20) | 20 | Length for long-term EMA calculation |
| BB Length | 20 | Period for Bollinger Bands calculation |
| Std Dev | 2.0 | Standard deviation multiplier for Bollinger Bands |
| Distance to overbought (%) | 0.5 | Percentage threshold for "near overbought" alerts |
| Distance to oversold (%) | 0.5 | Percentage threshold for "near oversold" alerts |
| Calculation day | Monday | Day of week when levels are recalculated |
| Lookback days | 7 | Number of days to extend previous period lines backward |
| Forward days | 7 | Number of days to extend current period lines forward |
| Show Debug Labels | false | Toggle for comprehensive debug information display |
## Trading Applications
### Primary Use Cases
1. **Reversal Trading**: Identify potential reversal zones when price approaches overbought/oversold levels
2. **Trend Confirmation**: Use the adaptive nature of levels to confirm trend strength and direction
3. **Position Sizing**: Adjust position size based on distance from key levels
4. **Stop Placement**: Use opposite levels as dynamic stop-loss references
### Strategic Advantages
- **Adaptive Nature**: Levels adjust to changing market volatility and trend structure
- **Multi-Timeframe Confirmation**: Signals are validated across multiple timeframes
- **Visual Clarity**: Clear color-coded lines and labels enhance decision-making
- **Proactive Alerts**: "Near" conditions provide early warnings before crossovers
## Implementation Details
### Data Security
Uses `request.security()` function to fetch data from higher timeframes (monthly, weekly) while maintaining proper bar indexing with ` ` offset for open prices.
### Performance Optimization
- Uses `var` keyword to declare persistent variables that maintain state across bars
- Efficient line and label management with proper deletion before recreation
- Conditional execution of debug code to minimize performance impact
### Error Handling
- Comprehensive NA (not available) checks throughout the code
- Graceful degradation when data is unavailable for higher timeframes
- Mathematical safeguards to prevent invalid level calculations
## Conclusion
The OB/OS Adaptative v1.1 indicator represents a sophisticated approach to identifying market extremes by combining multiple technical analysis concepts. Its adaptive nature makes it particularly useful in trending markets where static levels may be less effective. The multi-timeframe approach provides a comprehensive view of market structure, while the visual elements and alert system enhance its practical utility for active traders.
Exponential Moving Average (EMA)
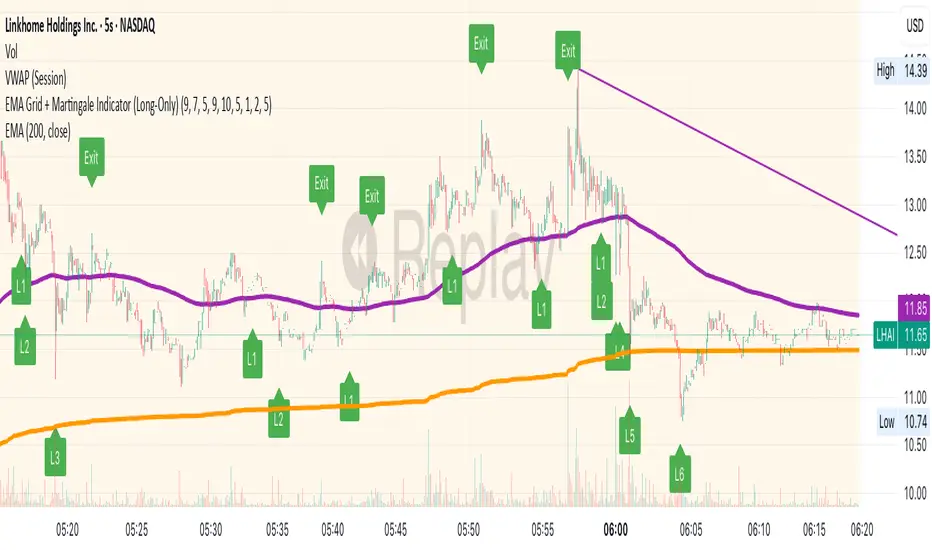
EMA Grid + Martingale Indicator (Long-Only)Title:
EMA Grid + Martingale Indicator (Long-Only)
Short Summary:
A 4-EMA trend filter combined with a grid-based entry system and optional martingale sizing to visualize staged long entries and exits in bullish markets.
Full Description:
This indicator combines a 4-EMA trend filter with a grid-based entry system and optional martingale-style position sizing to help traders visualize staged long entries and exits in trending markets.
How It Works
1. Trend Detection: Uses two sets of EMAs (fast/slow pairs) to confirm bullish momentum. A long signal is generated when both EMA groups align in an uptrend.
2. Grid Entries: After the initial long entry, additional grid levels are triggered every time price drops by the specified grid step (in pips).
3. Martingale Sizing (Optional): Each subsequent entry can increase in size based on the defined martingale factor.
4. Weighted-Average Exit: Calculates the weighted average of all grid entries and signals an exit when the price reaches or surpasses this level plus an optional buffer.
Key Features
• 4 EMA Trend Filter with fully customizable lengths.
• Dynamic grid entries with visual labels (L1, L2, etc.).
• Optional martingale position sizing.
• Weighted-average exit with adjustable buffer.
• Customizable parameters for EMAs, grid steps, max entries, and buffer pips.
• Clear chart visualization of EMAs and entry/exit levels.
Use Cases
• For traders using cost-averaging or grid strategies in bullish markets.
• Visualizes multiple entry levels and profit targets.
• Useful for backtesting and strategy planning.
Note: This indicator is for visualization and planning purposes only. It does not execute trades automatically. It does not guarantee profits and is not financial advice.
Moving Average Exponential (Daily Frozen EMA)This script plots an Exponential Moving Average (EMA) based on the daily timeframe, but with a unique twist:
✅ The EMA value is frozen for the entire current daily session, only updating when a new daily candle begins.
🔍 How it works:
The EMA is calculated using the 1-day timeframe, regardless of the chart's current timeframe.
This EMA value remains fixed throughout the day — it doesn't fluctuate intrabar.
It updates only once the daily candle has closed, providing a stable and reliable reference point during the trading day.
The default is the 5 day EMA but can be changed to any EMA timeframe you desire such as 9, 21, 50, 100. 200, etc.
✨ Additional Features:
✅ Optional smoothing with various moving average types (SMA, EMA, WMA, SMMA, VWMA).
✅ Optional Bollinger Bands on top of the smoothed EMA.
✅ Adjustable settings for EMA length, smoothing type, Bollinger Band deviation, and display options.
🛠️ Use Cases:
Ideal for traders who want a non-reactive EMA during intraday trading.
Helps reduce signal noise by anchoring EMA to higher timeframe structure.
Useful for strategy development where EMA should represent confirmed daily bias only.
Hope this helps, happy trading!

Trading Panel with EMA Crossovers## Trading Panel with EMA Crossovers - Description
**What it does:**
This indicator creates a comprehensive trading dashboard that monitors 6 key technical indicators and displays them in an easy-to-read table at the bottom right of your chart. It analyzes market conditions in real-time and provides clear buy/sell signals based on multiple confirmation factors.
**Key Features:**
1. **EMA Crossover Tracking (7/21 & 50/200)**
- Shows whether fast EMAs are above (CROSSOVER/BULL) or below (CROSSUNDER/BEAR) slow EMAs
- Helps identify trend direction and potential entry/exit points
- The 7/21 catches short-term momentum shifts
- The 50/200 confirms longer-term trend strength
2. **Momentum Indicators**
- **RSI**: Identifies overbought (>70) and oversold (<30) conditions
- **MFI**: Similar to RSI but includes volume, making it more reliable
- **MACD**: Confirms trend direction and momentum shifts
3. **Volume Analysis**
- **OBV (On Balance Volume)**: Shows whether smart money is accumulating or distributing
- Helps confirm if price moves are supported by volume
4. **Overall Signal System**
- Counts bullish vs bearish signals from all indicators
- Provides clear BUY/SELL/STRONG BUY/STRONG SELL recommendations
- When both EMAs align (both bull or both bear), it triggers the strongest signals
**Why it's helpful:**
1. **All-in-One View**: Instead of cluttering your chart with multiple indicators, everything is condensed into one clean table
2. **Multiple Confirmation**: Combines trend (EMAs), momentum (RSI/MFI/MACD), and volume (OBV) for more reliable signals
3. **Visual Clarity**: Color-coded signals (green for bullish, red for bearish) make it easy to assess market conditions at a glance
4. **Reduces False Signals**: By requiring multiple indicators to align, it filters out weak trades
5. **Time-Saving**: No need to check multiple indicators manually - the "OVERALL" row gives you an instant market assessment
**Best Use Cases:**
- Trend following: Enter when overall signal shows BUY/STRONG BUY in an uptrend
- Reversal spotting: Watch for divergences between price and indicators
- Risk management: Avoid trades when signals are mixed or neutral
- Confirmation tool: Use alongside your existing strategy for extra confidence
This indicator is particularly effective for swing traders and position traders who want a quick, comprehensive view of market conditions before making trading decisions.

Refined MA + Engulfing (M5 + Confirmed Structure Break)I would like to start by saying that this strategy was put together using ChatGPT, some past trades from myself and some backtested trades, and from my time as a student in Wallstreet Academy under Cue Banks.
I am not profitable yet. I am too jumpy and blow accounts. I'm hoping this strategy (and it's indicator twin) can help me spend less time on the charts, so that I'm not tempted to press buttons as much.
It does fire quite a bit. But, the Strategy Tester tab shows a 30% win rate with our wins being significant to our losses. So, in theory, if you followed the rules of this strategy STRICTLY, you COULD BE profitable.
With that being said, there are times that this strategy has shown to trigger and I ask, "Why?".
I just want to help myself and others, and maybe make some decent\cool stuff along the way. Enjoy
KR

DI/ADX Trend Strategy | (1-Min Scalping)Strategy Overview
This is an experimental 1-minute trend-following strategy combining DI+/DI-, ADX, RSI, MACD, VWAP, and EMA filters with a time-based exit. It aims to catch strong directional moves while strictly managing risk.
Indicator Components
• DI+/DI- + ADX – Trend direction + strength filter
• RSI (14) – Momentum confirmation (RSI > 55 or < 45)
• MACD Histogram – Detects directional momentum shifts
• Candle Body % Filter – Screens for strong commitment candles
• EMA 600 / 2400 – Long-term trend alignment
• Weekly VWAP – Entry only when price is above/below VWAP
• Trade Limit – Max 2 trades per direction per VWAP cycle
• Time-Based Stop – 0.50% SL, 3.75% TP, 12h (720 bars) time stop
Entry Logic
Long Entry:
• DI+ crosses above DI−
• RSI > 55
• MACD histogram > 0
• Strong bullish candle
• Price > VWAP
• EMA600 > EMA2400
• Within 25 bars of EMA crossover
• Max 2 long trades before VWAP resets
Short Entry:
• DI+ crosses below DI−
• RSI < 45
• MACD histogram < 0
• Strong bearish candle
• Price < VWAP
• EMA2400 > EMA600
• Within 25 bars of EMA crossover
• Max 2 short trades before VWAP resets
Exit Logic
• Stop Loss: 0.50%
• Take Profit: 3.75% (7.5R)
• Time Stop: 720 bars (~12 hours on 1m chart)
• Each trade exits independently
Testing Parameters
• Initial Capital: $10,000
• Commission: 0.10%
• Timeframe: 1-minute
• Tested on: BTCUSDT, ETHUSDT
• Pyramiding: Up to 5 positions allowed
• VWAP resets trade counter to reduce overtrading
Alerts
• Buy / Sell signal
• Trade Opened / Closed
• SL/TP triggered
⚠️ Notes
• Early-stage strategy — entry count varies by trend conditions
• Shared for educational use and community feedback
• Please forward-test before using live
• Open-source — contributions and suggestions welcome!
Disclaimer
This strategy is for educational purposes only and should not be considered financial advice. Past performance does not guarantee future results. Always validate independently before trading live.

EMA 8/21/50 + VWAP Crossover Alert IndicatorOverview of the Indicator
This is a custom Pine Script v5 indicator for TradingView titled "EMA 8/21/50 + VWAP Crossover Alert Indicator" (short title: "EMA+VWAP Cross Alert"). It's designed as an overlay indicator, meaning it plots directly on your price chart rather than in a separate pane. The primary purpose is to detect and alert on crossovers between the 8-period Exponential Moving Average (EMA) and the 21-period EMA, which can signal potential bullish or bearish momentum shifts. These are classic short-term trend reversal or continuation signals often used in trading strategies like momentum or swing trading.
To enhance analysis, it also includes:
A 50-period EMA for medium-term trend context (e.g., to confirm if the overall trend aligns with the crossover).
A Volume Weighted Average Price (VWAP) line, which provides a benchmark for the average price weighted by volume, useful for identifying intraday value areas or fair price levels.
The indicator works across all timeframes (e.g., Daily, 4H, 1H, 15M, 5M, 3M) because the calculations are based on the chart's current bars and adapt to volatility and data resolution. It's not a trading strategy (no entry/exit logic or backtesting), but an alert tool—signals are visual and can trigger notifications in TradingView. Always combine it with risk management, as crossovers can produce false signals in ranging or choppy markets.

Market Adjusted EMAGabriel’s Market Adjusted EMA (MAD) is a dynamically weighted exponential moving average that adapts to three core market forces:
🔹 Price Strength (75%) – Choose between traditional RS-based EMA or slope-sensitive Linear Regression EMA for trend responsiveness.
🔹 Volume Pressure (23%) – Uses volume or ATR-based logic to reflect demand/supply shifts.
🔹 Volatility Risk (2%) – Adapts based on the real VIX or fallback Williams VIX Fix for non-equities.
MAD uses Hurst-inspired weighting and π-based multipliers to normalize responsiveness across assets. It’s ideal for identifying dynamic trend shifts and acts as a context-aware anchor for price action strategies.
✅ Built-in alert when price crosses MAD.
⚙️ Customizable inputs for VIX, volume type, and slope adjustment.
🎯 Suitable for equities, crypto, and futures alike.

Minimalist Trend & Risk For 5-Min Timeframe
Of course. Here is a professionally written TradingView description for your indicator, following the specified formatting and incorporating the strategy you outlined.
Minimalist Trend & Risk For 5-Min Timeframe
Overview
This is a clean, on-chart visual tool designed to identify high-probability entries and manage risk, specifically tailored for a 5-minute scalping or day trading strategy. It combines a higher-timeframe trend anchor with a current-timeframe trigger line and a volatility-based stop loss level, keeping your chart uncluttered and your decisions clear.
Visual Components
Trend EMA (50-period, 15-min): This is your main trend guide. The thick, colored line represents the 50 EMA from the 15-minute chart.
Green: Confirmed uptrend.
Red: Confirmed downtrend.
Gray: Neutral or consolidating market.
Price EMA (21-period, 5-min): The thin white line is the 21 EMA based on your current chart (5-minute). This acts as a dynamic trigger line that price must reclaim after a pullback.
Stop Loss Zone (ATR-based): The thin red line provides a suggested stop loss level based on current market volatility (ATR). It automatically appears below price in an uptrend and above price in a downtrend, helping you define your risk on every trade.
How To Use for a Long Entry Strategy
The strategy is to trade pullbacks in the direction of the higher-timeframe trend. This indicator helps you visualize each step of the setup.
1. Identify the Trend: Wait for the main Trend EMA (the thick line) to be green. This confirms you are in an established uptrend on the 15-minute timeframe and should only be looking for long entries.
2. Wait for a Pullback: The core of the strategy is patience. Wait for a 5-minute candlestick to pull back and close below the 15-minute Trend EMA. This confirms a temporary dip within the larger uptrend, offering a better entry price.
3. Spot the Entry Trigger: After the pullback, the entry signal occurs when a 5-minute candlestick closes back above the faster, white Price EMA (21-period). This signals that momentum is returning in the direction of the main trend.
4. Manage Your Risk: Use the red Stop Loss Zone line that appears below your entry as a guide to set your initial stop loss. This helps ensure your risk is managed dynamically based on current volatility.
This indicator simplifies a powerful pullback strategy by plotting all the necessary components directly on your chart, allowing for quick and disciplined trade execution.

Daily Moving Average to Intraday ChartPlaces 200D, 100D, 50D SMAs as well as the 20D EMA onto intraday charts. (Script v6)

(EMA/KAMA/Kijun)EMA/KAMA/Kijun with background is a versatile trend-detection indicator that allows users to choose between three types of moving averages:
EMA (Exponential Moving Average)
KAMA (Kaufman Adaptive Moving Average)
Kijun-sen (from the Ichimoku system)
The indicator automatically detects trend shifts based on candlestick interactions with the selected MA line, and visually reflects the current trend direction using dynamic background coloring. Its goal is to help traders quickly interpret trend strength and direction—without relying on multiple indicators.
How it works
The indicator follows this logic to detect bullish and bearish conditions:
Bullish signal (green trend):
When the candle closes above the selected MA and both the open and close are above the MA, a bullish trend is signaled and the chart background turns green.
Bearish signal (red trend):
When the candle closes below the MA and both the open and close are below it, a bearish trend is triggered and the background turns red.
The background color remains until an opposite signal appears, ensuring a consistent visual representation of the current trend phase.
What it does and why it’s useful
Unlike standard moving average indicators that only plot lines, KINSKI Flexi Trend MA provides:
Flexibility to switch between different MA types (EMA, KAMA, or Kijun), allowing users to adapt it to various market environments.
Visual context via background color that enhances clarity—even when scanning multiple charts or working across timeframes.
KAMA uses fixed internal parameters (fast=2, slow=30) to provide a responsive, noise-filtering MA line.
Kijun-sen is calculated as the midpoint between the highest high and lowest low over a user-defined period, similar to its role in Ichimoku.
This combination of visual clarity and analytical flexibility makes the indicator highly suitable for:
Trend-following strategies
Breakout confirmation
Scalping (on lower timeframes)
Swing trading
How to use it
Select the MA type from the dropdown:
EMA (standard exponential moving average)
KAMA (adaptive smoothing)
Kijun-sen (Ichimoku mid-line)
Adjust the MA length depending on your trading style or timeframe:
e.g., EMA 50 for medium-term trend, Kijun 9 for faster signals.
Observe the background color:
Green → bullish trend in progress.
Red → bearish trend in progress.
Background color change may serve as an entry or exit confirmation.

🟡🔵🟢🔴Beginner's Assistant by carljchapman🟡🔵🟢🔴
Overview
This indicator dynamically marks highs and lows of the premarket (4:00am-9:30amEST) and opening range. It displays Fair Value Gaps, 9 and 21 period Exponential Moving Averages (EMA) and the Volume Weighted Average Price (VWAP). To really help beginners, it marks suggested entry points on the chart with green or red triangles, when a reasonable trend appears.
Features
Automatically draws blue lines for Premarket High and Low values
Dynamically marks the opening Range region
Visual entry signals for long and short opportunities
Primarily used for stocks/funds , but works with forex and crypto
Quick configuration settings to tailor details for your experience level
Mobile friendly mode
Supports alerts
How To Use
Open your chart, and select a 1 or 2 minute timeframe.
Watch for green triangles and red triangles, hinting at entries for long or short positions. Pay particular attention to the price action as it approaches the bounds of the opening range and the premarket levels. I suggest also using a MACD indicator for confirmation of the trend.
For scalping 0dte Options, switch frequently between the 1 ,2 and 5 minute or higher timeframes. Do this so you will not miss an entry opportunity or be unaware of the overall trend.
As a beginner, until you have refined your strategy and develop risk management, take profits as low as 10%. A small profit can quickly become a much larger loss. With 0dte options, time will devour your profits even when the price doesn’t budge.
What makes this indicator so beginner friendly?
Charts with too many lines and colors are are a nightmare for beginners! And empty charts do not tell the whole story. Simple checkboxes in the configuration settings let you turn on and off features to match your comfort level. As you become more familiar you might try turning off the suggested entries to see if you would have selected the same or better ones yourself. Just one example of how you will learn and verify your knowledge. You will quickly spot Opening Range Breakouts and more.
Why are the triangle pointers not simply above or below the bars?
As a beginner, I like to review charts to see how much the price changed, then estimate how much a contract would move based on its delta. A mouthful, I know. But what price does an arrow pointing up below a bar reflect? Would I have entered at the open or close, low or high? This indicator helps by putting the marker close to the price when indicated. It can even display the actual price on the bar. This is helpful for you to make fast calculations without a measuring tool.
I am an experienced trader. Can this help me make winning trades?
Sure. It can also help you make losing ones! Profit is not guaranteed with any indicator or strategy. This indicator is designed to assist you as you learn and while you trade. You won't see the words BUY or SELL. This is not a signal bot! It is merely a tool to assist you. You can learn a lot by spending time observing price movement using this indicator without ever making a single trade.
🟡🔵🟢🔴

Daily EMAs (8, 21 & 50) with BandDescription:
This script plots the Daily EMAs (8, 21, and 50) on any intraday or higher timeframe chart. It provides a clear, multi-timeframe view of market trends by using daily exponential moving averages (EMAs) and a dynamic visual band. I use this on the major indexes to decide if I should be mostly longing or shorting assets.
-In addition to identifying the trend structure, the 8-Day EMA often serves as a key area where buyers or sellers may become active, depending on the market direction:
-In an uptrend, the 8 EMA can act as a dynamic support zone, where buyers tend to re-enter on pullbacks.
-In a downtrend, the same EMA may act as resistance, where sellers become more aggressive.
-The script also includes a colored band between the 8 and 21 EMAs to highlight the short-term trend bias:
-Green fill = 8 EMA is above the 21 EMA (bullish structure).
Blue fill = 8 EMA is below the 21 EMA (bearish structure).
The 50-Day EMA is included to give additional context for intermediate-term trend direction.
Features:
- Daily EMA levels (8, 21, and 50) calculated regardless of current chart timeframe.
- 8 EMA acts as a potential buyer/seller zone based on trend direction.
- Color-coded band between 8 and 21 EMAs:
- Green = Bullish short-term bias
- Blue = Bearish short-term bias
- Customizable price source and EMA offset.
- Suitable for trend trading, pullback entries, and higher-timeframe confirmation.
Use Cases:
Identify key dynamic support/resistance areas using the 8 EMA.
Assess short-, medium-, and intermediate-term trend structure at a glance.
Enhance confluence for entry/exit signals on lower timeframes.

Double Banded Momentum CloudDouble Banded Momentum Cloud (DBMC) extends the logic of BMC by layering two volatility bands around a moving average to create stacked momentum thresholds. It compares a fast Exponential Moving Average (EMA) to a slow Simple Moving Average (SMA), while introducing inner and outer bands based on standard deviation multipliers.
SMA defines the central trend anchor.
EMA captures short-term price momentum.
Band A (inner) represents normal volatility range.
Band B (outer) flags extended or extreme conditions.
Momentum Cloud between EMA and SMA visualizes bias.
By observing how the EMA interacts with these bands, traders can distinguish between ordinary momentum and more aggressive or potentially exhausted moves.

Banded Momentum CloudBanded Momentum Cloud (BMC) is a visual momentum indicator that blends trend-following averages with volatility-based thresholds. It compares a fast Exponential Moving Average (EMA) to a slower Simple Moving Average (SMA), while using a standard deviation band around the SMA to define momentum boundaries.
SMA provides the baseline trend.
EMA responds faster and highlights momentum shifts.
Standard Deviation Bands (above and below SMA) act as adaptive thresholds.
Momentum Cloud fills the space between the EMA and SMA to illustrate the directional bias and intensity.
When the EMA pushes beyond the upper or lower band, it may signal increased momentum or volatility in that direction.

Envelope Momentum CloudEnvelope Momentum Cloud (EMC) is a momentum visualization tool using moving averages and fixed-percentage envelopes. It compares an EMA (fast) to an SMA (slow), with static envelopes around the SMA to create momentum thresholds.
SMA anchors the trend baseline.
EMA highlights momentum shifts relative to the SMA.
Envelopes are placed at a user-defined % above and below the SMA.
Momentum Cloud visually fills the gap between EMA and SMA to show directional pressure.
Crosses beyond the envelope boundaries can indicate overextended moves or possible trend shifts.
Multi-Time-Frame EMA Sampler (6-pack) [DarthSHO]📈 Multi-Timeframe EMA Sampler (6-Pack)
Author: DarthSHO fpgrainger@gmail.com
Type: Overlay
Category: Moving Averages/Multi-Timeframe Analysis
License: Open-source
This script plots up to six EMAs calculated from a higher timeframe of your choice (e.g., 1H, Daily) and samples them at a user-defined update interval (e.g., every 5 or 15 minutes). The result is a precise, non-repainting display of higher-timeframe EMAs — visible on any chart, including lower timeframes.
🔧 Features
✅ Choose the source timeframe for EMA calculations (e.g., 1H, Daily)
✅ Set a custom update interval (sampling timeframe)
✅ Plot up to 6 EMAs, each with:
Individual length
Color customization
On/off visibility toggle
✅ Fully overlays on current chart timeframe
✅ Updates on bar close of your chosen sampling interval (no repainting)
🧠 Use Cases
See key EMAs from higher timeframes without switching charts
Lock in values only once per sampling interval (e.g., only update 1H EMAs every 15min)
Avoid noisy intra-bar flicker or repainting
Combine with price action or support/resistance for confluence setups
⚙️ Example Settings
EMA Calculation Timeframe: 1H
Update/Sampling Timeframe: 15m
Chart Timeframe: Any (1m, 5m, 1H, etc.)
🚫 No Repainting
This script uses lookahead=barmerge.lookahead_on to ensure EMAs are stable and only update at the end of each sampling bar.
💡 Tip
Use the shorter sampling_tf (like 5 or 15) to keep your EMA lines responsive but reliable — or set it equal to the calculation TF to see them step only once per bar.
✨ Created by Darth SHO
Helping traders "Escape the Matrix" with clarity and confluence.
Discord, education, alerts, and more.

CerberusFX Greedy SquirrelCerberusFX Greedy Squirrel
Ever wish you could trade with the cunning of a squirrel snatching the best nuts? Meet the CerberusFX Greedy Squirrel, a TradingView indicator that’s equal parts clever and cheeky! Licensed under Mozilla Public License 2.0, this script spots bullish and bearish signals with the finesse of a forest critter, using dual moving averages (MA) to filter out the market’s chaff.
Toggle it to signal on every candle for rapid-fire trades or stick to alternating buy/sell signals for a smoother ride. Choose your MA flavor (EMA or SMA), tweak fast and slow MA lengths, and decide whether to filter signals above/below one or both MAs. It’s like giving a squirrel a GPS to find the juiciest opportunities! Green triangles mark buy signals, red triangles flag sells, and alerts keep you in the loop. Perfect for traders who want precision without losing their sense of humor.

1H LONG Setup CheckerThis TradingView script identifies high-probability long setups on the 1-hour chart by evaluating five key technical conditions: price above the 200 MA, a higher low structure, RSI above 50 and rising, a bullish MACD crossover, and a breakout above recent resistance. When at least four of these are met, it signals a potential long opportunity with a visual label and background highlight. This tool is useful for traders seeking objective, rule-based entries in trending markets like SOL/USDC and PEPE/USDC.

EMA200 HUD + ATR + Live WickThis indicator displays:
• EMA200 deviation in USD and %
• ATR (Average True Range) and ATR multiples
• Live wick % (up/down) with alerts if wick > 2%

Trend StrengthTrend Strength Dashboard (11-Point System)
Description:
This indicator is a visually enhanced dashboard that evaluates 11 key technical signals to assess bullish momentum for stocks and ETFs. Each condition is displayed in a easy reading table for quick interpretation and visual appeal.
Signals include:
Higher highs and higher lows
Price above EMA21 and SMA200
SMA50 > SMA200
Positive slope on SMA50 and SMA200
RSI trending upward
Ideal for traders who want a clean, at-a-glance summary of market strength without scanning multiple charts or indicators.

Panel Pro+ Quantum SmartPromptPanel Pro+ Check 2.0
*It's a panel with integrated artificial intelligence in offline mode.
*It provides live chart prompts.
*It recognizes market types, such as bullish, bearish, box, sideways, volatile, etc.
*It performs a comprehensive evaluation and takes buy or sell actions, with the corresponding profit-taking.

EMA Pullback Indicator [ATR-based]🟦 EMA Pullback Indicator
This indicator identifies pullbacks in trending markets using the crossover of two EMAs (Fast and Slow). When a pullback occurs during a valid trend, an entry is triggered after price resumes in the trend direction. ATR is used to dynamically calculate stop-loss and take-profit levels.
🔍 Strategy Logic:
Trend Detection: EMA(8) vs EMA(21)
Pullback Zones:
In a bullish trend, a pullback is when price dips below the Fast EMA
In a bearish trend, a pullback is when price rises above the Fast EMA
Entry Trigger: Re-entry into trend direction after pullback
Stop Loss / Take Profit:
Based on ATR × SL/TP multipliers
Exit Options:
TP/SL Hit
Exit on new pullback (optional toggle)
Multiple Entry Toggle: Choose whether to allow multiple pullback entries or not
⚙️ Inputs:
Fast EMA Length
Slow EMA Length
ATR Period
SL Multiplier
TP Multiplier
Allow Multiple Entries
Exit on New Pullback
📊 Visuals:
Colored EMAs and fill zone between them
Grey bars during pullback
Blue/Black trend bar colors
Entry markers and TP/SL levels with labels
Real-time ATR display in corner
📢 Alerts Included:
Long/Short Pullback Entry
Take Profit Hit
Stop Loss Hit
