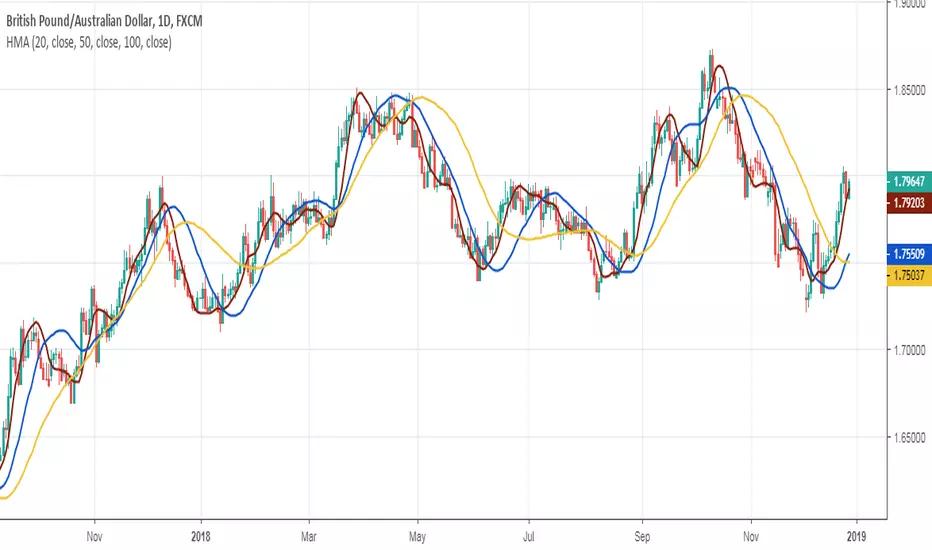
Hull Moving Average and Daily Candle CrossoverHull Moving Average. Alan Hull developed Hull Moving Average in 2005 in his quest to create a moving average that is "responsive to current price activity while maintaining curve smoothness". Hull claims that his moving average "almost eliminates lag altogether and manages to improve smoothing at the same time"
This strategy has Lag built in, the signal will appear 1 or 2 candles lagged, but it wont repaint the signal.... in theory!
Does this repaint? you tell me. thankyou
Change the settings every time you change timeframe or pair
Hull Moving Average (HMA)

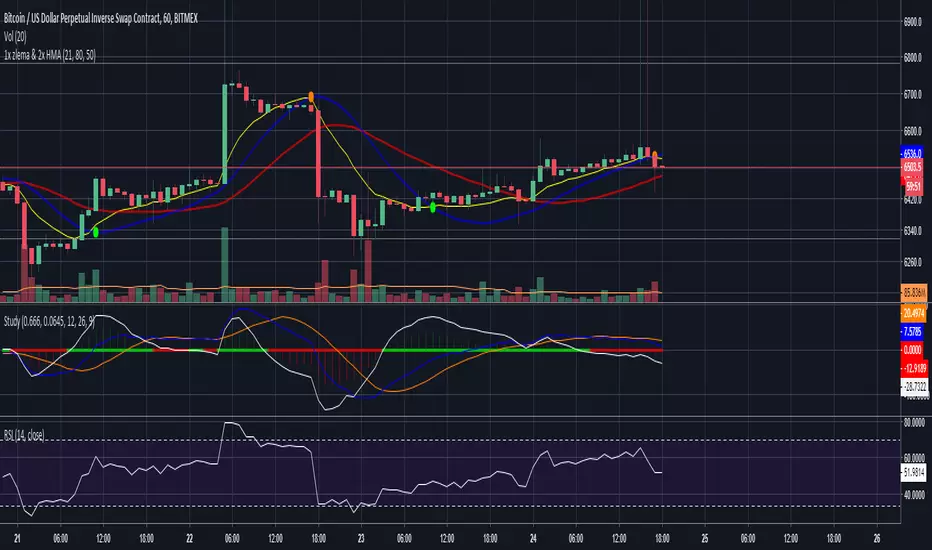
Hullfib-trailingso I add a trialing function based on volume pf the bars
this will ,ake the system more easy for the trader
1. Hull mean avreage with color changes (green -red that show the trend )
2. signal prouduce by Hull and bollinger fibs
3.signal prouduce by trailing volume bars (B , S)
4. upper and lower daily fibs
togetther you can make good combination when you bet on bitmex
have fun

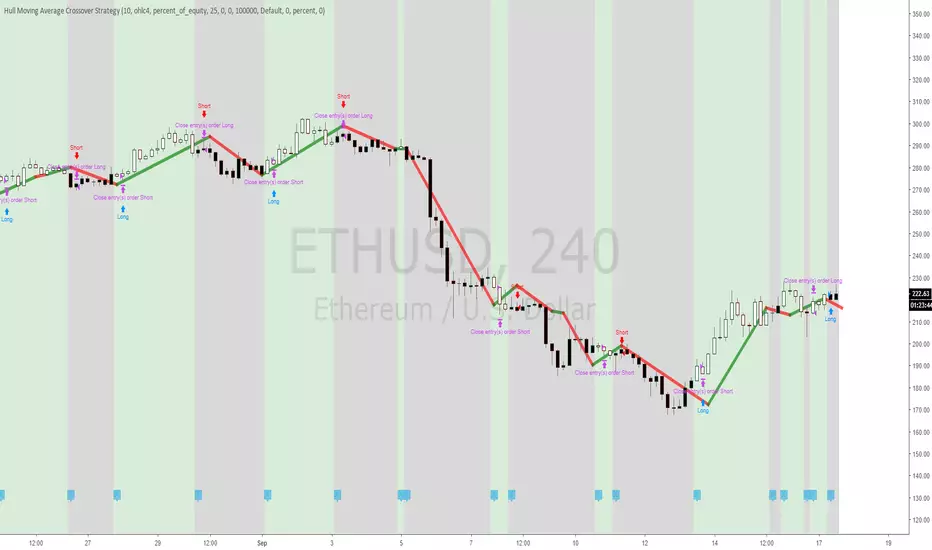
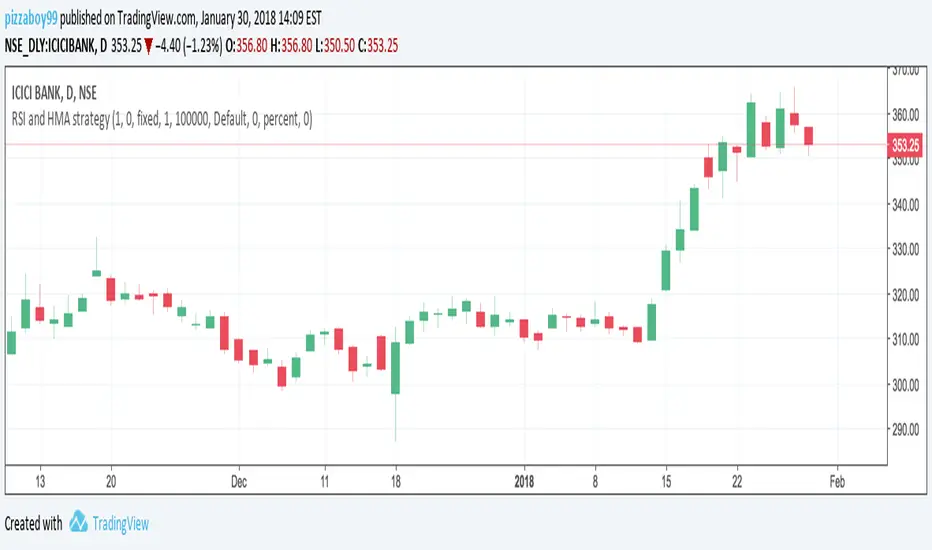
Hull Moving Average Crossover StrategyHull Moving Average Crossover, the Strategy version, so people can easily test the profitability of it.
Use Indicator version for use with Alerts

Reap Hull SMA CrossoverHi this is my first script, it is a HMA 144 crossover with SMA 5 changes background (still needs work), provides alerts for crossover


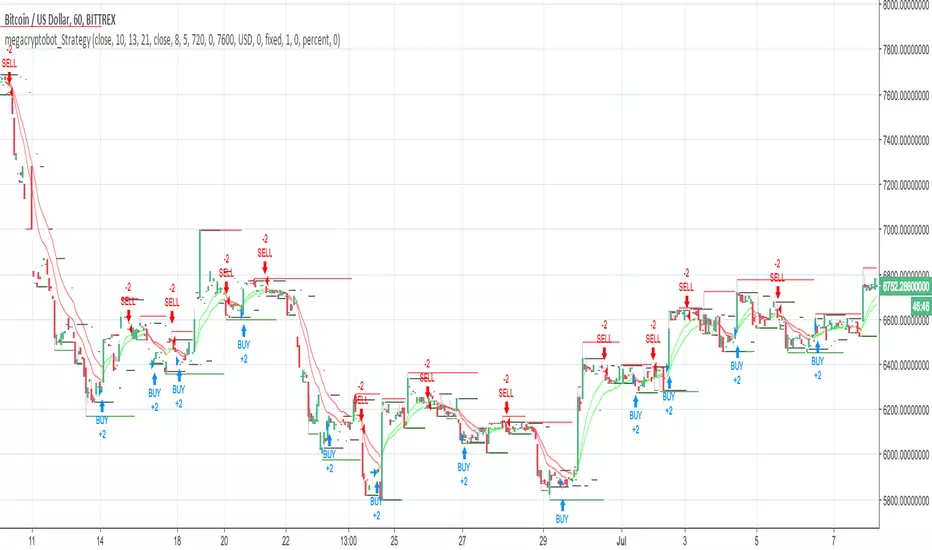
BTCbotLooks at more than just the BTC price, based off Hull MA
Attempt at reducing repaint by Averaging each candles Open-High-Low-Close and then using previous (not current) candle to calculate signal

Kozlod - 3MA strategy with SL/PT (7 MA types)Classic 3 MA strategy.
Long - Short MA crossover Medium MA and cross is above Long MA
Short - Short MA crossunder Medium MA and cross is below Long MA
You can choose one of these MA types in params:
Simple Moving Average ( SMA )
Exponential Moving Average ( EMA )
Weighted Moving Average ( WMA )
Hull Moving Average ( HMA )
Volume-weighted Moving Average ( VWMA )
Smoothed Moving Average ( SMMA )
Double Exponential Moving Average ( DEMA )
You can select SL/PT % levels.

TEMA/hullMA Ribbon with Bollinger BandsDesigned for shorted time frames.
Bollinger bands based off of TEMA as source.
Ribbon based off TEMA and hullMA divergence.
RMA used to signal Bollinger bands.
Ribbon:
pinch -> reversal
blue -> sign of possible uptrend
red -> sign of possible downtrend
Bollinger bands background:
blue -> sign of continuing uptrend
red -> sign of continuing downtrend

Hull Moving Average + Bollinger BandsThis study make use of Hull Moving Average and Bollinger Bands.
The crosses give signal about HMA and BB crossovers, they are a bit lagging, if you stare well you will spot them a little earlier. It look like a good idea to buy and sell when HMA is near or on the outside of the outer bands.
By default the Bollinger Bands uses Simple Moving Average with 21 periodes, and Hull Moving Average use 9 periodes. You can alter the settings in the format dialog.
Please use as pleased, and if you do something clever with it I'll be happy to know :D


Hull MACD with Force Index Backcolorswww.tradingview.com
Like many other indicators this tells the past and it will dutifully follow the future price changes whatever they will be.
This is an upgrade of the "Hull Moving Average Convergence/Divergence" low lag indicator in my scripts. Added Elder Force Index (background colors) to include effects of Volume.
When EFI goes positive the background goes green, when it slopes up (more positive than previous bar) it is darker green. Negative red and slope down darker red.
I find it useful in all time frames but I use mostly hour and day. The direction color combined with price action and macd tell whether the volume supports the price movement and the shading (darker green for increasing up volume and darker red for increasing down volume) tells of the degree of support.
Since when the EFI is positive and dropping, for example, the price can be dropping with opposite for negative.
Dark shading tells where the EFI and possibly the price is headed (at the moment).
Light shading says to check more on other indications for likely direction.
Changed also the histogram color so it stands out of background and added hlines to make relative volatility and peak height easier to see.
Anyway help yourself if any of this code is useful to you, enjoy, happy trading and Keep Smiling!

Decision Threshold// Hull_MA_cross & Daily_Candle_cross combination with TP$ & SL$ setting
// ( new script reducing repaint )
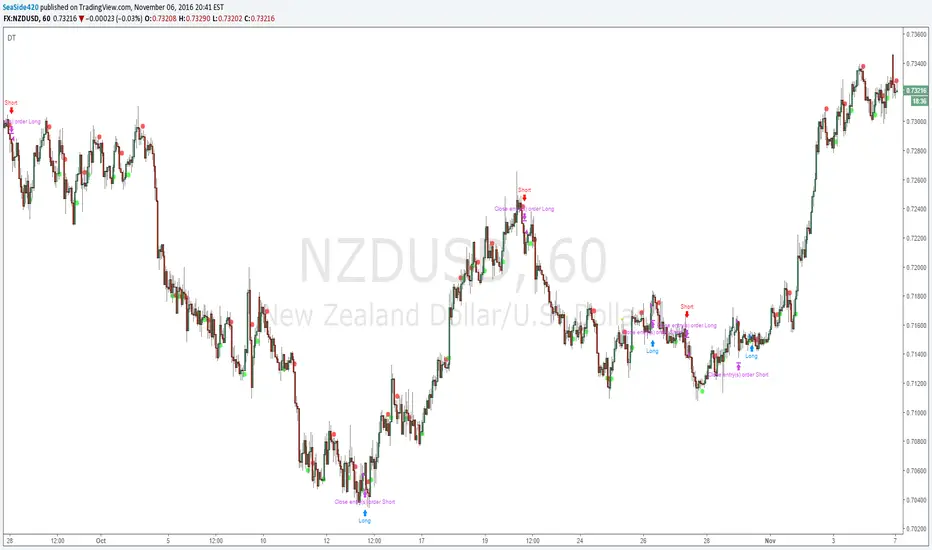
SS420FXTwo Moving_Average cross's & Daily_Candle cross
Based on Hull_MA
Developed by Alan Hull, it is an indicator, that solves the problem with making a moving average more reactive to current price activity. The Hull Moving Average almost eliminates lag and manages to improve smoothing.
The HMA manages to stick to rapid changes in price activity, as it has superior smoothing over a Simple Moving Average of the same period. The HMA employs Weighted Moving Averages (WMA) and dampens the smoothing effect. It can be calculated as follows:
HMA(n) = WMA(2*WMA(n/2) – WMA(n)), sqrt(n))
