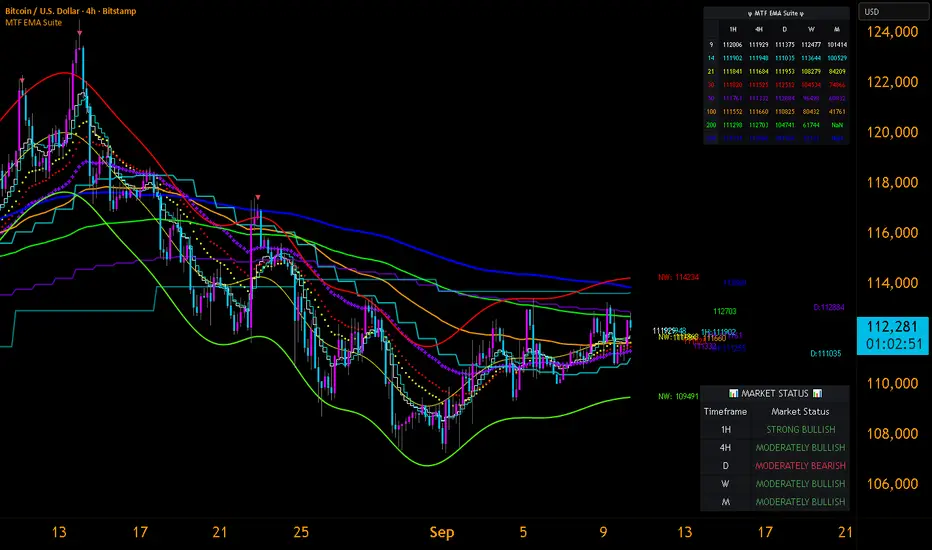
Multi-Timeframe EMA Analysis SuiteThis comprehensive multi-timeframe moving average analysis tool provides systematic trend evaluation across five configurable timeframes with advanced kernel regression envelope technology for dynamic boundary detection.
Core Innovation - Multi-Timeframe EMA System:
The primary functionality displays multiple exponential moving averages (9, 21, 30, 50, 100, 200), weighted moving average (14), and simple moving average (200) across customizable timeframes including 1H, 4H, Daily, Weekly, and Monthly periods. Each timeframe and moving average can be individually enabled or disabled based on analysis requirements.
Advanced Features:
Intelligent label positioning algorithms with automatic overlap prevention across multiple timeframes
Dynamic offset calculation maintaining readability when price levels converge
Comprehensive data table displaying all moving average values with color-coded formatting
Real-time market status evaluation categorizing conditions from "Strong Bullish" to "Strong Bearish"
Performance-optimized rendering with adjustable detail controls
Technical Implementation:
Built using Pine Script v6 with optimized multi-timeframe security requests through tuple-based data retrieval
The system implements efficient memory management and dynamic table systems for responsive chart performance during complex multi-timeframe calculations
Original developments include intelligent label spacing algorithms, dynamic offset management across timeframes, and comprehensive market status evaluation logic using moving average alignment principles
Enhanced Envelope System:
Incorporates and significantly extends the kernel regression envelope concept originally developed by LuxAlgo in their Nadaraya-Watson Envelope indicator. The mathematical foundation uses Gaussian weighting functions with substantial implementation improvements:
Complete redesign using optimized polyline rendering system for superior performance
Addition of center line calculation and visualization not present in the original
Performance optimization controls with adjustable detail levels
Enhanced label management with real-time value displays
Seamless integration with multi-timeframe analysis capabilities
Configuration Options:
Complete customization including timeframe selection, moving average lengths, envelope parameters, label positioning, table sizing, and visual styling. Users can create personalized analysis setups tailored to specific trading timeframes and analytical preferences.
Practical Applications:
Suitable for trend confirmation across multiple timeframes, identification of dynamic support and resistance levels, multi-timeframe market structure analysis, and systematic market direction evaluation
The combination of traditional moving averages with adaptive envelope boundaries provides both classical technical analysis and modern algorithmic boundary detection
Usage Instructions:
Enable desired timeframes and moving averages based on your analysis period
The envelope provides dynamic support/resistance levels while moving averages indicate directional bias. Use repainting mode for current analysis or non-repainting mode for consistent historical signals. Adjust performance settings based on system requirements and analysis detail needs
Educational Purpose:
This indicator is designed for educational and analytical purposes. Users should conduct thorough testing and validation before incorporating this tool into trading decisions.
Moving Averages
LBM-Strategy Engine Pro: The Ultimate Confluence IndicatorOverview
Welcome to the Strategy Engine Pro , the ultimate confluence indicator designed for traders who demand precision and full control over their trading signals. This is not just an indicator; it is a complete, customizable strategy-building framework.
It seamlessly integrates three powerful concepts into a single, intuitive tool:
Advanced Moving Average Trend Analysis to define the market context.
An intelligent Support & Resistance Cycle Engine to identify key price levels.
A flexible 10-rule Strategy Builder that lets you design, test, and refine your own entry signals with surgical precision.
Core Features
1. Advanced Moving Average Trend Analysis
The indicator plots 5 fully configurable Moving Averages (MAs). You can choose the Period and Type (SMA, EMA, WMA, HMA, RMA) for each one. But its true power lies in its unique color-coding system, which analyzes the slope and momentum of each MA, not just its price.
MA Color Code:
Green: The MA is in a strong, confirmed uptrend.
Red: The MA is in a strong, confirmed downtrend.
Yellow: The MA is flat or in a transitional (sideways) phase.
This provides an instant visual snapshot of the market trend across five different timeframes.
2. Support & Resistance Cycle Engine
Forget simple pivot points. This indicator incorporates a sophisticated engine that identifies and plots significant "Master Cycle" levels on your chart.
Anchored Levels: These S/R lines are persistent and intelligent. When a key resistance level is broken, it automatically "flips" and becomes the new anchored support level, and vice-versa. This accurately maps out the market's structural progression.
The Strategy Builder: Your Personal Trading Lab
This is the heart of the indicator. You have 10 sequential rules that allow you to define the exact conditions for a Buy signal. The Sell signal is generated as the logical, symmetrical opposite.
For each rule, you can configure:
Source A & Source B: Choose from a wide range of data points:
Price values: Close, Open, High, Low.
Previous candle values: Close Before, Open Before, etc.
Moving Average values: MA 1 through MA 5.
MA Trend Colors: MA 1 Color, MA 2 Color Before, etc.
Operator: Define the comparison logic:
Standard: >, <, >=, <=
Events: Crossover, Crossunder
Color Logic: Is Color, Is NOT Color, Turned Color, Ceased to be Color
Important Note on Sell Signals: Sell conditions are designed to be the symmetrical opposite of the buy conditions you create.
If Buy is Close > MA 1, Sell will be Close < MA 1.
If Buy is MA 1 Color Is Green, Sell will be MA 1 Color Is Red.
If Buy is MA 1 Color Turned Green, Sell will be MA 1 Color Turned Red.
This ensures your sell strategy mirrors the logic of your buy strategy, preventing the "inverse problem" of getting sell signals on every candle that isn't a buy signal.
Mastering the Connectors: ( ) AND and ( ) OR
The true power of the Strategy Builder lies in its connectors, which allow you to create complex, multi-layered logic. The connector on a rule defines how it connects to the next active rule.
AND & OR: These work as you'd expect, creating a continuous chain of conditions.
Rule 1 (AND) & Rule 2 is evaluated as (R1 AND R2).
( ) OR (The Group Separator): This is your most powerful tool. It acts like closing a parenthesis in an equation. It finalizes the current group of rules and connects it to the
next group with a big "OR".
Example: (R1 AND R2) OR (R3 AND R4)
This creates two possible paths for a signal.
- Rule 1: Condition R1, Connector AND
- Rule 2: Condition R2, Connector ( ) OR <-- This closes the first group and links to the next with OR.
- Rule 3: Condition R3, Connector AND
- Rule 4: Condition R4
( ) AND (The Super-Filter): This allows you to create a "master" condition that must be true in addition to other complex conditions.
Example: (R1 OR R2) AND (R3 OR R4)
This requires a condition from the first group and a condition from the second group to be true.
- Rule 1: Condition R1, Connector OR
- Rule 2: Condition R2, Connector ( ) AND <-- This closes the first OR group and links to the next with AND.
- Rule 3: Condition R3, Connector OR
- Rule 4: Condition R4
By strategically combining these connectors, you can build any logical trading scenario you can imagine. We look forward to seeing the powerful strategies the community creates with this engine.

Algorithmic Kalman Filter [CRYPTIK1]Price action is chaos. Markets are driven by high-frequency algorithms, emotional reactions, and raw speculation, creating a constant stream of noise that obscures the true underlying trend. A simple moving average is too slow, too primitive to navigate this environment effectively. It lags, it gets chopped up, and it fails when you need it most.
This script implements an Algorithmic Kalman Filter (AKF), a sophisticated signal processing algorithm adapted from aerospace and robotic guidance systems. Its purpose is singular: to strip away market noise and provide a hyper-adaptive, self-correcting estimate of an asset's true trajectory.
The Concept: An Adaptive Intelligence
Unlike a moving average that mindlessly averages past data, the Kalman Filter operates on a two-step principle: Predict and Update.
Predict: On each new bar, the filter makes a prediction of the true price based on its previous state.
Update: It then measures the error between its prediction and the actual closing price. It uses this error to intelligently correct its estimate, learning from its mistakes in real-time.
The result is a flawlessly smooth line that adapts to volatility. It remains stable during chop and reacts swiftly to new trends, giving you a crystal-clear view of the market's real intention.
How to Wield the Filter: The Core Settings
The power of the AKF lies in its two tuning parameters, which allow you to calibrate the filter's "brain" to any asset or timeframe.
Process Noise (Q) - Responsiveness: This controls how much you expect the true trend to change.
A higher Q value makes the filter more sensitive and responsive to recent price action. Use this for highly volatile assets or lower timeframes.
A lower Q value makes the filter smoother and more stable, trusting that the underlying trend is slow-moving. Use this for higher timeframes or ranging markets.
Measurement Noise (R) - Smoothness: This controls how much you trust the incoming price data.
A higher R value tells the filter that the price is extremely noisy and to be more skeptical. This results in a much smoother, slower-moving line.
A lower R value tells the filter to trust the price data more, resulting in a line that tracks price more closely.
The interaction between Q and R is what gives the filter its power. The default settings provide a solid baseline, but a true operator will fine-tune these to perfectly match the rhythm of their chosen market.
Tactical Application
The AKF is not just a line; it's a complete framework for viewing the market.
Trend Identification: The primary signal. The filter's color code provides an unambiguous definition of the trend. Teal for an uptrend, Pink for a downtrend. No more guesswork.
Dynamic Support & Resistance: The filter itself acts as a dynamic level. Watch for price to pull back and find support on a rising (Teal) filter in an uptrend, or to be rejected by a falling (Pink) filter in a downtrend.
A Higher-Order Filter: Use the AKF's trend state to filter signals from your primary strategy. For example, only take long signals when the AKF is Teal. This single rule can dramatically reduce noise and eliminate low-probability trades.
This is a professional-grade tool for traders who are serious about gaining a statistical edge. Ditch the lagging averages. Extract the signal from the noise.

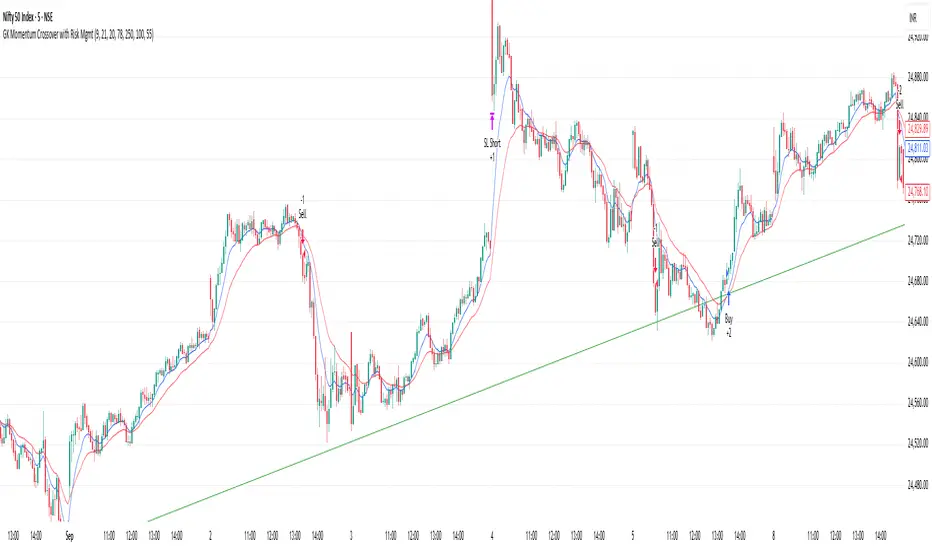
GK Momentum Crossover with Risk MgmtThe **GK Momentum Crossover with Risk Mgmt** strategy is a trend-following Pine Script v5 strategy for TradingView, trading 1 unit. It uses:
- **Entry**: Buys when the 9-period EMA crosses above the 21-period EMA (bullish) with volume above its 20-period SMA; sells when the 9-period EMA crosses below (bearish).
- **Risk Management**:
- Fixed stop loss (e.g., $10 below/above entry for long/short).
- Trailing stop activates after a $10 profit, trailing by $5.
- Optional fixed take profit (e.g., $20) is commented out.
- **Goal**: Captures trends while limiting drawdown via absolute price-based stops, suitable for stocks, forex, or crypto. Adjustable inputs for SL, TP, and trailing thresholds.
CHOCH & BOS with EMA200 with long and short signalsCHOCH & BOS with EMA200 when we have internal bos we have long or short signal

CP Double Hull CrossCakeProfits Double Hull Moving Average Signals
This indicator is a refined double Hull Moving Average system with integrated trend confirmation, cooldown suppression, alerts, and visual feedback.
🔹 Core Features
Double Hull Moving Averages (Fast & Slow) to identify precise crossovers.
Trend EMA filter (default 800 EMA) to align signals with higher-timeframe trend.
Signal Suppression / Cooldown to avoid back-to-back false signals (user-defined bars).
Long & Sort Labels plotted directly on the chart (Long = Go long, Short = Go Short).
Alerts ready for both bullish and bearish crossover confirmations.
Background Visuals (Toggle) – highlights active cooldown zones with soft green/red shades, easily switched ON/OFF.
🔹 How It Works
A Bullish Signal (Long) fires when the Fast Hull MA crosses above the Slow Hull MA, slope is confirmed, and price is above the trend EMA.
A Bearish Signal (Short) fires when the fast Hull MA crosses below the slow Hull MA, slope is confirmed, and price is below the trend EMA.
After a signal, the indicator enters a cooldown period (number of bars set by the user) where no new signals can appear, helping to reduce noise.
During cooldown, the chart background can be shaded (green for bullish, red for bearish) for quick visual confirmation.
🔹 Inputs
Hull MA Lengths (Slow & Fast)
Trend EMA Length & Source
Bars to Suppress Signals (cooldown)
Background Toggle & Colors
✅ Best used as a confirmation tool for entries/exits alongside broader strategy and risk management.
⚠️ Disclaimer: This script is for educational purposes only and not financial advice.

S76 - Multi-Indicator ComboThis custom indicator combines five powerful technical analysis tools into a single script to help you identify strong buy signals during upward price movements. It’s designed for use in both spot trading and stock markets.
1. Momentum
Calculated as the difference between the current price and the price from 14 periods ago.
A positive value indicates upward momentum — the price is gaining strength.
2. Moving Average (MA)
A 50-period Simple Moving Average (SMA).
If the price is above the MA, it suggests an uptrend is in place.
3. RSI (Relative Strength Index)
Measures whether the asset is overbought or oversold.
A value below 70 means the asset is not yet overbought — leaving room for further growth.
4. MACD
Based on the difference between two EMAs (12 and 26), plus a signal line (9-period EMA of MACD).
If MACD is above the signal line, it confirms bullish momentum.
5. Bollinger Bands
Shows volatility and potential breakout zones.
If the price breaks above the upper band, it may signal a strong upward move.
✅ Buy Signal Logic
The indicator plots a green marker below the candle when all of the following conditions are met:
Momentum > 0
Price > MA
RSI < 70
MACD > Signal Line
Price > Upper Bollinger Band
This combination suggests the price is rising with strength, in a confirmed trend, not yet overbought, and supported by volatility — a prime entry point.
📌 How to Use It
On TradingView: Add the indicator to your chart and watch for green markers as potential buy signals.
For spot and stock trading: Use it to time entries into assets like stocks, ETFs, or cryptocurrencies.
Customization: You can adjust the lengths of MA, RSI, and other components to match your trading style.

Médias Móveis 5 - SMA, EMA, Pivot Boss📈 5 Moving Averages – SMA, EMA, Pivot Boss
This indicator displays five fully customizable moving averages, allowing you to choose between:
SMA (Simple Moving Average)
EMA (Exponential Moving Average)
Pivot Boss S (SMA of Pivot Point)
Pivot Boss E (EMA of Pivot Point)
Each moving average can have its own type and length, making this tool suitable for scalping, trend-following, and multi-timeframe analysis.

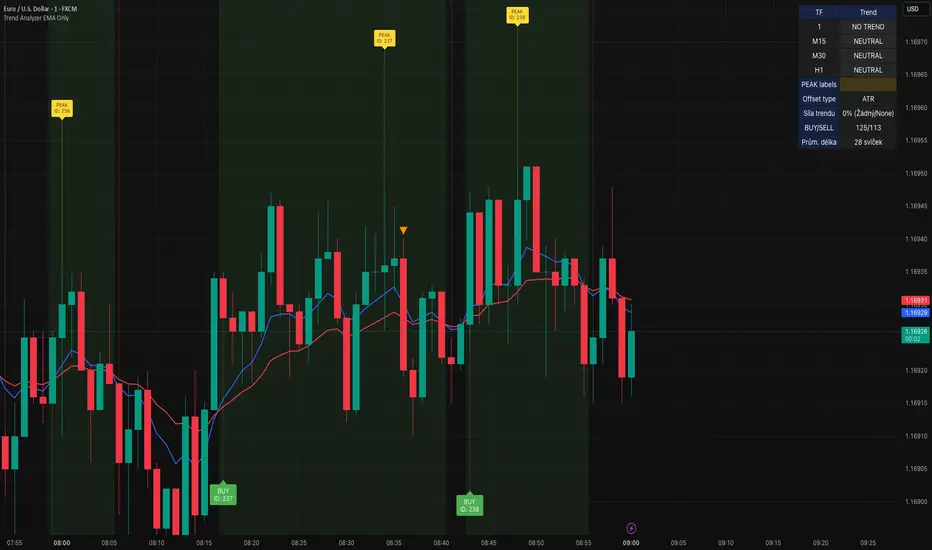
Trend Analyzer v0.6Trend Analyzer EMA Only v0.6
Simple yet powerful EMA trend analysis with multi-timeframe support!
Overview:
This comprehensive indicator focuses on EMA-based trend analysis with clean visual presentation. It provides clear BUY/SELL signals, trend tracking with unique IDs, peak detection, and multi-timeframe analysis across M15, M30, and H1 timeframes.
Key Features:
✅ EMA Trend Analysis - Fast and Slow EMA crossover signals
✅ Trend Tracking - Unique trend IDs with start/end markers
✅ Peak Detection - Automatic peak identification during trends
✅ Multi-Timeframe - Analysis across M15, M30, and H1 timeframes
✅ Visual Clarity - Dotted lines connecting labels to candles
✅ Statistics - BUY/SELL count and average trend length
How It Works:
The indicator calculates signal strength using weighted analysis:
• MACD (50%) - Primary trend momentum
• RSI (30%) - Overbought/oversold conditions
• Volume (20%) - Volume confirmation
Signal Logic:
• BUY - Fast EMA crosses above Slow EMA + both slopes positive
• SELL - Fast EMA crosses below Slow EMA + both slopes negative
• NEUTRAL - EMAs too close (below threshold)
Visual Elements:
• 🟢 BUY - Green label with trend ID
• 🔴 SELL - Red label with trend ID
• ⚪ NEUTRAL - Gray label with trend ID
• 🟡 PEAK - Yellow label marking trend extremes
• ⚫ END - Gray label marking trend end
Information Table:
Real-time display showing:
• Current Timeframe trend state
• Multi-Timeframe analysis (M15, M30, H1)
• PEAK Labels status
• Offset Type configuration
• Trend Strength percentage
• Statistics (BUY/SELL count, average trend length)
Settings:
• Fast EMA Length - 9 (default)
• Slow EMA Length - 21 (default)
• Min Trend Bars - 3 (filters short trends)
• Label Offset Type - ATR, % of price, or Dynamic
• Show PEAK Labels - On/Off toggle
Best Practices:
🎯 Works best in trending markets
📊 Use as overlay on main chart
⚡ Combine with price action analysis
🛡️ Always use proper risk management
Pro Tips:
• Green background = Strong uptrend, Red background = Strong downtrend
• Watch for trend change arrows for early reversal signals
• Use the information table for quick market assessment
• Monitor trend statistics for market behavior insights
Alerts:
• BUY Alert - "BUY signal detected"
• SELL Alert - "SELL signal detected"
Version 0.6 Improvements:
• Optimized performance
• Enhanced visual clarity
• Improved multi-timeframe analysis
• Refined trend detection algorithms
Created with ❤️ for the trading community
This indicator is free to use for both commercial and non-commercial purposes.
Buzzara// © Buzzara
// =================================
// PLEASE SUPPORT THE TEAM
// =================================
//
// Telegram: t.me
a_trade// =================================
//@version=5
VERSION = ' Buzzara2.0'
strategy('ALGOX V6_1_24', shorttitle = '🚀〄 Buzzara2.0 〄🚀'+ VERSION, overlay = true, explicit_plot_zorder = true, pyramiding = 0, default_qty_type = strategy.percent_of_equity, initial_capital = 1000, default_qty_value = 1, calc_on_every_tick = false, process_orders_on_close = true)
G_SCRIPT01 = '■ ' + 'SAIYAN OCC'
//#region ———— <↓↓↓ G_SCRIPT01 ↓↓↓> {
// === INPUTS ===
res = input.timeframe('15', 'TIMEFRAME', group ="NON REPAINT")
useRes = input(true, 'Use Alternate Signals')
intRes = input(10, 'Multiplier for Alernate Signals')
basisType = input.string('ALMA', 'MA Type: ', options= )
basisLen = input.int(50, 'MA Period', minval=1)
offsetSigma = input.int(5, 'Offset for LSMA / Sigma for ALMA', minval=0)
offsetALMA = input.float(2, 'Offset for ALMA', minval=0, step=0.01)
scolor = input(false, 'Show coloured Bars to indicate Trend?')
delayOffset = input.int(0, 'Delay Open/Close MA', minval=0, step=1,
tooltip = 'Forces Non-Repainting')
tradeType = input.string('BOTH', 'What trades should be taken : ',
options = )
//=== /INPUTS ===
h = input(false, 'Signals for Heikin Ashi Candles')
//INDICATOR SETTINGS
swing_length = input.int(10, 'Swing High/Low Length', group = 'Settings', minval = 1, maxval = 50)
history_of_demand_to_keep = input.int(20, 'History To Keep', minval = 5, maxval = 50)
box_width = input.float(2.5, 'Supply/Demand Box Width', group = 'Settings', minval = 1, maxval = 10, step = 0.5)
//INDICATOR VISUAL SETTINGS
show_zigzag = input.bool(false, 'Show Zig Zag', group = 'Visual Settings', inline = '1')
show_price_action_labels = input.bool(false, 'Show Price Action Labels', group = 'Visual Settings', inline = '2')
supply_color = input.color(#00000000, 'Supply', group = 'Visual Settings', inline = '3')
supply_outline_color = input.color(#00000000, 'Outline', group = 'Visual Settings', inline = '3')
demand_color = input.color(#00000000, 'Demand', group = 'Visual Settings', inline = '4')
demand_outline_color = input.color(#00000000, 'Outline', group = 'Visual Settings', inline = '4')
bos_label_color = input.color(#00000000, 'BOS Label', group = 'Visual Settings', inline = '5')
poi_label_color = input.color(#00000000, 'POI Label', group = 'Visual Settings', inline = '7')
poi_border_color = input.color(#00000000, 'POI border', group = 'Visual Settings', inline = '7')
swing_type_color = input.color(#00000000, 'Price Action Label', group = 'Visual Settings', inline = '8')
zigzag_color = input.color(#00000000, 'Zig Zag', group = 'Visual Settings', inline = '9')
//END SETTINGS
// FUNCTION TO ADD NEW AND REMOVE LAST IN ARRAY
f_array_add_pop(array, new_value_to_add) =>
array.unshift(array, new_value_to_add)
array.pop(array)
// FUNCTION SWING H & L LABELS
f_sh_sl_labels(array, swing_type) =>
var string label_text = na
if swing_type == 1
if array.get(array, 0) >= array.get(array, 1)
label_text := 'HH'
else
label_text := 'LH'
label.new(
bar_index - swing_length,
array.get(array,0),
text = label_text,
style = label.style_label_down,
textcolor = swing_type_color,
color = swing_type_color,
size = size.tiny)
else if swing_type == -1
if array.get(array, 0) >= array.get(array, 1)
label_text := 'HL'
else
label_text := 'LL'
label.new(
bar_index - swing_length,
array.get(array,0),
text = label_text,
style = label.style_label_up,
textcolor = swing_type_color,
color = swing_type_color,
size = size.tiny)
// FUNCTION MAKE SURE SUPPLY ISNT OVERLAPPING
f_check_overlapping(new_poi, box_array, atrValue) =>
atr_threshold = atrValue * 2
okay_to_draw = true
for i = 0 to array.size(box_array) - 1
top = box.get_top(array.get(box_array, i))
bottom = box.get_bottom(array.get(box_array, i))
poi = (top + bottom) / 2
upper_boundary = poi + atr_threshold
lower_boundary = poi - atr_threshold
if new_poi >= lower_boundary and new_poi <= upper_boundary
okay_to_draw := false
break
else
okay_to_draw := true
okay_to_draw
// FUNCTION TO DRAW SUPPLY OR DEMAND ZONE
f_supply_demand(value_array, bn_array, box_array, label_array, box_type, atrValue) =>
atr_buffer = atrValue * (box_width / 10)
box_left = array.get(bn_array, 0)
box_right = bar_index
var float box_top = 0.00
var float box_bottom = 0.00
var float poi = 0.00
if box_type == 1
box_top := array.get(value_array, 0)
box_bottom := box_top - atr_buffer
poi := (box_top + box_bottom) / 2
else if box_type == -1
box_bottom := array.get(value_array, 0)
box_top := box_bottom + atr_buffer
poi := (box_top + box_bottom) / 2
okay_to_draw = f_check_overlapping(poi, box_array, atrValue)
// okay_to_draw = true
//delete oldest box, and then create a new box and add it to the array
if box_type == 1 and okay_to_draw
box.delete( array.get(box_array, array.size(box_array) - 1) )
f_array_add_pop(box_array, box.new( left = box_left, top = box_top, right = box_right, bottom = box_bottom, border_color = supply_outline_color,
bgcolor = supply_color, extend = extend.right, text = 'SUPPLY', text_halign = text.align_center, text_valign = text.align_center, text_color = poi_label_color, text_size = size.small, xloc = xloc.bar_index))
box.delete( array.get(label_array, array.size(label_array) - 1) )
f_array_add_pop(label_array, box.new( left = box_left, top = poi, right = box_right, bottom = poi, border_color = poi_border_color,
bgcolor = poi_border_color, extend = extend.right, text = 'POI', text_halign = text.align_left, text_valign = text.align_center, text_color = poi_label_color, text_size = size.small, xloc = xloc.bar_index))
else if box_type == -1 and okay_to_draw
box.delete( array.get(box_array, array.size(box_array) - 1) )
f_array_add_pop(box_array, box.new( left = box_left, top = box_top, right = box_right, bottom = box_bottom, border_color = demand_outline_color,
bgcolor = demand_color, extend = extend.right, text = 'DEMAND', text_halign = text.align_center, text_valign = text.align_center, text_color = poi_label_color, text_size = size.small, xloc = xloc.bar_index))
box.delete( array.get(label_array, array.size(label_array) - 1) )
f_array_add_pop(label_array, box.new( left = box_left, top = poi, right = box_right, bottom = poi, border_color = poi_border_color,
bgcolor = poi_border_color, extend = extend.right, text = 'POI', text_halign = text.align_left, text_valign = text.align_center, text_color = poi_label_color, text_size = size.small, xloc = xloc.bar_index))
// FUNCTION TO CHANGE SUPPLY/DEMAND TO A BOS IF BROKEN
f_sd_to_bos(box_array, bos_array, label_array, zone_type) =>
if zone_type == 1
for i = 0 to array.size(box_array) - 1
level_to_break = box.get_top(array.get(box_array,i))
// if ta.crossover(close, level_to_break)
if close >= level_to_break
copied_box = box.copy(array.get(box_array,i))
f_array_add_pop(bos_array, copied_box)
mid = (box.get_top(array.get(box_array,i)) + box.get_bottom(array.get(box_array,i))) / 2
box.set_top(array.get(bos_array,0), mid)
box.set_bottom(array.get(bos_array,0), mid)
box.set_extend( array.get(bos_array,0), extend.none)
box.set_right( array.get(bos_array,0), bar_index)
box.set_text( array.get(bos_array,0), 'BOS' )
box.set_text_color( array.get(bos_array,0), bos_label_color)
box.set_text_size( array.get(bos_array,0), size.small)
box.set_text_halign( array.get(bos_array,0), text.align_center)
box.set_text_valign( array.get(bos_array,0), text.align_center)
box.delete(array.get(box_array, i))
box.delete(array.get(label_array, i))
if zone_type == -1
for i = 0 to array.size(box_array) - 1
level_to_break = box.get_bottom(array.get(box_array,i))
// if ta.crossunder(close, level_to_break)
if close <= level_to_break
copied_box = box.copy(array.get(box_array,i))
f_array_add_pop(bos_array, copied_box)
mid = (box.get_top(array.get(box_array,i)) + box.get_bottom(array.get(box_array,i))) / 2
box.set_top(array.get(bos_array,0), mid)
box.set_bottom(array.get(bos_array,0), mid)
box.set_extend( array.get(bos_array,0), extend.none)
box.set_right( array.get(bos_array,0), bar_index)
box.set_text( array.get(bos_array,0), 'BOS' )
box.set_text_color( array.get(bos_array,0), bos_label_color)
box.set_text_size( array.get(bos_array,0), size.small)
box.set_text_halign( array.get(bos_array,0), text.align_center)
box.set_text_valign( array.get(bos_array,0), text.align_center)
box.delete(array.get(box_array, i))
box.delete(array.get(label_array, i))
// FUNCTION MANAGE CURRENT BOXES BY CHANGING ENDPOINT
f_extend_box_endpoint(box_array) =>
for i = 0 to array.size(box_array) - 1
box.set_right(array.get(box_array, i), bar_index + 100)
//
stratRes = timeframe.ismonthly ? str.tostring(timeframe.multiplier * intRes, '###M') :
timeframe.isweekly ? str.tostring(timeframe.multiplier * intRes, '###W') :
timeframe.isdaily ? str.tostring(timeframe.multiplier * intRes, '###D') :
timeframe.isintraday ? str.tostring(timeframe.multiplier * intRes, '####') :
'60'
src = h ? request.security(ticker.heikinashi(syminfo.tickerid),
timeframe.period, close, lookahead = barmerge.lookahead_off) : close
// CALCULATE ATR
atrValue = ta.atr(50)
// CALCULATE SWING HIGHS & SWING LOWS
swing_high = ta.pivothigh(high, swing_length, swing_length)
swing_low = ta.pivotlow(low, swing_length, swing_length)
// ARRAYS FOR SWING H/L & BN
var swing_high_values = array.new_float(5,0.00)
var swing_low_values = array.new_float(5,0.00)
var swing_high_bns = array.new_int(5,0)
var swing_low_bns = array.new_int(5,0)
// ARRAYS FOR SUPPLY / DEMAND
var current_supply_box = array.new_box(history_of_demand_to_keep, na)
var current_demand_box = array.new_box(history_of_demand_to_keep, na)
// ARRAYS FOR SUPPLY / DEMAND POI LABELS
var current_supply_poi = array.new_box(history_of_demand_to_keep, na)
var current_demand_poi = array.new_box(history_of_demand_to_keep, na)
// ARRAYS FOR BOS
var supply_bos = array.new_box(5, na)
var demand_bos = array.new_box(5, na)
//END CALCULATIONS
// NEW SWING HIGH
if not na(swing_high)
//MANAGE SWING HIGH VALUES
f_array_add_pop(swing_high_values, swing_high)
f_array_add_pop(swing_high_bns, bar_index )
if show_price_action_labels
f_sh_sl_labels(swing_high_values, 1)
f_supply_demand(swing_high_values, swing_high_bns, current_supply_box, current_supply_poi, 1, atrValue)
// NEW SWING LOW
else if not na(swing_low)
//MANAGE SWING LOW VALUES
f_array_add_pop(swing_low_values, swing_low)
f_array_add_pop(swing_low_bns, bar_index )
if show_price_action_labels
f_sh_sl_labels(swing_low_values, -1)
f_supply_demand(swing_low_values, swing_low_bns, current_demand_box, current_demand_poi, -1, atrValue)
f_sd_to_bos(current_supply_box, supply_bos, current_supply_poi, 1)
f_sd_to_bos(current_demand_box, demand_bos, current_demand_poi, -1)
f_extend_box_endpoint(current_supply_box)
f_extend_box_endpoint(current_demand_box)
channelBal = input.bool(false, "Channel Balance", group = "CHART")
lr_slope(_src, _len) =>
x = 0.0, y = 0.0, x2 = 0.0, xy = 0.0
for i = 0 to _len - 1
val = _src
per = i + 1
x += per
y += val
x2 += per * per
xy += val * per
_slp = (_len * xy - x * y) / (_len * x2 - x * x)
_avg = y / _len
_int = _avg - _slp * x / _len + _slp
lr_dev(_src, _len, _slp, _avg, _int) =>
upDev = 0.0, dnDev = 0.0
val = _int
for j = 0 to _len - 1
price = high - val
if price > upDev
upDev := price
price := val - low
if price > dnDev
dnDev := price
price := _src
val += _slp
//
= ta.kc(close, 80, 10.5)
= ta.kc(close, 80, 9.5)
= ta.kc(close, 80, 8)
= ta.kc(close, 80, 3)
barsL = 10
barsR = 10
pivotHigh = fixnan(ta.pivothigh(barsL, barsR) )
pivotLow = fixnan(ta.pivotlow(barsL, barsR) )
source = close, period = 150
= lr_slope(source, period)
= lr_dev(source, period, s, a, i)
y1 = low - (ta.atr(30) * 2), y1B = low - ta.atr(30)
y2 = high + (ta.atr(30) * 2), y2B = high + ta.atr(30)
x1 = bar_index - period + 1, _y1 = i + s * (period - 1), x2 = bar_index, _y2 = i
//Functions
//Line Style function
get_line_style(style) =>
out = switch style
'???' => line.style_solid
'----' => line.style_dashed
' ' => line.style_dotted
//Function to get order block coordinates
get_coordinates(condition, top, btm, ob_val)=>
var ob_top = array.new_float(0)
var ob_btm = array.new_float(0)
var ob_avg = array.new_float(0)
var ob_left = array.new_int(0)
float ob = na
//Append coordinates to arrays
if condition
avg = math.avg(top, btm)
array.unshift(ob_top, top)
array.unshift(ob_btm, btm)
array.unshift(ob_avg, avg)
ob := ob_val
//Function to remove mitigated order blocks from coordinate arrays
remove_mitigated(ob_top, ob_btm, ob_left, ob_avg, target, bull)=>
mitigated = false
target_array = bull ? ob_btm : ob_top
for element in target_array
idx = array.indexof(target_array, element)
if (bull ? target < element : target > element)
mitigated := true
array.remove(ob_top, idx)
array.remove(ob_btm, idx)
array.remove(ob_avg, idx)
array.remove(ob_left, idx)
mitigated
//Function to set order blocks
set_order_blocks(ob_top, ob_btm, ob_left, ob_avg, ext_last, bg_css, border_css, lvl_css)=>
var ob_box = array.new_box(0)
var ob_lvl = array.new_line(0)
//Global elements
var os = 0
var target_bull = 0.
var target_bear = 0.
// Create non-repainting security function
rp_security(_symbol, _res, _src) =>
request.security(_symbol, _res, _src )
htfHigh = rp_security(syminfo.tickerid, res, high)
htfLow = rp_security(syminfo.tickerid, res, low)
// Main Indicator
// Functions
smoothrng(x, t, m) =>
wper = t * 2 - 1
avrng = ta.ema(math.abs(x - x ), t)
smoothrng = ta.ema(avrng, wper) * m
rngfilt(x, r) =>
rngfilt = x
rngfilt := x > nz(rngfilt ) ? x - r < nz(rngfilt ) ? nz(rngfilt ) : x - r : x + r > nz(rngfilt ) ? nz(rngfilt ) : x + r
percWidth(len, perc) => (ta.highest(len) - ta.lowest(len)) * perc / 100
securityNoRep(sym, res, src) => request.security(sym, res, src, barmerge.gaps_off, barmerge.lookahead_on)
swingPoints(prd) =>
pivHi = ta.pivothigh(prd, prd)
pivLo = ta.pivotlow (prd, prd)
last_pivHi = ta.valuewhen(pivHi, pivHi, 1)
last_pivLo = ta.valuewhen(pivLo, pivLo, 1)
hh = pivHi and pivHi > last_pivHi ? pivHi : na
lh = pivHi and pivHi < last_pivHi ? pivHi : na
hl = pivLo and pivLo > last_pivLo ? pivLo : na
ll = pivLo and pivLo < last_pivLo ? pivLo : na
f_chartTfInMinutes() =>
float _resInMinutes = timeframe.multiplier * (
timeframe.isseconds ? 1 :
timeframe.isminutes ? 1. :
timeframe.isdaily ? 60. * 24 :
timeframe.isweekly ? 60. * 24 * 7 :
timeframe.ismonthly ? 60. * 24 * 30.4375 : na)
f_kc(src, len, sensitivity) =>
basis = ta.sma(src, len)
span = ta.atr(len)
wavetrend(src, chlLen, avgLen) =>
esa = ta.ema(src, chlLen)
d = ta.ema(math.abs(src - esa), chlLen)
ci = (src - esa) / (0.015 * d)
wt1 = ta.ema(ci, avgLen)
wt2 = ta.sma(wt1, 3)
f_top_fractal(_src) => _src < _src and _src < _src and _src > _src and _src > _src
f_bot_fractal(_src) => _src > _src and _src > _src and _src < _src and _src < _src
top_fractal = f_top_fractal(src)
bot_fractal = f_bot_fractal(src)
f_fractalize (_src) => top_fractal ? 1 : bot_fractal ? -1 : 0
f_findDivs(src, topLimit, botLimit) =>
fractalTop = f_fractalize(src) > 0 and src >= topLimit ? src : na
fractalBot = f_fractalize(src) < 0 and src <= botLimit ? src : na
highPrev = ta.valuewhen(fractalTop, src , 0)
highPrice = ta.valuewhen(fractalTop, high , 0)
lowPrev = ta.valuewhen(fractalBot, src , 0)
lowPrice = ta.valuewhen(fractalBot, low , 0)
bearSignal = fractalTop and high > highPrice and src < highPrev
bullSignal = fractalBot and low < lowPrice and src > lowPrev
// Get user input
enableSR = input(false , "SR On/Off", group="SR")
colorSup = input(#00000000 , "Support Color", group="SR")
colorRes = input(#00000000 , "Resistance Color", group="SR")
strengthSR = input.int(2 , "S/R Strength", 1, group="SR")
lineStyle = input.string("Dotted", "Line Style", , group="SR")
lineWidth = input.int(2 , "S/R Line Width", 1, group="SR")
useZones = input(true , "Zones On/Off", group="SR")
useHLZones = input(true , "High Low Zones On/Off", group="SR")
zoneWidth = input.int(2 , "Zone Width %", 0,
tooltip = "it's calculated using % of the distance between highest/lowest in last 300 bars", group="SR")
expandSR = input(true , "Expand SR")
// Get components
rb = 10
prd = 284
ChannelW = 10
label_loc = 55
style = lineStyle == "Solid" ? line.style_solid :
lineStyle == "Dotted" ? line.style_dotted : line.style_dashed
ph = ta.pivothigh(rb, rb)
pl = ta.pivotlow (rb, rb)
sr_levels = array.new_float(21, na)
prdhighest = ta.highest(prd)
prdlowest = ta.lowest(prd)
cwidth = percWidth(prd, ChannelW)
zonePerc = percWidth(300, zoneWidth)
aas = array.new_bool(41, true)
u1 = 0.0, u1 := nz(u1 )
d1 = 0.0, d1 := nz(d1 )
highestph = 0.0, highestph := highestph
lowestpl = 0.0, lowestpl := lowestpl
var sr_levs = array.new_float(21, na)
label hlabel = na, label.delete(hlabel )
label llabel = na, label.delete(llabel )
var sr_lines = array.new_line(21, na)
var sr_linesH = array.new_line(21, na)
var sr_linesL = array.new_line(21, na)
var sr_linesF = array.new_linefill(21, na)
var sr_labels = array.new_label(21, na)
if (not na(ph) or not na(pl))
for x = 0 to array.size(sr_levels) - 1
array.set(sr_levels, x, na)
highestph := prdlowest
lowestpl := prdhighest
countpp = 0
for x = 0 to prd
if na(close )
break
if not na(ph ) or not na(pl )
highestph := math.max(highestph, nz(ph , prdlowest), nz(pl , prdlowest))
lowestpl := math.min(lowestpl, nz(ph , prdhighest), nz(pl , prdhighest))
countpp += 1
if countpp > 40
break
if array.get(aas, countpp)
upl = (not na(ph ) and (ph != 0) ? high : low ) + cwidth
dnl = (not na(ph ) and (ph != 0) ? high : low ) - cwidth
u1 := countpp == 1 ? upl : u1
d1 := countpp == 1 ? dnl : d1
tmp = array.new_bool(41, true)
cnt = 0
tpoint = 0
for xx = 0 to prd
if na(close )
break
if not na(ph ) or not na(pl )
chg = false
cnt += 1
if cnt > 40
break
if array.get(aas, cnt)
if not na(ph )
if high <= upl and high >= dnl
tpoint += 1
chg := true
if not na(pl )
if low <= upl and low >= dnl
tpoint += 1
chg := true
if chg and cnt < 41
array.set(tmp, cnt, false)
if tpoint >= strengthSR
for g = 0 to 40 by 1
if not array.get(tmp, g)
array.set(aas, g, false)
if (not na(ph ) and countpp < 21)
array.set(sr_levels, countpp, high )
if (not na(pl ) and countpp < 21)
array.set(sr_levels, countpp, low )
// Plot
var line highest_ = na, line.delete(highest_)
var line lowest_ = na, line.delete(lowest_)
var line highest_fill1 = na, line.delete(highest_fill1)
var line highest_fill2 = na, line.delete(highest_fill2)
var line lowest_fill1 = na, line.delete(lowest_fill1)
var line lowest_fill2 = na, line.delete(lowest_fill2)
hi_col = close >= highestph ? colorSup : colorRes
lo_col = close >= lowestpl ? colorSup : colorRes
if enableSR
highest_ := line.new(bar_index - 311, highestph, bar_index, highestph, xloc.bar_index, expandSR ? extend.both : extend.right, hi_col, style, lineWidth)
lowest_ := line.new(bar_index - 311, lowestpl , bar_index, lowestpl , xloc.bar_index, expandSR ? extend.both : extend.right, lo_col, style, lineWidth)
if useHLZones
highest_fill1 := line.new(bar_index - 311, highestph + zonePerc, bar_index, highestph + zonePerc, xloc.bar_index, expandSR ? extend.both : extend.right, na)
highest_fill2 := line.new(bar_index - 311, highestph - zonePerc, bar_index, highestph - zonePerc, xloc.bar_index, expandSR ? extend.both : extend.right, na)
lowest_fill1 := line.new(bar_index - 311, lowestpl + zonePerc , bar_index, lowestpl + zonePerc , xloc.bar_index, expandSR ? extend.both : extend.right, na)
lowest_fill2 := line.new(bar_index - 311, lowestpl - zonePerc , bar_index, lowestpl - zonePerc , xloc.bar_index, expandSR ? extend.both : extend.right, na)
linefill.new(highest_fill1, highest_fill2, hi_col)
linefill.new(lowest_fill1 , lowest_fill2 , lo_col)
if (not na(ph) or not na(pl))
for x = 0 to array.size(sr_lines) - 1
array.set(sr_levs, x, array.get(sr_levels, x))
for x = 0 to array.size(sr_lines) - 1
line.delete(array.get(sr_lines, x))
line.delete(array.get(sr_linesH, x))
line.delete(array.get(sr_linesL, x))
linefill.delete(array.get(sr_linesF, x))
if (not na(array.get(sr_levs, x)) and enableSR)
line_col = close >= array.get(sr_levs, x) ? colorSup : colorRes
array.set(sr_lines, x, line.new(bar_index - 355, array.get(sr_levs, x), bar_index, array.get(sr_levs, x), xloc.bar_index, expandSR ? extend.both : extend.right, line_col, style, lineWidth))
if useZones
array.set(sr_linesH, x, line.new(bar_index - 355, array.get(sr_levs, x) + zonePerc, bar_index, array.get(sr_levs, x) + zonePerc, xloc.bar_index, expandSR ? extend.both : extend.right, na))
array.set(sr_linesL, x, line.new(bar_index - 355, array.get(sr_levs, x) - zonePerc, bar_index, array.get(sr_levs, x) - zonePerc, xloc.bar_index, expandSR ? extend.both : extend.right, na))
array.set(sr_linesF, x, linefill.new(array.get(sr_linesH, x), array.get(sr_linesL, x), line_col))
for x = 0 to array.size(sr_labels) - 1
label.delete(array.get(sr_labels, x))
if (not na(array.get(sr_levs, x)) and enableSR)
lab_loc = close >= array.get(sr_levs, x) ? label.style_label_up : label.style_label_down
lab_col = close >= array.get(sr_levs, x) ? colorSup : colorRes
array.set(sr_labels, x, label.new(bar_index + label_loc, array.get(sr_levs, x), str.tostring(math.round_to_mintick(array.get(sr_levs, x))), color=lab_col , textcolor=#000000, style=lab_loc))
hlabel := enableSR ? label.new(bar_index + label_loc + math.round(math.sign(label_loc)) * 20, highestph, "High Level : " + str.tostring(highestph), color=hi_col, textcolor=#000000, style=label.style_label_down) : na
llabel := enableSR ? label.new(bar_index + label_loc + math.round(math.sign(label_loc)) * 20, lowestpl , "Low Level : " + str.tostring(lowestpl) , color=lo_col, textcolor=#000000, style=label.style_label_up ) : na
// Get components
rsi = ta.rsi(close, 28)
//rsiOb = rsi > 78 and rsi > ta.ema(rsi, 10)
//rsiOs = rsi < 27 and rsi < ta.ema(rsi, 10)
rsiOb = rsi > 65 and rsi > ta.ema(rsi, 10)
rsiOs = rsi < 35 and rsi < ta.ema(rsi, 10)
dHigh = securityNoRep(syminfo.tickerid, "D", high )
dLow = securityNoRep(syminfo.tickerid, "D", low )
dClose = securityNoRep(syminfo.tickerid, "D", close )
ema = ta.ema(close, 144)
emaBull = close > ema
equal_tf(res) => str.tonumber(res) == f_chartTfInMinutes() and not timeframe.isseconds
higher_tf(res) => str.tonumber(res) > f_chartTfInMinutes() or timeframe.isseconds
too_small_tf(res) => (timeframe.isweekly and res=="1") or (timeframe.ismonthly and str.tonumber(res) < 10)
securityNoRep1(sym, res, src) =>
bool bull_ = na
bull_ := equal_tf(res) ? src : bull_
bull_ := higher_tf(res) ? request.security(sym, res, src, barmerge.gaps_off, barmerge.lookahead_on) : bull_
bull_array = request.security_lower_tf(syminfo.tickerid, higher_tf(res) ? str.tostring(f_chartTfInMinutes()) + (timeframe.isseconds ? "S" : "") : too_small_tf(res) ? (timeframe.isweekly ? "3" : "10") : res, src)
if array.size(bull_array) > 1 and not equal_tf(res) and not higher_tf(res)
bull_ := array.pop(bull_array)
array.clear(bull_array)
bull_
// === BASE FUNCTIONS ===
// Returns MA input selection variant, default to SMA if blank or typo.
variant(type, src, len, offSig, offALMA) =>
v1 = ta.sma(src, len) // Simple
v2 = ta.ema(src, len) // Exponential
v3 = 2 * v2 - ta.ema(v2, len) // Double Exponential
v4 = 3 * (v2 - ta.ema(v2, len)) + ta.ema(ta.ema(v2, len), len) // Triple Exponential
v5 = ta.wma(src, len) // Weighted
v6 = ta.vwma(src, len) // Volume Weighted
v7 = 0.0
sma_1 = ta.sma(src, len) // Smoothed
v7 := na(v7 ) ? sma_1 : (v7 * (len - 1) + src) / len
v8 = ta.wma(2 * ta.wma(src, len / 2) - ta.wma(src, len), math.round(math.sqrt(len))) // Hull
v9 = ta.linreg(src, len, offSig) // Least Squares
v10 = ta.alma(src, len, offALMA, offSig) // Arnaud Legoux
v11 = ta.sma(v1, len) // Triangular (extreme smooth)
// SuperSmoother filter
// 2013 John F. Ehlers
a1 = math.exp(-1.414 * 3.14159 / len)
b1 = 2 * a1 * math.cos(1.414 * 3.14159 / len)
c2 = b1
c3 = -a1 * a1
c1 = 1 - c2 - c3
v12 = 0.0
v12 := c1 * (src + nz(src )) / 2 + c2 * nz(v12 ) + c3 * nz(v12 )
type == 'EMA' ? v2 : type == 'DEMA' ? v3 : type == 'TEMA' ? v4 : type == 'WMA' ? v5 : type == 'VWMA' ? v6 : type == 'SMMA' ? v7 : type == 'HullMA' ? v8 : type == 'LSMA' ? v9 : type == 'ALMA' ? v10 : type == 'TMA' ? v11 : type == 'SSMA' ? v12 : v1
// security wrapper for repeat calls
reso(exp, use, res) =>
security_1 = request.security(syminfo.tickerid, res, exp, gaps = barmerge.gaps_off, lookahead = barmerge.lookahead_on)
use ? security_1 : exp
// === /BASE FUNCTIONS ===
// === SERIES SETUP ===
closeSeries = variant(basisType, close , basisLen, offsetSigma, offsetALMA)
openSeries = variant(basisType, open , basisLen, offsetSigma, offsetALMA)
// === /SERIES ===
// Get Alternate resolution Series if selected.
closeSeriesAlt = reso(closeSeries, useRes, stratRes)
openSeriesAlt = reso(openSeries, useRes, stratRes)
//
lxTrigger = false
sxTrigger = false
leTrigger = ta.crossover (closeSeriesAlt, openSeriesAlt)
seTrigger = ta.crossunder(closeSeriesAlt, openSeriesAlt)
G_RISK = '■ ' + 'Risk Management'
//#region ———— <↓↓↓ G_RISK ↓↓↓> {
// ———————————
//Tooltip
T_LVL = '(%) Exit Level'
T_QTY = '(%) Adjust trade exit volume'
T_MSG = 'Paste JSON message for your bot'
//Webhook Message
O_LEMSG = 'Long Entry'
O_LXMSGSL = 'Long SL'
O_LXMSGTP1 = 'Long TP1'
O_LXMSGTP2 = 'Long TP2'
O_LXMSGTP3 = 'Long TP3'
O_LXMSG = 'Long Exit'
O_SEMSG = 'Short Entry'
O_SXMSGSL = 'Short SL'
O_SXMSGA = 'Short TP1'
O_SXMSGB = 'Short TP2'
O_SXMSGC = 'Short TP3'
O_SXMSGX = 'Short Exit'
// ——————————— | | | Line length guide |
i_lxLvlTP1 = input.float (0.2, 'Level TP1' , group = G_RISK,
tooltip = T_LVL)
i_lxQtyTP1 = input.float (80.0, 'Qty TP1' , group = G_RISK,
tooltip = T_QTY)
i_lxLvlTP2 = input.float (0.5, 'Level TP2' , group = G_RISK,
tooltip = T_LVL)
i_lxQtyTP2 = input.float (10.0, 'Qty TP2' , group = G_RISK,
tooltip = T_QTY)
i_lxLvlTP3 = input.float (7.0, 'Level TP3' , group = G_RISK,
tooltip = T_LVL)
i_lxQtyTP3 = input.float (2, 'Qty TP3' , group = G_RISK,
tooltip = T_QTY)
i_lxLvlSL = input.float (0.5, 'Stop Loss' , group = G_RISK,
tooltip = T_LVL)
i_sxLvlTP1 = i_lxLvlTP1
i_sxQtyTP1 = i_lxQtyTP1
i_sxLvlTP2 = i_lxLvlTP2
i_sxQtyTP2 = i_lxQtyTP2
i_sxLvlTP3 = i_lxLvlTP3
i_sxQtyTP3 = i_lxQtyTP3
i_sxLvlSL = i_lxLvlSL
G_MSG = '■ ' + 'Webhook Message'
i_leMsg = input.string (O_LEMSG ,'Long Entry' , group = G_MSG, tooltip = T_MSG)
i_lxMsgSL = input.string (O_LXMSGSL ,'Long SL' , group = G_MSG, tooltip = T_MSG)
i_lxMsgTP1 = input.string (O_LXMSGTP1,'Long TP1' , group = G_MSG, tooltip = T_MSG)
i_lxMsgTP2 = input.string (O_LXMSGTP2,'Long TP2' , group = G_MSG, tooltip = T_MSG)
i_lxMsgTP3 = input.string (O_LXMSGTP3,'Long TP3' , group = G_MSG, tooltip = T_MSG)
i_lxMsg = input.string (O_LXMSG ,'Long Exit' , group = G_MSG, tooltip = T_MSG)
i_seMsg = input.string (O_SEMSG ,'Short Entry' , group = G_MSG, tooltip = T_MSG)
i_sxMsgSL = input.string (O_SXMSGSL ,'Short SL' , group = G_MSG, tooltip = T_MSG)
i_sxMsgTP1 = input.string (O_SXMSGA ,'Short TP1' , group = G_MSG, tooltip = T_MSG)
i_sxMsgTP2 = input.string (O_SXMSGB ,'Short TP2' , group = G_MSG, tooltip = T_MSG)
i_sxMsgTP3 = input.string (O_SXMSGC ,'Short TP3' , group = G_MSG, tooltip = T_MSG)
i_sxMsg = input.string (O_SXMSGX ,'Short Exit' , group = G_MSG, tooltip = T_MSG)
i_src = close
G_DISPLAY = 'Display'
//
i_alertOn = input.bool (true, 'Alert Labels On/Off' , group = G_DISPLAY)
i_barColOn = input.bool (true, 'Bar Color On/Off' , group = G_DISPLAY)
// ———————————
// @function Calculate the Take Profit line, and the crossover or crossunder
f_tp(_condition, _conditionValue, _leTrigger, _seTrigger, _src, _lxLvlTP, _sxLvlTP)=>
var float _tpLine = 0.0
_topLvl = _src + (_src * (_lxLvlTP / 100))
_botLvl = _src - (_src * (_sxLvlTP / 100))
_tpLine := _condition != _conditionValue and _leTrigger ? _topLvl :
_condition != -_conditionValue and _seTrigger ? _botLvl :
nz(_tpLine )
// @function Similar to "ta.crossover" or "ta.crossunder"
f_cross(_scr1, _scr2, _over)=>
_cross = _over ? _scr1 > _scr2 and _scr1 < _scr2 :
_scr1 < _scr2 and _scr1 > _scr2
// ———————————
//
var float condition = 0.0
var float slLine = 0.0
var float entryLine = 0.0
//
entryLine := leTrigger and condition <= 0.0 ? close :
seTrigger and condition >= 0.0 ? close : nz(entryLine )
//
slTopLvl = i_src + (i_src * (i_lxLvlSL / 100))
slBotLvl = i_src - (i_src * (i_sxLvlSL / 100))
slLine := condition <= 0.0 and leTrigger ? slBotLvl :
condition >= 0.0 and seTrigger ? slTopLvl : nz(slLine )
slLong = f_cross(low, slLine, false)
slShort = f_cross(high, slLine, true )
//
= f_tp(condition, 1.2,leTrigger, seTrigger, i_src, i_lxLvlTP3, i_sxLvlTP3)
= f_tp(condition, 1.1,leTrigger, seTrigger, i_src, i_lxLvlTP2, i_sxLvlTP2)
= f_tp(condition, 1.0,leTrigger, seTrigger, i_src, i_lxLvlTP1, i_sxLvlTP1)
tp3Long = f_cross(high, tp3Line, true )
tp3Short = f_cross(low, tp3Line, false)
tp2Long = f_cross(high, tp2Line, true )
tp2Short = f_cross(low, tp2Line, false)
tp1Long = f_cross(high, tp1Line, true )
tp1Short = f_cross(low, tp1Line, false)
switch
leTrigger and condition <= 0.0 => condition := 1.0
seTrigger and condition >= 0.0 => condition := -1.0
tp3Long and condition == 1.2 => condition := 1.3
tp3Short and condition == -1.2 => condition := -1.3
tp2Long and condition == 1.1 => condition := 1.2
tp2Short and condition == -1.1 => condition := -1.2
tp1Long and condition == 1.0 => condition := 1.1
tp1Short and condition == -1.0 => condition := -1.1
slLong and condition >= 1.0 => condition := 0.0
slShort and condition <= -1.0 => condition := 0.0
lxTrigger and condition >= 1.0 => condition := 0.0
sxTrigger and condition <= -1.0 => condition := 0.0
longE = leTrigger and condition <= 0.0 and condition == 1.0
shortE = seTrigger and condition >= 0.0 and condition == -1.0
longX = lxTrigger and condition >= 1.0 and condition == 0.0
shortX = sxTrigger and condition <= -1.0 and condition == 0.0
longSL = slLong and condition >= 1.0 and condition == 0.0
shortSL = slShort and condition <= -1.0 and condition == 0.0
longTP3 = tp3Long and condition == 1.2 and condition == 1.3
shortTP3 = tp3Short and condition == -1.2 and condition == -1.3
longTP2 = tp2Long and condition == 1.1 and condition == 1.2
shortTP2 = tp2Short and condition == -1.1 and condition == -1.2
longTP1 = tp1Long and condition == 1.0 and condition == 1.1
shortTP1 = tp1Short and condition == -1.0 and condition == -1.1
// ——————————— {
//
if strategy.position_size <= 0 and longE and barstate.isconfirmed
strategy.entry(
'Long',
strategy.long,
alert_message = i_leMsg,
comment = 'LE')
if strategy.position_size > 0 and condition == 1.0
strategy.exit(
id = 'LXTP1',
from_entry = 'Long',
qty_percent = i_lxQtyTP1,
limit = tp1Line,
stop = slLine,
comment_profit = 'LXTP1',
comment_loss = 'SL',
alert_profit = i_lxMsgTP1,
alert_loss = i_lxMsgSL)
if strategy.position_size > 0 and condition == 1.1
strategy.exit(
id = 'LXTP2',
from_entry = 'Long',
qty_percent = i_lxQtyTP2,
limit = tp2Line,
stop = slLine,
comment_profit = 'LXTP2',
comment_loss = 'SL',
alert_profit = i_lxMsgTP2,
alert_loss = i_lxMsgSL)
if strategy.position_size > 0 and condition == 1.2
strategy.exit(
id = 'LXTP3',
from_entry = 'Long',
qty_percent = i_lxQtyTP3,
limit = tp3Line,
stop = slLine,
comment_profit = 'LXTP3',
comment_loss = 'SL',
alert_profit = i_lxMsgTP3,
alert_loss = i_lxMsgSL)
if longX
strategy.close(
'Long',
alert_message = i_lxMsg,
comment = 'LX')
//
if strategy.position_size >= 0 and shortE and barstate.isconfirmed
strategy.entry(
'Short',
strategy.short,
alert_message = i_leMsg,
comment = 'SE')
if strategy.position_size < 0 and condition == -1.0
strategy.exit(
id = 'SXTP1',
from_entry = 'Short',
qty_percent = i_sxQtyTP1,
limit = tp1Line,
stop = slLine,
comment_profit = 'SXTP1',
comment_loss = 'SL',
alert_profit = i_sxMsgTP1,
alert_loss = i_sxMsgSL)
if strategy.position_size < 0 and condition == -1.1
strategy.exit(
id = 'SXTP2',
from_entry = 'Short',
qty_percent = i_sxQtyTP2,
limit = tp2Line,
stop = slLine,
comment_profit = 'SXTP2',
comment_loss = 'SL',
alert_profit = i_sxMsgTP2,
alert_loss = i_sxMsgSL)
if strategy.position_size < 0 and condition == -1.2
strategy.exit(
id = 'SXTP3',
from_entry = 'Short',
qty_percent = i_sxQtyTP3,
limit = tp3Line,
stop = slLine,
comment_profit = 'SXTP3',
comment_loss = 'SL',
alert_profit = i_sxMsgTP3,
alert_loss = i_sxMsgSL)
if shortX
strategy.close(
'Short',
alert_message = i_sxMsg,
comment = 'SX')
// ———————————
c_tp = leTrigger or seTrigger ? na :
condition == 0.0 ? na : color.green
c_entry = leTrigger or seTrigger ? na :
condition == 0.0 ? na : color.blue
c_sl = leTrigger or seTrigger ? na :
condition == 0.0 ? na : color.red
p_tp1Line = plot (
condition == 1.0 or
condition == -1.0 ? tp1Line : na,
title = "TP Line 1",
color = c_tp,
linewidth = 1,
style = plot.style_linebr)
p_tp2Line = plot (
condition == 1.0 or
condition == -1.0 or
condition == 1.1 or
condition == -1.1 ? tp2Line : na,
title = "TP Line 2",
color = c_tp,
linewidth = 1,
style = plot.style_linebr)
p_tp3Line = plot (
condition == 1.0 or
condition == -1.0 or
condition == 1.1 or
condition == -1.1 or
condition == 1.2 or
condition == -1.2 ? tp3Line : na,
title = "TP Line 3",
color = c_tp,
linewidth = 1,
style = plot.style_linebr)
p_entryLine = plot (
condition >= 1.0 or
condition <= -1.0 ? entryLine : na,
title = "Entry Line",
color = c_entry,
linewidth = 1,
style = plot.style_linebr)
p_slLine = plot (
condition == 1.0 or
condition == -1.0 or
condition == 1.1 or
condition == -1.1 or
condition == 1.2 or
condition == -1.2 ? slLine : na,
title = "SL Line",
color = c_sl,
linewidth = 1,
style = plot.style_linebr)
fill(
p_tp3Line, p_entryLine,
color = leTrigger or seTrigger ? na :color.new(color.green, 90))
fill(
p_entryLine, p_slLine,
color = leTrigger or seTrigger ? na :color.new(color.red, 90))
//
plotshape(
i_alertOn and longE,
title = 'Long',
text = 'Long',
textcolor = color.white,
color = color.green,
style = shape.labelup,
size = size.tiny,
location = location.belowbar)
plotshape(
i_alertOn and shortE,
title = 'Short',
text = 'Short',
textcolor = color.white,
color = color.red,
style = shape.labeldown,
size = size.tiny,
location = location.abovebar)
plotshape(
i_alertOn and (longX or shortX) ? close : na,
title = 'Close',
text = 'Close',
textcolor = color.white,
color = color.gray,
style = shape.labelup,
size = size.tiny,
location = location.absolute)
l_tp = i_alertOn and (longTP1 or shortTP1) ? close : na
plotshape(
l_tp,
title = "TP1 Cross",
text = "TP1",
textcolor = color.white,
color = color.olive,
style = shape.labelup,
size = size.tiny,
location = location.absolute)
plotshape(
i_alertOn and (longTP2 or shortTP2) ? close : na,
title = "TP2 Cross",
text = "TP2",
textcolor = color.white,
color = color.olive,
style = shape.labelup,
size = size.tiny,
location = location.absolute)
plotshape(
i_alertOn and (longTP3 or shortTP3) ? close : na,
title = "TP3 Cross",
text = "TP3",
textcolor = color.white,
color = color.olive,
style = shape.labelup,
size = size.tiny,
location = location.absolute)
plotshape(
i_alertOn and (longSL or shortSL) ? close : na,
title = "SL Cross",
text = "SL",
textcolor = color.white,
color = color.maroon,
style = shape.labelup,
size = size.tiny,
location = location.absolute)
//
plot(
na,
title = "─── ───",
editable = false,
display = display.data_window)
plot(
condition,
title = "condition",
editable = false,
display = display.data_window)
plot(
strategy.position_size * 100,
title = ".position_size",
editable = false,
display = display.data_window)
//#endregion }
// ——————————— <↑↑↑ G_RISK ↑↑↑>
//#region ———— <↓↓↓ G_SCRIPT02 ↓↓↓> {
// @function Queues a new element in an array and de-queues its first element.
f_qDq(_array, _val) =>
array.push(_array, _val)
_return = array.shift(_array)
_return
var line a_slLine = array.new_line(1)
var line a_entryLine = array.new_line(1)
var line a_tp3Line = array.new_line(1)
var line a_tp2Line = array.new_line(1)
var line a_tp1Line = array.new_line(1)
var label a_slLabel = array.new_label(1)
var label a_tp3label = array.new_label(1)
var label a_tp2label = array.new_label(1)
var label a_tp1label = array.new_label(1)
var label a_entryLabel = array.new_label(1)
newEntry = longE or shortE
entryIndex = 1
entryIndex := newEntry ? bar_index : nz(entryIndex )
lasTrade = bar_index >= entryIndex
l_right = 10
line.delete(
f_qDq(a_slLine,
line.new(
entryIndex,
slLine,
last_bar_index + l_right,
slLine,
style = line.style_solid,
color = c_sl)))
line.delete(
f_qDq(a_entryLine,
line.new(
entryIndex,
entryLine,
last_bar_index + l_right,
entryLine,
style = line.style_solid,
color = color.blue)))
line.delete(
f_qDq(a_tp3Line,
line.new(
entryIndex,
tp3Line,
last_bar_index + l_right,
tp3Line,
style = line.style_solid,
color = c_tp)))
line.delete(
f_qDq(a_tp2Line,
line.new(
entryIndex,
tp2Line,
last_bar_index + l_right,
tp2Line,
style = line.style_solid,
color = c_tp)))
line.delete(
f_qDq(a_tp1Line,
line.new(
entryIndex,
tp1Line,
last_bar_index + l_right,
tp1Line,
style = line.style_solid,
color = c_tp)))
label.delete(
f_qDq(a_slLabel,
label.new(
last_bar_index + l_right,
slLine,
'SL: ' + str.tostring(slLine, '##.###'),
style = label.style_label_left,
textcolor = color.white,
color = c_sl)))
label.delete(
f_qDq(a_entryLabel,
label.new(
last_bar_index + l_right,
entryLine,
'Entry: ' + str.tostring(entryLine, '##.###'),
style = label.style_label_left,
textcolor = color.white,
color = color.blue)))
label.delete(
f_qDq(a_tp3label,
label.new(
last_bar_index + l_right,
tp3Line,
'TP3: ' + str.tostring(tp3Line, '##.###'),
style = label.style_label_left,
textcolor = color.white,
color = c_tp)))
label.delete(
f_qDq(a_tp2label,
label.new(
last_bar_index + l_right,
tp2Line,
'TP2: ' + str.tostring(tp2Line, '##.###'),
style = label.style_label_left,
textcolor = color.white,
color = c_tp)))
label.delete(
f_qDq(a_tp1label,
label.new(
last_bar_index + l_right,
tp1Line,
'TP1: ' + str.tostring(tp1Line, '##.###'),
style = label.style_label_left,
textcolor = color.white,
color = c_tp)))
// ———————————
//
if longE or shortE or longX or shortX
alert(message = 'Any Alert', freq = alert.freq_once_per_bar_close)
if longE
alert(message = 'Long Entry', freq = alert.freq_once_per_bar_close)
if shortE
alert(message = 'Short Entry', freq = alert.freq_once_per_bar_close)
if longX
alert(message = 'Long Exit', freq = alert.freq_once_per_bar_close)
if shortX
alert(message = 'Short Exit', freq = alert.freq_once_per_bar_close)
//#endregion }
// ——————————— <↑↑↑ G_SCRIPT03 ↑↑↑>

Universal MA Playground🔥 Universal MA Playground — Test Any Moving Average Combo With Style
Experiment with 14 moving average types, crossovers, and themes in one flexible indicator
What it is
A universal moving average playground with 14 MA types, customizable auto/manual lengths, and multiple color themes.
It highlights crossovers with glowing lines, background tint, and theme-based styling. Intended as a flexible exploration tool, not a standalone trading system.
Why combine multiple MAs?
Each moving average has unique strengths:
EMA (Exponential) → reacts faster to price changes.
SMA (Simple) → smooth, classic trend measure.
HMA (Hull) → reduces lag, sharper turns.
TEMA/DEMA → smoother than EMA, responsive to reversals.
ALMA, McGinley, LSMA → adaptive, less noisy.
VWAP & Rolling VWAP → volume-weighted trend with session or rolling lookback.
By testing crossovers between any two types, traders can see where different smoothing methods align, helping filter weak or lagging signals.
How it works
MA1 & MA2: Choose any type (SMA, EMA, HMA, VWAP, etc.).
Lengths: Each MA defaults to its standard (e.g. EMA=21, SMA=20, HMA=21). Manual override option available.
Visuals:
Lines change color by theme.
Fill between MAs highlights when MA1 > MA2 (bull) or MA1 < MA2 (bear).
Optional background glow reinforces bias.
Themes: Classic, Neon, Dark Glow, Ice & Fire, Minimalist, Cyberpunk, Nature.
What’s original here
Full library of 14 MA types in one script.
Auto-length detection with manual override toggle.
Theme engine for line, fill, and glow styles.
VWAP handling: true session VWAP intraday, fallback VWMA on higher timeframes.
Clean visual crossover highlights without extra clutter.
Inputs & settings
MA Types: SMA, EMA, WMA, VWMA, RMA, DEMA, TEMA, T3, HMA, ALMA, McGinley, LSMA, VWAP, Rolling VWAP.
Lengths: Auto (standard defaults) or manual override.
Theme selector: 7 presets.
Background glow: ON/OFF.
How to read
Two selected MAs are plotted.
Fill between them shows bias (green for MA1 above, red for MA1 below).
Triangle markers show crossover points.
Background glow (optional) highlights overall state.
Suggested use
Test different MA pairs (e.g. EMA21 vs HMA50, VWAP vs SMA20).
Use as trend confirmation or visual exploration, not a standalone system.
Works on all timeframes; useful both intraday and swing.
Limitations
VWAP only works intraday; on higher TF it falls back to VWMA(20).
Not a trading system by itself. Use with structure, risk management, and confluence.
Signals may lag in sideways markets.
Credits
Standard MAs are public domain (SMA, EMA, HMA, VWAP, etc.).
Universal combination, auto/manual logic, and theme design: NICK789.
Disclaimer
Educational use only; not financial advice.
No guarantees of accuracy or profitability.
Markets involve risk; past performance does not guarantee results.

CakeProfits-SMA+EMA GThis indicator plots a dynamic color coded MA ribbon that visually highlights the relationship between a Simple Moving Average (SMA) and an Exponential Moving Average (EMA). The ribbon changes color based on bullish or bearish crossovers:
Bullish – EMA crosses above the SMA, indicating upward momentum.
Bearish – EMA crosses below the SMA, signaling potential downward pressure.
The SMA smooths out long-term price trends, while the EMA responds faster to recent price action. Together, they help traders identify shifts in market direction and momentum strength. The ribbon provides a clear, at-a-glance view of trend changes and can be used on any timeframe or market.
There is also the option to display a 200 SMA that is also color coded.
Common Uses:
Confirming trend direction.
Identifying early entry/exit points.
Filtering trades for trend-following strategies.

Multi-Timeframe Crypto Market Trend Detector — Bull, Bear, or NeThis indicator is designed to help traders quickly identify whether the crypto market is in a Bullish, Bearish, or Neutral phase by combining trend analysis across multiple timeframes.
📊 How it works:
Uses 200-period SMA as the primary trend reference.
Evaluates Weekly (1W) and Daily (1D) trends separately.
Confirms the trend direction with RSI and an optional Fear & Greed Index value.
Shows a color-coded table on the chart for quick visual identification of the market phase.
✅ Trend logic:
Bullish = Price above SMA200 + RSI > 50 or Fear & Greed > 50
Bearish = Price below SMA200 + RSI < 50 or Fear & Greed < 50
Otherwise → Neutral
🛠 Features:
Dual timeframe analysis (1W macro trend + 1D current trend)
Clean visual table in the top-right corner
Supports manual input of the Fear & Greed Index (update daily from alternative.me)
Works on any crypto pair, including BTC, ETH, and altcoins
⚡ Use case: Align your trades with the macro and daily trends. If both timeframes point in the same direction, signals have higher probability.
Tip: Use this tool alongside volume analysis and support/resistance levels for better accuracy.
👌 If you find this script useful, don’t forget to give it a 👍 and add it to your favorites!

Penguin Volatility State StrategyThe Penguin Volatility State Strategy is a comprehensive technical analysis framework designed to identify the underlying "state" or "regime" of the market. Instead of just providing simple buy or sell signals, its primary goal is to classify the market into one of four distinct states by combining trend, momentum, and volatility analysis.
The core idea is to trade only when these three elements align, focusing on periods of volatility expansion (a "squeeze breakout") that occur in the direction of a confirmed trend and are supported by strong momentum.
Key Components
The strategy is built upon two main engines
The Volatility Engine (Bollinger Bands vs. Keltner Channels)
This engine detects periods of rapidly increasing volatility. It measures the percentage difference (diff) between the upper bands of Bollinger Bands (which are based on standard deviation) and Keltner Channels (based on Average True Range). During a volatility "squeeze," both bands are close. When price breaks out, the Bollinger Band expands much faster than the Keltner Channel, causing the diff value to become positive. A positive diff signals a volatility breakout, which is the moment the strategy becomes active.
The Trend & Momentum Engine (Multi-EMA System)
This engine determines the market's direction and strength. It uses:
A Fast EMA (e.g., 12-period) and a Slow EMA (e.g., 26-period): The crossover of these two moving averages defines the primary, underlying trend (similar to a MACD).
An Ultra-Fast EMA (e.g., 2-period of ohlc4): This is used to measure the immediate, short-term momentum of the price.
The Four Market States
By combining the Trend and Momentum engines, the strategy categorizes the market into four visually distinct states, represented by the chart's background color. This is the most crucial aspect of the system.
💚 Green State: Strong Bullish
The primary trend is UP (Fast EMA > Slow EMA) AND the immediate momentum is STRONG (Price > Fast EMA).
Interpretation: This represents a healthy, robust uptrend where both the underlying trend and short-term price action are aligned. It is considered the safest condition for taking long positions.
❤️ Red State: Strong Bearish
Condition: The primary trend is DOWN (Fast EMA < Slow EMA) AND the immediate momentum is WEAK (Price < Fast EMA).
Interpretation: This represents a strong, confirmed downtrend. It is considered the safest condition for taking short positions.
💛 Yellow State: Weakening Bullish / Pullback
Condition: The primary trend is UP (Fast EMA > Slow EMA) BUT the immediate momentum is WEAK (Price < Fast EMA).
Interpretation: This is a critical warning signal for bulls. While the larger trend is still up, the short-term price action is showing weakness. This could be a minor pullback, a period of consolidation, or the very beginning of a trend reversal. Caution is advised.
💙 Blue State: Weakening Bearish / Relief Rally
Condition: The primary trend is DOWN (Fast EMA < Slow EMA) BUT the immediate momentum is STRONG (Price > Fast EMA).
Interpretation: This signals that a downtrend is losing steam. It often represents a short-covering rally (a "bear market rally") or the first potential sign of a market bottom. Bears should be cautious and consider taking profits.
How the Strategy Functions
The strategy uses these four states as its foundation for making trading decisions. The entry and exit arrows (Long, Short, Close) are generated based on a set of rules that can be customized by the user. For instance, a trader can configure the strategy to
Only take long trades during the Green State.
Require a confirmed volatility breakout (diff > 0) before entering a trade.
Use the "RSI on Diff" indicator to ensure that the breakout is supported by accelerating momentum.
Summary
In essence, the Penguin Volatility State Strategy provides a powerful "dashboard" for viewing the market. It moves beyond simple indicators to offer a contextual understanding of price action. By waiting for the alignment of Trend (the State), Volatility (the Breakout), and Momentum (the Acceleration), it helps traders to identify higher-probability setups and, just as importantly, to know when it is better to stay out of the market.
License / disclaimer
© waranyu.trkm — MIT License. Educational use only; not financial advice.

LRSlope - Linear Regression SlopeThis indicator attempts to predict the direction of the trend using least squares moving averages (LSMA).
The indicator's core purpose is to determine whether the price trajectory has a positive or negative slope and calculate directional changes. It also measures the strength of price momentum by calculating how strongly the slope.
The indicator calculates the slope of the curve for each bar and the EMA of these slopes for the specified period (Curve Length). It is consists of a histogram and two lines named "Average Slope"(white line) and "Simple" (green line).
The "Average Slope" is the simple moving average of the calculated EMA values.
" Simple " is SMA of calculated slopes.
The color of the histogram changes depending on the relative position of these two lines and zero line.
Simply put, the green bars of the histogram indicate an uptrend, blue bars indicate a horizontal or reverse movement, and red bars indicate a downtrend.
It is possible to see the strength of the momentum by the amount of change in the " Simple" (green line).

VWAP Trend Strategy (Intraday) [KedarArc Quant]Description:
An intraday strategy that anchors to VWAP and only trades when a local EMA trend gate and a volume participation gate are both open. It offers two entry templates—Cross and Cross-and-Retest—with an optional Momentum Exception for impulsive moves. Exits combine a TrendBreak (structure flips) with an ATR emergency stop (risk cap).
Updates will be published under this script.
Why this merits a new script
This is not a simple “VWAP + EMA + ATR” overlay. The components are sequenced as gates and branches that *change the trade set* in ways a visual mashup cannot:
1. Trend Gate first (EMA fast vs. slow on the entry timeframe)
Counter-trend VWAP crosses are suppressed. Many VWAP scripts fire on every cross; here, no entry logic even evaluates unless the trend gate is open.
2. Participation Gate second (Volume SMA × multiplier)
This gate filters thin liquidity moves around VWAP. Without it, the same visuals would produce materially more false triggers.
3. Branching entries with structure awareness
* Cross: Immediate VWAP cross in the trend direction.
* Cross-and-Retest: Requires a revisit to VWAP vicinity within a lookback window (recent low near VWAP for longs; recent high for shorts). This explicitly removes first-touch fakeouts that a plain cross takes.
* Momentum Exception (optional): A quantified body% + volume condition can bypass the retest when flow is impulsive—intentional risk-timing, not “just another indicator.”
4. Dual exits that reference both anchor and structure
* TrendBreak: Close only when price loses VWAP and EMA alignment flips.
* ATR stop: Placed at entry to cap tail risk.
These exits complement the entry structure rather than being generic stop/target add-ons.
What it does
* Trades the session’s fair value anchor (VWAP), but only with local-trend agreement (EMA fast vs. slow) and sufficient participation (volume filter).
* Lets you pick Cross or Cross-and-Retest entries; optionally allow a fast Momentum Exception when candles expand with volume.
* Manages positions with a structure exit (TrendBreak) and an emergency ATR stop from entry.
How it works (concepts & calculations)
* VWAP (session anchor):
Standard VWAP of the active session; entries reference the cross and the retest proximity to VWAP.
* Trend gate:
Long context only if `EMA(fast) > EMA(slow)`; short only if `EMA(fast) < EMA(slow)`.
A *gate*, not a trigger—entries aren’t considered unless this is true.
* Participation (volume) gate:
Require `volume > SMA(volume, volLen) × volMult`.
Screens out low-participation wiggles around VWAP.
Entries:
* Cross: Price crosses VWAP in the trend direction while volume gate is open.
* Cross-and-Retest: After crossing, price revisits VWAP vicinity within `lookback` (recent *low near VWAP* for longs; recent *high near VWAP* for shorts).
* Momentum Exception (optional): If body% (|close−open| / range) and volume exceed thresholds, enter without waiting for the retest.
Exits:
* TrendBreak (structure):
* Longs close when `price < VWAP` and `EMA(fast) < EMA(slow)` (mirror for shorts).
* ATR stop (risk):
* From entry: `stop = entry ± ATR(atrLen) × atrMult`.
How to use it ?
1. Select market & timeframe: Intraday on liquid symbols (equities, futures, crypto).
2. Pick entry mode:
* Start with Cross-and-Retest for fewer, more selective signals.
* Enable Momentum Exception if strong moves leave without retesting.
3. Tune guards:
* Raise `volMult` to ignore thin periods; lower it for more activity.
* Adjust `lookback` if retests come late/early on your symbol.
4. Risk:
* `atrLen` and `atrMult` set the emergency stop distance.
5. Read results per session: Optional panel (if enabled) summarizes Net-R, Win%, and PF for today’s session to evaluate
behavior regime by regime.
⚠️ Disclaimer
This script is provided for educational purposes only.
Past performance does not guarantee future results.
Trading involves risk, and users should exercise caution and use proper risk management when applying this strategy.

9 EMA + VolumeBest use on 5 minute and 15 minutes timeframe.
Buy when cross over with volume, and retest.

Alpha Trend ProThe Alpha Trend Pro indicator is a trend-following tool designed to capture market direction using ATR-based dynamic thresholds and smoothing.
✨ Key Features:
ATR-based calculation: Uses Average True Range (ATR) with a multiplier to define bullish and bearish zones.
Adaptive trend line: Plots a dynamic line that shifts according to price movement, turning green for bullish trends and red for bearish trends.
Buy & Sell signals: Generates signals when the trend direction changes (from bearish to bullish or vice versa).
Background highlighting: Optionally colors the chart background to quickly visualize bullish (green) or bearish (red) conditions.
Customizable inputs: Traders can adjust ATR period, multiplier, smoothing factor, and source (close, hl2, etc.).
Alerts ready: Includes built-in alerts for buy signals, sell signals, and trend continuation (bullish or bearish).
📊 How to use it:
Look for BUY signals when the indicator flips from bearish to bullish.
Look for SELL signals when the indicator flips from bullish to bearish.
Use background shading and the trend line color for confirmation of ongoing market direction.
This makes Alpha Trend Pro a powerful yet simple tool for spotting trend reversals and managing trades with confidence.

LSMAsThis indicator consists of three lines.
The main line (LSMA-A) is the least squares moving average (LSMA).
The second line (SMMA) is the smoothed moving average of the LSMA-A. When the SMMA crosses the LSMA-A below, it generates a BUY signal, while when it crosses the LSMA-A above, it is considered a SELL signal.
Furthermore, an uptrend is considered if the SMMA line is below, or a downtrend if it is above. Along these trend lines, the third line, LSMA-B (another shorter-period least squares moving average) is used to identify peaks and bottoms. This allows for wave analysis.
For optimization, adjusting the shorter period to market conditions is sufficient.

MA Suite 6 Config - Bian (mack)Script to configure up to 6 emas with different settings, color updates and display identifying each one in the bottom corner of the chart.

Multi-Timeframe Daily EMA Levels (5 / 10 / 21)Multi-Timeframe Daily EMA Levels (5 / 10 / 21)
This indicator plots the daily EMA 5, EMA 10, and EMA 21 levels as horizontal reference lines (only near the current candle to minimize noise) on any chart timeframe. Instead of recalculating EMAs in the chart’s resolution, it always pulls the latest values from the daily timeframe and anchors them as fixed horizontal lines.
🔹 Features:
Uses daily EMAs (5, 10, 21) regardless of the chart’s current timeframe.
Lets you control visibility on Daily, Weekly, or Monthly charts with checkboxes.
🔹 Use case:
Track where key daily EMA levels are while analyzing lower or higher timeframes.
Useful for swing traders who want to monitor bounce/rejection off daily EMAs to manage/enter positions.

Multiplied and Divided Moving Average ### Multiplied and Divided Moving Average Indicator
**Description**:
The "Multiplied and Divided Moving Average" indicator is a customizable tool for TradingView users, designed to create dynamic bands around a user-selected moving average (MA). It calculates a moving average (SMA, EMA, WMA, VWMA, or RMA) and generates a user-defined number of lines above and below it by multiplying and dividing the MA by linearly spaced factors. These bands serve as potential support and resistance levels, aiding in trend identification, mean reversion strategies, or breakout detection. Optional Buy/Sell labels appear when the price crosses below the divided MAs (Buy) or above the multiplied MAs (Sell), providing clear visual cues for trading opportunities.
**Key Features**:
- **Flexible MA Types**: Choose from Simple (SMA), Exponential (EMA), Weighted (WMA), Volume-Weighted (VWMA), or Running (RMA) moving averages.
- **Customizable Bands**: Set the number of lines (0–10) above and below the MA, allowing tailored analysis for any market or timeframe.
- **Dynamic Factors**: Bands are created using factors that scale linearly from 1 to a user-defined maximum (default: 5.0), creating intuitive overbought/oversold zones.
- **Buy/Sell Signals**: Optional labels highlight potential entry (Buy) and exit (Sell) points when the price crosses the bands.
- **Clear Visuals**: The main MA is plotted in blue, with green (multiplied) and red (divided) lines using graduated transparency for easy differentiation.
**Inputs**:
- **MA Type**: Select the moving average type (default: SMA).
- **MA Length**: Set the MA period (default: 14).
- **Number of Lines Above/Below**: Choose how many bands to plot above and below the MA (default: 4, range: 0–10).
- **Max Factor**: Define the largest multiplier/divisor for the outermost bands (default: 5.0).
- **Source**: Select the price data for the MA (default: close).
- **Show Buy/Sell Labels**: Enable or disable Buy/Sell labels (default: true).
**How It Works**:
1. Calculates the chosen moving average based on user inputs.
2. Creates up to 10 lines above the MA (e.g., MA × 2, ×3, ×4, ×5 for `numLines=4`, `maxFactor=5`) and 10 below (e.g., MA ÷ 2, ÷3, ÷4, ÷5).
3. Plots the main MA in blue, multiplied lines in green, and divided lines in red, with transparency increasing for outer bands.
4. If enabled, displays "Buy" labels when the price crosses below any divided MA and "Sell" labels when it crosses above any multiplied MA, positioned at the outermost band.
**Use Cases**:
- **Trend Analysis**: Use the bands as dynamic support/resistance to confirm trend direction or reversals.
- **Mean Reversion**: Identify overbought (near multiplied MAs) or oversold (near divided MAs) conditions.
- **Breakout Trading**: Monitor price crossovers of the outermost bands for potential breakout signals.
- **Signal Confirmation**: Use Buy/Sell labels for swing trading or to complement other indicators.
**How to Use**:
1. Copy the script into TradingView’s Pine Editor.
2. Compile and apply it to your chart (e.g., stocks, forex, crypto).
3. Adjust inputs like `numLines`, `maxFactor`, or `maType` to fit your strategy.
4. Enable `Show Buy/Sell Labels` to visualize trading signals.
5. Test on various timeframes (e.g., 1H, 4H, 1D) and assets to optimize settings.
**Example Settings**:
- **Swing Trading**: Use `numLines=3`, `maxFactor=4`, `maType=EMA`, `maLength=20` on a 4-hour chart.
- **Intraday**: Try `numLines=2`, `maxFactor=3`, `maType=SMA`, `maLength=10` on a 15-minute chart.
**Notes**:
- **Performance**: Supports up to 20 bands (10 above, 10 below), staying within TradingView’s 64-plot limit.
- **False Signals**: In choppy markets, frequent crossovers may occur. Combine with trend filters (e.g., ADX, higher-timeframe MA) to reduce noise.
- **Enhancements**: Add alerts via TradingView’s alert system for Buy/Sell signals, or experiment with different `maxFactor` values for volatility.
**Limitations**:
- Bands are reactive, as they’re based on a moving average, so confirm signals with other indicators.
- High `numLines` values may clutter the chart; use 2–4 for clarity.
- Signals may lag in fast-moving markets due to the MA’s smoothing effect.
This indicator is perfect for traders seeking a customizable, visually clear tool to enhance technical analysis on TradingView. For support, feature requests (e.g., alerts, custom colors), or community discussion, visit TradingView’s forums or contact the script author.
