HTF Candles [theUltimator5]Overlay higher timeframe candles on any lower timeframe chart with real-time updates.
This indicator displays the full structure of each higher timeframe (HTF) candle—including open-close bodies and full wicks—directly on your current chart. Great for multi-timeframe traders who want to align short-term entries with broader market context.
🔹 Features:
View higher timeframe candles (e.g., 1H, 4H, Daily) on intraday charts
Dynamic candle bodies that update in real-time
Accurate wick representation with auto-redrawing
Customizable bullish/bearish colors and transparency
Efficient object management for minimal clutter
🛠️ How to Use:
Add this indicator to a lower timeframe chart (e.g., 1m, 5m, or 15m).
Select a higher timeframe (must be greater than your chart timeframe).
Customize your candle colors and transparency for better visibility.
Watch as each higher timeframe candle evolves live with every bar.
📌 Example: Use a 5-minute chart with a 1-hour HTF overlay to track hourly market structure without switching timeframes.
Multitimeframe

Zig Zag with HHLLThis powerful tool calculates and displays two Zig Zag patterns simultaneously while dynamically identifying key market structure points—Higher Highs (HH), Lower Lows (LL), Higher Lows (HL), and Lower Highs (LH).
Because the script is dynamic, the most recent HH, HL, LL, or LH can update in real-time as price action evolves. For example, if the price continues to rise, a previously marked HL may be reclassified as an LL. Likewise, a falling LH may later turn into a HH if the market reverses.
This script is versatile and can be applied to various trading strategies, including trend analysis, support and resistance identification, breakout setups, and more.
Added a new input parameter decimals that allows you to control the decimal precision:
Set to -1 (default) for automatic detection based on the symbol's minimum tick size
Set to 0-8 for a specific number of decimal places.
How it works:
Auto mode (decimals = -1): The script automatically determines how many decimal places to show based on the instrument's minimum tick size. For example:
Forex pairs (0.00001) → 5 decimals
Stocks ($0.01) → 2 decimals
Crypto (0.00000001) → 8 decimals
Manual mode (decimals = 0-8): You can force a specific number of decimal places if needed

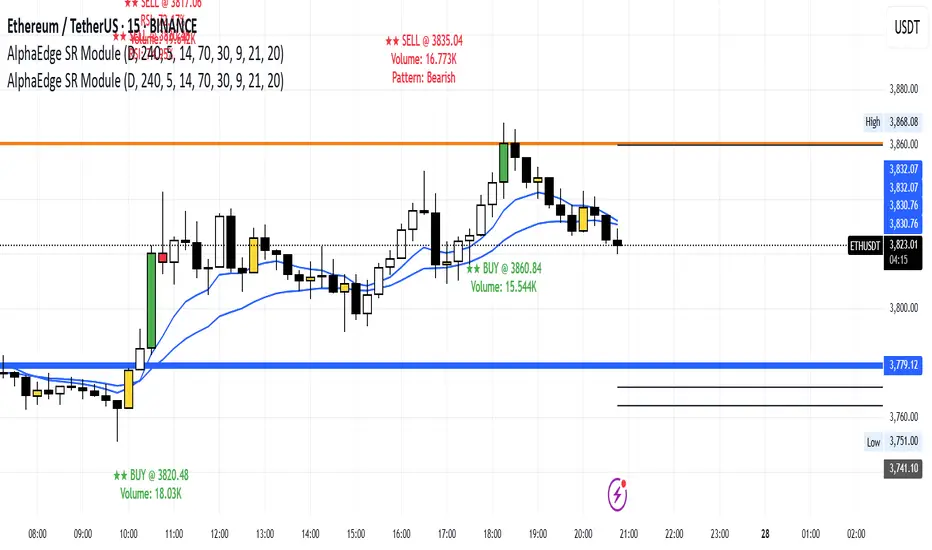
AlphaEdge SR Modulentroducing AlphaEdge SR Module – a powerful tool that combines:
🔹 Clean S/R Zones (Daily & 4H)
🔹 EMA Trend Filters
🔹 RSI OB/OS Highlighting
🔹 Reversal Candle Detection (Engulfing, Pin Bar, Doji)
🔹 Volume Spike Highlighting
🔹 Smart Signal Labels with EMA, RSI, and Volume
Optimized for Gold (XAUUSD), Forex, and Crypto on 1H+ timeframes.
Use it for trend reversals, breakouts, or S/R scalping.
🎯 Public & Free – Search “AlphaEdge SR Module” under Community Scripts.
Smart Deviation Trend Bands PRO + MTF Filter📌 Purpose
This indicator combines multi-level Deviation Bands (±1, ±2, ±3 standard deviations from SMA) with a Higher Timeframe (HTF) Trend Filter.
It helps traders identify potential bounce and breakout setups aligned with the dominant market trend.
🧠 How It Works
1. Deviation Bands
SMA(Length) is calculated as the centerline.
Standard deviations (±1, ±2, ±3) define multiple dynamic support and resistance zones.
Outer bands (±3) often mark overextended zones; inner bands (±1, ±2) show active trading areas.
2. HTF Trend Filter
A higher timeframe SMA (HTF SMA) acts as a trend confirmation tool.
Default filter timeframe: 1 Day.
Trend Up: Price > HTF SMA
Trend Down: Price < HTF SMA
3. Entry Signals
Long Signal: Price crosses above lower deviation band (+1) when HTF trend is UP.
Short Signal: Price crosses below upper deviation band (−1) when HTF trend is DOWN.
4. Visuals & Alerts
Bands plotted in red (upper) and green (lower).
Centerline = SMA in blue.
HTF SMA in orange.
Circles on chart mark entry points; alerts trigger automatically.
📈 How to Use
In trending markets: Trade with the HTF direction, using band touches for entries.
In mean-reversion setups: Outer bands can be used to spot potential overbought/oversold zones.
Combine with volume or price action for confirmation.
Recommended Timeframes: 1h, 4h, D.
Markets: Forex, Crypto, Stocks.
⚙️ Inputs
SMA Length
StdDev Multiplier 1 / 2 / 3
HTF Timeframe (default: D1)
⚠️ Disclaimer
This script is for educational purposes only. It does not constitute financial advice.
Always test thoroughly before live trading.

多维度市场分析指标 v2 (区间框选)使用大周期MACD的能量柱作为背景用于识别趋势并且搭配上伦敦和纽约交易session
we are using a high time frame macd momentum as chart background to analysis a trend and using london and newyork session to help you trade better

HTF CandlesFull credit to cdikici71 - this is a stripped down version of cd_sweep&cisd_Cx to provide a clean higher timeframe (HTF) candle overlay. Choose colors for candles & font along with timeframe to overlay the HTF on any other timeframe.
Simple and Clean!
Clarix Market DashboardPurpose :
Shows if the market is trending, volatile, or stuck so you can decide when to trade or wait.
How to Use
Add the indicator to your chart. Adjust basic settings like EMA, RSI, ATR lengths, and timezone if needed. Use it before entering any trade to confirm market conditions.
What Each Metric Means (with general ranges)
Session: Identifies which market session is active (New York, London, Tokyo).
Trend: Shows current market direction. “Up” means price above EMA and VWAP, “Down” means price below. Use this to confirm bullish or bearish bias.
HTF Trend: Confirms trend on a higher timeframe for stronger signals.
ATR (Average True Range): Measures market volatility or price movement speed.
Low ATR (e.g., below 0.5% of price) means quiet or slow market; high ATR (above 1% of price) means volatile or fast-moving market, good for active trades.
Strong Bar: A candlestick closing near its high (above 75% of range) indicates strong buying momentum; closing near its low indicates strong selling momentum.
Higher Volume: Volume higher than average (typically 10-20% above normal) means more market activity and stronger moves.
Volume / Avg Volume: Ratio above 1.2 (120%) shows volume is significantly higher than usual, signaling strong interest.
RVol % (Relative Volume %): Above 100% means volume is hotter than normal, increasing chances of strong moves; below 50% means low activity and possible indecision.
Delta: Difference between buying and selling volume (if available). A positive delta means buyers dominate; negative means sellers dominate.
ADX (Average Directional Index): Measures trend strength:
Below 20 means weak or no trend;
Above 25 means strong trend;
Between 20-25 is moderate trend.
RSI (Relative Strength Index): Momentum oscillator:
Below 30 = oversold (potential buy);
Above 70 = overbought (potential sell);
Between 40-60 means neutral momentum.
MACD: Confirms momentum direction:
Positive MACD histogram bars indicate bullish momentum;
Negative bars indicate bearish momentum.
Choppiness Index: Measures how much the market is ranging versus trending:
Above 60 = very choppy/sideways market;
Below 40 = trending market.
Consolidation: When true, price is stuck in a narrow range, signaling indecision. Avoid breakout trades during this.
Quick Trading Reminder
Trade only when the trend is clear and volume is above average. Avoid trading in low volume or choppy markets.

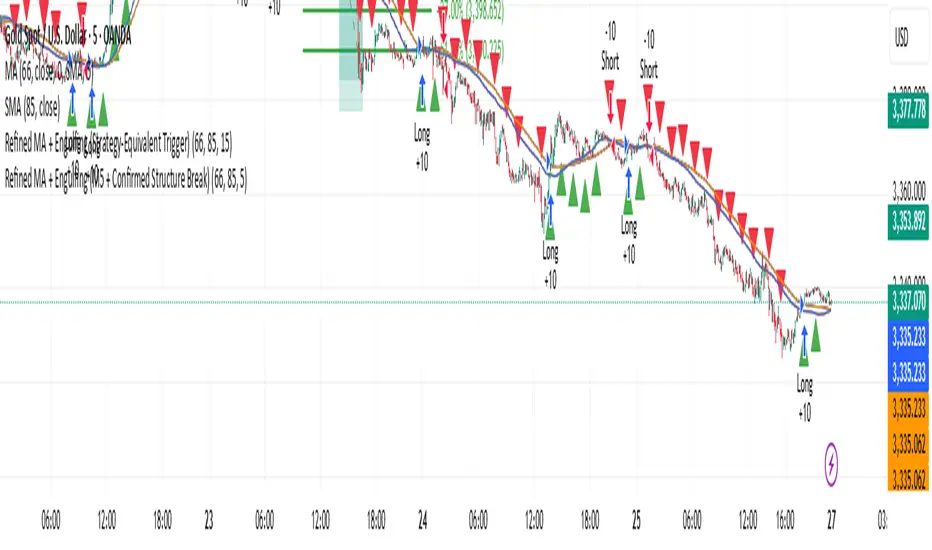
Refined MA + Engulfing (Strategy-Equivalent Trigger)I would like to start by saying that this indicator was put together using ChatGPT, some past trades from myself and some backtested trades, and from my time as a student in Wallstreet Academy under Cue Banks.
I am not profitable yet. I am too jumpy and blow accounts. I'm hoping this indicator (and it's strategy twin), with the help of some alerts, can help me spend less time on the charts, so that I'm not tempted to press buttons as much.
It does fire quite a bit. It can be adjusted, I believe, to trigger more or less (open the script, cooldown bars(x) <== change the X to whatever. 5 minute intervals so 1 is 5.
With that being said, there are times that this indicator has shown to trigger and I ask, "Why?".
I just want to help myself and others, and maybe make some decent\cool stuff along the way. Enjoy
KR
Custom Opening TimesThis indicator displays custom opening levels on your chart. Define multiple opening times, each with its own customizable style. Display these levels as horizontal lines at the opening price, or as vertical lines to mark the opening time.
Custom Opening Times
4 Independent Groups with 4 custom opening levels each
Set any custom opening time (displayed in New York Local Time)
Choose between Opening Price lines, Vertical time markers, or Both
Cutoff Times: Stop extending lines after specified times
Higher Timeframe Levels
5 Configurable HTF levels supporting any timeframe
Display opening prices from Daily, Weekly, Monthly, Quarterly, and custom timeframes
Show Previous High/Low levels from higher timeframes

HTF Current/Average RangeThe "HTF(Higher Timeframe) Current/Average Range" indicator calculates and displays the current and average price ranges across multiple timeframes, including daily, weekly, monthly, 4 hour, and user-defined custom timeframes.
Users can customize the lookback period, table size, timeframe, and font color; with the indicator efficiently updating on the final bar to optimize performance.
When the current range surpasses the average range for a given timeframe, the corresponding table cell is highlighted in green, indicating potential maximum price expansion and signaling the possibility of an impending retracement or consolidation.
For day trading strategies, the daily average range can serve as a guide, allowing traders to hold positions until the current daily range approaches or meets the average range, at which point exiting the trade may be considered.
For scalping strategies, the 15min and 5min average range can be utilized to determine optimal holding periods for fast trades.
Other strategies:
Intraday Trading - 1h and 4h Average Range
Swing Trading - Monthly Average Range
Short-term Trading - Weekly Average Range
Also using these statistics in accordance with Power 3 ICT concepts, will assist in holding trades to their statistical average range of the chosen HTF candle.
CODE
The core functionality lies in the data retrieval and table population sections.
The request.security function (e.g., = request.security(syminfo.tickerid, "D", , lookahead = barmerge.lookahead_off)) retrieves high and low prices from specified timeframes without lookahead bias, ensuring accurate historical data.
These values are used to compute current ranges and average ranges (ta.sma(high - low, avgLength)), which are then displayed in a dynamically generated table starting at (if barstate.islast) using table.new, with conditional green highlighting when the current range is greater than average range, providing a clear visual cue for volatility analysis.

SulLaLuna PO3 Acceleration Tracker### 🚀 **Power of 3 Acceleration Script | Enter the Cave of Wonder 🧙♂️**
> *“When we find the God Candle, we don’t just ride it—we ritualize it.”*
> — The Calzolaio Way
🌕 The **SulLaLuna PO3 Acceleration Tracker** is a tool born from Smart Money theory, built with surgical logic, and forged to ride the **acceleration phase** with confluence and confidence.
Inspired by the teachings of (youtu.be), this indicator captures the moment of explosive expansion—the candle after the manipulation wick, the price action spark that ignites the trend.
---
### ⚔️ The PO3 Framework (ICT)
* **Accumulation** – Compression, trap laid
* **Manipulation** – Liquidity taken, fakeouts triggered
* **Expansion** – God Candle. This is where we enter.
This script automatically detects that exact **post-manipulation acceleration** candle and plots:
* ✅ TP/SL based on risk-reward
* ✅ Dynamic trend dashboard (15m to 1D)
* ✅ Long/Short trade markers
* ✅ Custom alerts and dashboard positioning
---
### 🔁 **Use Confluence**
> ⚠️ *No entry should ever be made on one signal alone.*
For optimal precision, pair this script with a **trend-strength and momentum filter**.
I personally use (), a brilliant tool that dynamically adapts to volatility and momentum changes using a responsive EMA and wave strength logic. It's CC BY-NC-SA 4.0 licensed and adds serious edge in distinguishing true trends from false breaks.
💡 Look for PO3 entries that align with:
* ✅ Bullish dominance in trend speed
* ✅ Dynamic EMA slope support
* ✅ MTF Trend agreement on the SulLaLuna dashboard
---
### ✨ The Cave of Wonder
This is more than just a script—this is your **map**.
The Cave of Wonder isn’t a place, it’s a **process**. Each PO3 entry is a torch lighting the path deeper into the vaults of financial freedom.
When you use this with **discipline**, **data**, and **divine timing**, you don't just take trades.
You take **territory**.
---
### 🔗 Try It. Trade It. Ritualize It.
🛠️ Built by @Calzolaio
🎓 Based on PO3 by @TheMovingAverage
📊 Powered by trend confluence from @Zeiierman
> “Capture the Acceleration. Honor the Trend. Trade with the Moon.” 🌕

Support/Resistance MTF Merge ZonesIndicator Introduction
Support/Resistance MTF Merge Zones is an advanced technical analysis tool that automatically identifies and merges key support/resistance zones by analyzing highs and lows from multiple timeframes (15M, 1H, 4H, Daily).
Key Features
Multi-Timeframe Analysis: Integrates data from 15M, 1H, 4H, and Daily charts
Smart Zone Merging: Automatically consolidates levels within a specified percentage range into unified zones
Dynamic Color System: Distinguishes support/resistance zones based on position relative to current price
Strength Indication: Highlights zones where multiple levels converge as strong zones
Usage Guide
Configuration Parameters
Lookback Period (10): Period for calculating highs/lows
Adjustable range: 5-30
Higher values detect more long-term levels
Zone Merge % (0.5): Percentage threshold for zone merging
Range: 0.1-2.0%
Higher values merge levels across wider price ranges
Min Levels for Zone (2): Minimum number of levels required to form a zone
Range: 2-5 levels
Higher values display only more confirmed zones
Box Opacity (7): Transparency level of zone boxes
Range: 0-100%
Color Scheme
Red: Resistance zones above current price
Blue: Support zones below current price
Orange: Strong zones (3+ merged levels)
Scalper - Pattern Recognition & Price Action🔍 Introducing the Ultimate Scalping Toolkit for TradingView
📊 “Scalper – Pattern Recognition & Price Action”
💥 Unlock precision trading with one of the most advanced Pine Script indicators ever built!
✅ Key Features:
📌 Multiple Moving Averages (SMA, EMA, HMA, VWMA & more) – fully customizable per timeframe
🔍 Candlestick Pattern Detection – from Engulfing & Doji to Morning/Evening Stars and Three Soldiers/Crows
⚡ Smart Price Action Tools – Fair Value Gaps, Order Blocks, Breakout Zones
🧠 Confluence Engine – Aggregates multi-signal zones for high-probability entries
📉 Dynamic Support & Resistance Lines – auto-detected from historical swing points
📈 RSI & CCI Reversal Zones – spot hidden turning points before the crowd
🎯 Perfect for Scalpers, Day Traders & Pattern Hunters
💡 This is not just another indicator — it's a complete trading assistant that identifies structure, signals strength, and simplifies decision-making.
🚀 Plug it into your TradingView chart today and start seeing the market in a whole new way.
👉 DM us for access : t.me

Prev Candle Quarters (MTF) – % + PriceThis TradingView indicator visualizes quarter levels (25%, 50%, 75%, 100%) of the previous candle body from a user-selected higher timeframe, helping traders identify key reaction zones within a candle’s structure.
ulti-Timeframe Input: Choose between 15m, 1H, or 2H candles for your measurement basis.
Body-Based Calculation: Measures from open to close of the previous candle (not wick-to-wick), reflecting where price actually closed.
Precise Quarter Levels: Automatically draws horizontal lines at 25%, 50%, 75%, and 100% of the candle body.
Custom Toggles: Enable or disable each individual level via checkboxes.
Price + % Labels: Each level includes a clean label showing the exact price and corresponding percentage.

Supertrend with ADX & MTF MA Filter# **Supertrend with ADX & MTF MA Filter - Comprehensive Explanation**
---
## **1. Purpose of This Indicator**
This indicator combines three powerful technical analysis tools to create a robust trading system:
✅ **Supertrend** (Trend-following)
✅ **ADX Filter** (Trend strength confirmation)
✅ **MTF MA Filter** (Multi-timeframe trend direction confirmation)
**Primary Goals:**
✔ **Identify high-probability trend reversals** with confirmation from multiple indicators
✔ **Filter out weak trends** using ADX (Average Directional Index)
✔ **Add higher timeframe context** with MTF (Multi-TimeFrame) Moving Average
✔ **Reduce false signals** by requiring confluence between all three components
---
## **2. Core Logic & Components**
### **A. Supertrend (Base Indicator)**
- **Calculation:**
```pine
up = hl2 - (Multiplier * ATR(Periods))
dn = hl2 + (Multiplier * ATR(Periods))
```
- **Bullish trend** when price > `up` (green line)
- **Bearish trend** when price < `dn` (red line)
- **Why Supertrend?**
- Simple yet effective trend-following system
- Adapts to volatility via ATR (Average True Range)
---
### **B. ADX Filter (Trend Strength Confirmation)**
- **ADX Calculation:**
```pine
= calcADX(adxLength, adxSmoothing)
strongTrend = adxVal >= adxThreshold
```
- **ADX > Threshold (Default: 20)** = Strong trend
- **DI+ > DI-** = Bullish momentum
- **DI- > DI+** = Bearish momentum
- **Why ADX?**
- Avoids trading in choppy markets (low ADX = weak trend)
- Confirms if Supertrend signals occur in a strong trend
---
### **C. MTF MA Filter (Higher Timeframe Trend Alignment)**
- **Moving Average Calculation:**
```pine
= getMA(maSource, maLength, maType, maTF)
```
- **MA Type:** SMA, EMA, WMA, or DEMA
- **Timeframe:** Any (1m, 5m, 1H, 4H, D, W, M)
- **Trend Direction:**
- **Buy Signal:** MA must be **rising**
- **Sell Signal:** MA must be **falling**
- **Why MTF MA?**
- Aligns trades with the **higher timeframe trend**
- Reduces counter-trend entries
---
## **3. How to Use This Indicator**
### **A. Buy Conditions (All Must Be True)**
1. **Supertrend turns bullish** (price crosses above `up` line)
2. **ADX ≥ Threshold** (trend is strong)
3. **Higher timeframe MA is rising** (confirms bullish bias)
### **B. Sell Conditions (All Must Be True)**
1. **Supertrend turns bearish** (price crosses below `dn` line)
2. **ADX ≥ Threshold** (trend is strong)
3. **Higher timeframe MA is falling** (confirms bearish bias)
### **C. Recommended Settings**
| Parameter | Recommended Value | Description |
|-----------|------------------|-------------|
| **ATR Period** | 14 | Sensitivity of Supertrend |
| **Multiplier** | 1.5-3.0 | Adjust for volatility |
| **ADX Threshold** | 20-25 | Higher = stricter trend filter |
| **MA Length** | 20-50 | Smoothness of trend filter |
| **MA Timeframe** | 1H/D | Align with trading style |
---
## **4. Trading Strategies**
### **A. Trend-Following Strategy**
- **Enter:** When all 3 conditions align (Supertrend + ADX + MA)
- **Exit:** When Supertrend flips or ADX drops below threshold
### **B. Pullback Strategy**
- **Wait for:**
- Supertrend in trend direction
- ADX remains strong
- MA still aligned
- **Enter:** On pullback to Supertrend line
### **C. Multi-Timeframe Confirmation**
- **Intraday traders:** Use 4H/D MA for trend bias
- **Swing traders:** Use D/W MA for trend bias
---
## **5. Advantages Over Standard Supertrend**
✔ **Fewer false signals** (ADX filters weak trends)
✔ **Higher timeframe alignment** (avoids trading against larger trends)
✔ **Customizable MA types** (SMA, EMA, WMA, DEMA)
✔ **Works on all markets** (stocks, forex, crypto)
---
### **Final Thoughts**
This indicator is designed for traders who want **high-confidence trend signals** by combining:
🔹 **Supertrend** (entry trigger)
🔹 **ADX** (trend strength filter)
🔹 **MTF MA** (higher timeframe trend alignment)
By requiring all three components to align, it significantly improves signal quality compared to standalone Supertrend systems.
**→ Best for:** Swing trading, trend-following, and avoiding choppy markets.
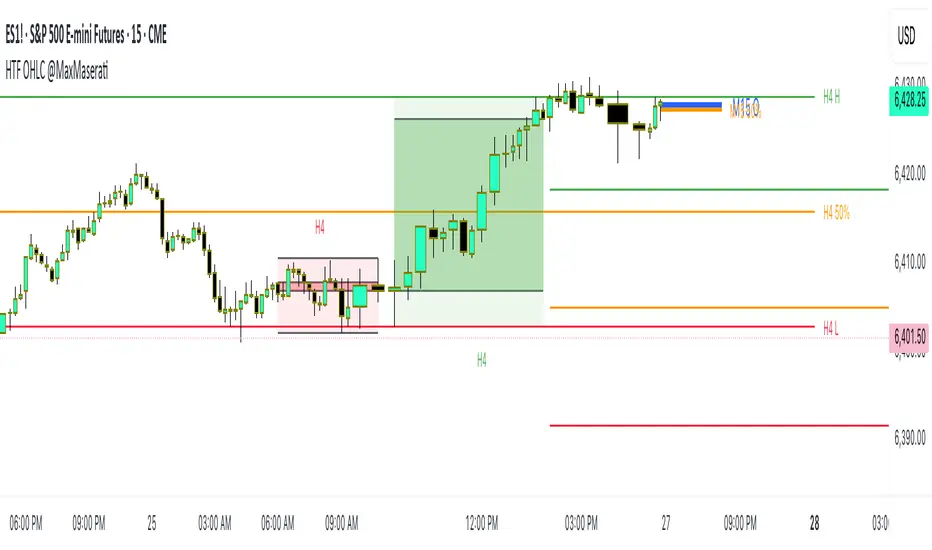
HTF OHLC Candle + 50% @MaxMaseratiHTF OHLC Candle + 50% @MaxMaserati
This advanced multi-timeframe indicator displays higher timeframe OHLC data as visual candle boxes and extended key levels on lower timeframe charts, providing essential context for institutional trading decisions.
Core Functionality:
Multi-Timeframe Box Display:
Main Timeframe Box (Default H4): Shows complete higher timeframe candles as colored boxes with separate body and wick visualization, including bullish (green) and bearish (red) candle representation with customizable transparency levels.
Independent Box 2 (Default M15): Secondary timeframe display with lime/fuchsia color scheme, allowing traders to monitor intermediate timeframes simultaneously with different visual styling.
Independent Box 3 (Default H1): Third independent timeframe with blue/orange color scheme, providing additional context for multi-timeframe analysis and confluence identification.
OHLC Level Analysis:
Each timeframe box includes individual Open, High, Low, and Close level lines with customizable colors and visibility settings. These levels act as key support and resistance zones that institutional traders often respect.
50% Retracement Levels:
Automatic calculation and display of 50% levels between each timeframe's high and low, representing critical equilibrium zones where price often finds support or resistance during retracements.
Extended Line System:
Current Live Timeframe Extended Lines: Real-time extension of the forming candle's Open, High, Low, and 50% levels with customizable line weights and label positioning.
TF2 Extended Lines (Default H4): Previous completed candle's key levels extended forward, showing immediate higher timeframe reference points for current price action.
TF3 Extended Lines (Default Daily): Longer-term reference levels from daily or weekly timeframes, providing macro trend context and major institutional levels.
Key Features:
Smart Timeframe Detection: Only displays boxes for timeframes higher than the current chart timeframe, preventing redundant information and maintaining chart clarity.
Global Box Limit Control: Intelligent cleanup system that maintains optimal performance by limiting total displayed elements while preserving the most recent and relevant timeframe periods.
Comprehensive Customization: Full control over colors, transparency, line weights, label sizes, and visibility for each timeframe component, allowing personalized setups for different trading styles.
Label System: Automatic timeframe identification labels (H4, M15, D1, etc.) positioned on each box for instant timeframe recognition and clear multi-timeframe organization.
Current Candle Options: Optional display of forming/current candles for each timeframe, enabling real-time monitoring of developing price action and potential setup completion.
This indicator is essential for traders utilizing multi-timeframe analysis, institutional trading concepts, and higher timeframe confluence strategies, providing clear visual representation of key levels and candle structures that drive major market movements.
📊 Visual MTF VMA Dashboard🔄️📊 Visual MTF VMA Dashboard🔄️
This powerful multi-timeframe indicator provides a clean, emoji-enhanced dashboard that helps you quickly identify the Variable Moving Average (VMA) trend direction across multiple key timeframes — all in real-time.
🔍 What It Does:
The Visual MTF VMA Dashboard calculates the LazyBear-style VMA on the following timeframes:
📆 Daily
🕰 195 Minutes
🕒 65 Minutes
⏳ 39 Minutes
⏱ 15 Minutes
Each cell in the table shows the current trend:
📈 BULLISH – VMA rising
📉 BEARISH – VMA falling
⚪ NEUTRAL – No change
🎨 Visual Boost:
This feature can be toggled on/off for cleaner visuals.
📌 Customization:
Adjustable VMA Length
Selectable table position: Top Left, Top Right, Bottom Left, Bottom Right
✅ Ideal For:
Multi-timeframe traders
Trend confirmation
Quick-glance analysis without cluttering your chart
Use this dashboard as a high-level trend confirmation tool — designed for simplicity, speed, and visual clarity.

Triple Momentum Core v1🧠 Technical Structure:
Triple Momentum Core analyzes the underlying wave of price movement through a three-stage system:
1. 🔵 Follow Line – The First Spark of Momentum:
Constructed using Bollinger Bands and ATR, this line detects the very first signs of directional price expansion. It gently whispers when the market begins stretching with force in one direction.
2. 🟢 SuperTrend – Confirmation and Directional Validation:
After the initial move, SuperTrend acts as the second checkpoint — validating whether the price action is evolving into a genuine trend or fading out. It confirms whether the impulse has the strength to sustain.
3. 🔴 PMax – Core Trend & Structural Anchor:
Based on Moving Average and ATR logic, PMax tracks the heartbeat of the trend. It serves as a dynamic structural boundary — critical for identifying trend continuation and managing risk.
4. 🟡 PMax MA Line – Smooth Trend Pulse & Adaptive Guide:
This yellow moving average line within the PMax system softly follows the overall trend flow, without reacting to sharp price noise. It acts as a balanced, stable guide to gauge the solidity of the trend’s body structure.
(If you prefer a cleaner view without any moving average lines, you can disable it from the settings.)
🧠 Technical Structure:
Triple Momentum Core analyzes the underlying wave of price movement through a three-stage system:
1. 🔵 Follow Line – The First Spark of Momentum:
Constructed using Bollinger Bands and ATR, this line detects the very first signs of directional price expansion. It gently whispers when the market begins stretching with force in one direction.
2. 🟢 SuperTrend – Confirmation and Directional Validation:
After the initial move, SuperTrend acts as the second checkpoint — validating whether the price action is evolving into a genuine trend or fading out. It confirms whether the impulse has the strength to sustain.
3. 🔴 PMax – Core Trend & Structural Anchor:
Based on Moving Average and ATR logic, PMax tracks the heartbeat of the trend. It serves as a dynamic structural boundary — critical for identifying trend continuation and managing risk.
4. 🟡 PMax MA Line – Smooth Trend Pulse & Adaptive Guide:
This yellow moving average line within the PMax system softly follows the overall trend flow, without reacting to sharp price noise. It acts as a balanced, stable guide to gauge the solidity of the trend’s body structure.
(If you prefer a cleaner view without any moving average lines, you can disable it from the settings.)
💡 Why “Triple Momentum Core”?
Because this indicator doesn’t just detect movement — it breaks it down into its essential phases:
Ignition, validation, and confirmation.
Each layer captures a unique and essential part of price behavior:
The first reaction (Follow Line) ignites the initial spark.
The second reaction (SuperTrend) confirms whether that spark will become a real trend.
The third and final layer (PMax) structurally anchors and follows that trend.
That’s why we call it Triple Momentum Core:
A synchronized 3-engine momentum system working in harmony to capture the lifecycle of a trend — from spark to structure.

S&R Zones MTF (TechnoBlooms)S&R Zones MTF – Multi-Timeframe Support & Resistance Boxes
🔍 Overview
S&R Zones MTF is a professional-grade yet beginner-friendly indicator that dynamically plots Support & Resistance zones across multiple timeframes, helping traders recognize high-probability reversal areas, entry confirmations, and price reaction points.
This tool visualizes structured zones as colored boxes, allowing both new and experienced traders to analyze multi-timeframe confluence with ease and clarity.
🧠 What Is This Indicator?
S&R Zones MTF automatically detects the most significant support and resistance levels from up to four custom timeframes, using a configurable lookback period. These zones are displayed as colored horizontal boxes directly on the chart, making it easy to:
Spot where price has historically reacted
Identify potential reversal or breakout zones
Confirm entries with institutional-style precision
🛠️ Key Features
✅ Multi-Timeframe Zone Detection (up to 4 timeframes)
📦 Auto Plotted Boxes for Support (Blue) & Resistance (Pink)
🧱 Dynamic Height based on average price range or fixed input
🏷️ Timeframe Labels to instantly identify zone origin
🎛️ Customizable inputs: Lookback length, box color, height style
🔁 Real-time updates as price structure changes
🎓 Educational & Easy to Use
Whether you’re a new trader learning about price structure, or a professional applying institutional concepts, this tool offers an educational layout to understand:
How price respects historic zones
Why multi-timeframe zones offer stronger confluence
How to use zones for entry, exit, or risk placement
📈 How to Use (Multi-Timeframe Strategy)
Select Your Timeframes – Customize up to 4 higher timeframes (e.g., 1m, 5m, 15m, 1h).
Observe Overlapping Zones – When multiple timeframes agree, those zones are more significant.
Entry Confirmation – Wait for price to reach a zone, then look for reversal patterns (engulfing candle, pin bar, etc.)
Combine with Other Tools – Use alongside indicators like RSI, MACD, or Order Blocks for added confidence.
💡 Pro Tips
Zones from higher timeframes (1H, 4H) are often more powerful and reliable.
Confluence matters: If a 15m support zone aligns with a 1H support zone — that's a high-probability reaction area.
Use break-and-retest strategies with zone rejections for sniper entries.
Enable "Auto Height" for a more adaptive, volatility-based zone display.
🌟 Summary
S&R Zones MTF blends precision, clarity, and professional analysis into a visual structure that’s easy to understand. Whether you're learning support & resistance or optimizing your MTF edge — this tool will bring clarity to your charts and confidence to your trades.

Daily Weekly Monthly Highs & Lows [Dova Lazarus]Daily Weekly Monthly Highs & Lows
📊 Overview
This Pine Script indicator displays key support and resistance levels by plotting the highs and lows from Daily, Weekly, and Monthly timeframes on your current chart. It's designed as an educational tool to help traders understand multi-timeframe analysis and identify significant price levels.
🎯 Key Features
Multi-Timeframe Support & Resistance
- Daily Levels: Shows previous daily highs and lows
- Weekly Levels: Displays weekly highs and lows
- Monthly Levels: Plots monthly highs and lows
- Smart Display: Only shows relevant timeframes based on your current chart timeframe
Fully Customizable Appearance
- Individual Colors: Set unique colors for each timeframe
- Line Styles: Choose between Solid, Dashed, or Dotted lines
- Line Width: Adjust thickness from 1-4 pixels
- Lookback Periods: Control how many historical levels to display
User-Friendly Options
- Enable/Disable: Toggle any timeframe on/off
- Line Extension: Option to extend lines into the future
- Clean Interface: Organized settings groups for easy configuration
🔧 Settings
Timeframes Group
- Show Daily/Weekly/Monthly Levels: Enable or disable each timeframe
- Lookback Periods: Number of historical levels to display (1-10)
Line Settings Group
- Color: Choose custom colors for each timeframe
- Style: Select line appearance (Solid/Dashed/Dotted)
- Width: Set line thickness (1-4 pixels)
Display Options Group
- Extend Lines Forward: Project lines 20 bars into the future
📈 How to Use
1. Add to Chart: Apply the indicator to any timeframe chart
2. Configure Timeframes: Enable the timeframes you want to see
3. Customize Appearance: Set colors and line styles for easy identification
4. Identify Levels: Use the plotted levels as potential support/resistance zones
5. Plan Trades: Look for price reactions at these key levels
💡 Trading Applications
- Support & Resistance: Identify key price levels where reversals may occur
- Entry Points: Look for bounces or breaks at these levels
- Stop Loss Placement: Use levels to set logical stop losses
- Target Setting: Previous highs/lows can serve as profit targets
- Multi-Timeframe Analysis: Understand the bigger picture context
🎓 Educational Value
This indicator is perfect for:
- Learning Pine Script: Clean, well-commented code structure
- Understanding Multi-Timeframe Analysis: See how different timeframes interact
- Practicing Technical Analysis: Identify key support/resistance concepts
- Code Study: Full variable names and detailed comments for learning
⚙️ Technical Details
- Version: Pine Script v6
- Overlay: True (plots directly on price chart)
- Max Lines: 500 (handles multiple timeframes efficiently)
- Compatibility: Works on all timeframes (shows relevant levels only)
🔍 What Makes This Different
- Educational Focus: Designed for learning with clear code structure
- Simplified Interface: Easy-to-use settings without overwhelming options
- Visual Clarity: Clean line display with customizable appearance
- Practical Application: Real trading tool, not just a demonstration
📋 Requirements
- TradingView account (any plan)
- Basic understanding of support/resistance concepts
- Any chart timeframe (indicator adapts automatically)
🚀 Quick Start
1. Add indicator to your chart
2. Default settings work great out of the box
3. Customize colors if desired (Green=Daily, Orange=Weekly, Red=Monthly)
4. Watch for price reactions at the plotted levels
5. Use as part of your technical analysis toolkit
---
*This indicator is designed as an educational tool and should be used in conjunction with other forms of analysis. Past performance does not guarantee future results.*

BB with Heikin Ashi + Reversal CheckThis indicator combines Bollinger Bands (BB) with Heikin Ashi candles to detect potential reversal points after price breaks the BB boundaries. It works on any symbol and timeframe, retrieving Heikin Ashi data via request.security().
Core Features
Heikin Ashi Candle Plot
Smooths price action by using Heikin Ashi candles instead of regular candles.
Candles are plotted directly on the chart with green (bullish) and red (bearish) colors.
Bollinger Bands (BB)
Calculated from Heikin Ashi close price.
Includes Basis (MA), Upper Band, and Lower Band, with customizable MA type, length, and standard deviation multiplier.
Break & Reversal Detection
The indicator tracks whether the price has broken above the Upper Band (p1) or below the Lower Band (p2).
It remembers the last breakout direction until the opposite breakout occurs (mutually exclusive logic).
Signal Logic
Long Signal (▲):
Price was previously below the Lower Band and then reversed upward (BB Lower rising + Heikin Ashi candle rising).
Short Signal (▼):
Price was previously above the Upper Band and then reversed downward (BB Upper falling + Heikin Ashi candle falling).
Alerts
Custom alert conditions trigger when Long or Short signals occur, allowing automated notifications or bot integration.
Use Cases
✅ Swing Trading / Trend Reversal – Identify potential bottom/top reversals after BB breakouts.
✅ Mean Reversion Strategies – Enter trades when the price reverts to the BB mean after an extreme breakout.
✅ Multi-Timeframe Analysis – Works with any timeframe and symbol via request.security().
Customization
MA Type: SMA, EMA, RMA, WMA, VWMA
BB Length & StdDev Multiplier
Timeframe & Symbol Selection

US Index First 30m Candle Strategy (10m Chart)Strategy Description for Publishing
Title: US Index First 30-Minute Candle Strategy (10m Chart)
Overview:
This Pine Script implements a trading strategy designed to capitalize on price movements within the first 30 minutes of the U.S. stock market opening. It is specifically tailored for use on a 15-minute chart and is optimized for trading U.S. indices during regular market hours.
Features:
Session Time Configuration: The strategy operates within the U.S. market hours, specifically from 9:30 AM to 4:00 PM (Eastern Time).
First 30-Minute Candle Aggregation: The script identifies the high and low of the first 30-minute candle, which is considered a critical time frame for market momentum.
Single Trade Per Day: To minimize risk, the strategy is designed to execute only one trade per day based on the established range of the first 30 minutes.
Dynamic Trade Conditions: Buy and sell signals are generated when the price breaks above the high or below the low of the first 30-minute candle, with defined stop-loss and take-profit levels based on a customizable risk-reward ratio.
How It Works:
Initialization:
At the start of each trading day, the script resets the high and low values for the first 30 minutes.
Range Locking: After the first 30 minutes, the high and low values are locked, allowing for trade entries based on these levels.
Trade Execution:
Long Entry: Triggered when the price moves above the locked high.
Short Entry: Triggered when the price drops below the locked low.
Risk Management: Each trade comes with a stop-loss and take-profit mechanism to manage potential losses and secure profits.
Visuals:
The script also plots the locked high and low levels on the chart, providing a visual reference for traders.
Conclusion:
This strategy leverages the volatility often seen in the first 30 minutes of trading, aiming to capture significant price movements while maintaining a disciplined trading approach. It is suitable for traders looking to implement a systematic strategy based on early market behavior.
Usage:
To use this strategy, simply add the script to your TradingView chart, set your desired parameters, and monitor for trade signals during the specified market hours. Adjust the risk-reward ratio as needed to align with your trading style.

[Pandora] Laguerre Ultimate Explorations MulticatorIt's time to begin demonstrations differentiating the difference between known and actual feasibility beyond imagination... Welcome to my algorithmic twilight zone .
INTRODUCTION:
Hot off my press, I present this Laguerre multicator employing PSv6.0, originally formulated by John Ehlers for TASC - July 2025 Traders Tips. Basically I transcended Ehlers' notions of transversal filtration with an overhaul of his Laguerre design with my "what if" Pandora notions included. Striving beyond John Ehlers' original intended design. This action packed indicator is a radically revamped version of his original filter using novel techniques. My aim was to explore whether providing even more enhanced responsiveness and lesser lag is possible and how. Presented here is my mind warping results to witness.
EHLERS' LAGUERRE EXPLAINED:
First and foremost, the concept of Ehlers' Laguerre-izing method deserves a comprehensive deep dive. Ehlers' Laguerre filter design, as it functions originally, begins with his Ultimate Smoother (US) followed by a gang of four LERP (jargon for Linear intERPolation) filters. Following a myriad of cascading LERPs is a window-like FIR filter tapped into the LERP delay values to provide extra smoothness via the output.
On a side note, damping factor controlled LERP filters resemble EMAs indeed, but aren't exactly "periodic" filters that would have a period/length parameter and their subsequent calculations. I won't go into fine-grained relationship details, but EMA and LERP are indeed related in approach, being cousins of similar pedigree.
EXAMINING LAGUERRE:
I focused firstly on US initialization obstacles at Pine's bar_index==0 with nz() in abundance. The next primary notion of intrigue I mostly wondered about was, why are there four LERP elements instead of fewer or more. Why not three or why not two LERPs, etc... 1-4-6-4-1, I remember seeing those coefficients before in high pass filters.
Gathering my thoughts from that highpass knowledge base, I devised other tapped configuration modes to inspect their behavior out of curiosity. Eureka! There is actually more to Laguerre than Ehlers' mind provided, now that I had formulated additional modes. Each mode exhibits it's own lag/smoothness characteristics better than the quad LERPed version. I narrowed it down to a total of 5 modes for exploration. Mode 0 is just the raw US by itself.
ANALYZING FILTER BEHAVIORS:
Which option might be possibly superior, and how may I determine that? Fortunately, I have a custom-built analyzer allowing me to thoroughly examine transient responses across multiple periodicities simultaneously, providing remarkable visual insights.
While Ehlers has meagerly touched upon presenting general frequency responses in his books, I have excelled far beyond that. This robust filter analysis capability enables me to observe finer aspects hidden to others, ultimately leading to the deprecation of numerous existing filters. Not only this, but inventing entirely new species of filtration whether lowpass, highpass, or bandpass is already possible with a thorough comprehensive evaluation.
Revealing what's quirky with each filter and having the ability to discover what filters may be lacking in performance, is one of it's implications. I'm just going to explain this: For example US has a little too much overshoot to my liking, along with nonconformant cutoff frequency compliance with the period parameter. Perhaps Ehlers should inspect US coefficients a bit closer... I hope stating this is not received in an ill manner, as it's not my intention here.
What this technically eludes to is that UltimateSmoother can be further improved, analogous to my Laguerre alterations described above. I will also state Laguerre can indeed be reformulated to an even greater extent concerning group delay, from what I have already discussed. Another exciting time though... More investigative research is warranted.
LAGUERRE CONCLUSIONS:
After analyzing Laguerre's frequency compliance, transient responses, amplitudes, lag, symmetry across periodicities, noise rejection, and smoothness... I favor mode 3 for a multitude of reasons over the mode 4 configuration, but mostly superb smoothing with less lag, AND I also appreciated mode 1 & 2 for it's lower lag performance options.
Each mode and lag (phase shift) damping value has it's own unique characteristics at extremes, yet they demonstrate additional finesse in it's new hybrid form without adding too much more complexity. This multicator has a bunch of Laguerre filters in the overlay chart over many periodicities so you can easily witness it's differing periodic symmetries on an input signal while adjusting lag and mode.
LAGUERRE OSCILLATOR:
The oscillator is integrated into the laguerreMulti() function for the intention of posterity only. I performed no evaluation on it, only providing the code in Pine. That wasn't part of my intended exploration adventure, as I'm more TREND oriented for the time being, focusing my efforts there.
Market analysis has two primary aspects in my observations, one cyclic while the other is trending dynamics... There's endless oscillators, but my expectations for trend analysis seems a little lesser explored in my opinion, hence my laborious trend endeavors. Ehlers provided both indicator facets this time around, and I hope you find the filtration aspect more intriguing after absorption of this reading.
FUNCTION MODULES EXPLAINED:
The Ultimate Smoother is an advanced IIR lowpass smoothing filter intended to minimize noise in time series data with minimal group delay, similar to a traditional biquad filter. This calculation helps to create a smoother version of the original signal without the distortions of short-term fluctuations and with minimal lag, adjustable by period.
The Modified Laguerre Lowpass Filter (MLLF) enhances the functionality of US by introducing a Laguerre mode parameter along side the lag parameter to refine control over the amount of additional smoothing/lag applied to the signal. By tethering US with this LERPed lag mechanism, MLLF achieves an effective balance between responsiveness and smoothness, allowing for customizable lag adjustments via multiple inputs. This filter ends with selecting from a choice of weighted averages derived from a gang of up to four cascading LERP calculations, resulting with smoother representations of the data.
The Laguerre Oscillator is a momentum-like indicator derived from the output of US and a singular LERPed lowpass filter. It calculates the difference between the US data and Laguerre filter data, normalizing it by the root mean square (RMS). This quasi-normalization technique helps to assess the intensity of the momentum on any timeframe within an expected bound range centered around 0.0. When the Laguerre Oscillator is positive, it suggests that the smoothed data is trending upward, while a negative value indicates a downward trend. Adjustability is controlled with period, lag, Laguerre mode, and RMS period.
