trend lines v1 nguyenquyThe idea is to find Pivot Highs (PH) and Pivot Lows(PL) first.
Then, If current H is smaller then previous H (means no new higher high and possible downtrend) then draw trend line using them. and also it checks previous trend line (if exits) and if current angle is smaller then don't extend previous one.
Same idea when using Pivot Lows, If current L is higher then previous L (means no new lower low and possible uptrend) then draw trend line using them. and also it checks previous trend line (if exits) and if current angle is smaller then don't extend previous one.
Optionally style of old trend lines drawn as dashed.
Hope you enjoy it!
Indicators and strategies

Compact Swing Leg Tracker (Strict, Static PB, Compact Table)Simple Swing Leg Tracker is the evolution of the original Simple Swing indicator — rebuilt for smoother leg tracking, cleaner visuals, and added context. It automatically identifies up and down legs in real time, plotting an anchor line at the prior swing point and a live line at the current extreme. The direction flips automatically when price breaks beyond the opposite swing, keeping the chart aligned with the active trend.
It tracks leg size, live pullback %, and the deepest (static) pullback so far in the leg. A compact two-row stats panel displays the current leg metrics on top and the most recent up- and down-leg sizes beneath for quick reference.
Highlights:
Evolution of the Simple Swing indicator
Auto-flip between up/down legs on swing breaks
Real-time pullback and static pullback tracking
Displays last completed up/down leg sizes
Minimal two-line layout (swing + live extreme)
Compact color-coded stats table

Three Golden Crosses Stock SelectionThe "Three Golden Crosses" stock selection signal indicates a continued bullish trend.

MA-boll short term tradingThis is a very accurate short-term buy/sell point that I have derived from my many years of experience in short-term trading.

Liquidation Liquidity Overlay — Michael D. Version 5)Im publishing this trading strategy to help traders

MACD Advanced [CongTrader]Title:
MACD Advanced – Enhanced Trend & Momentum Analysis
Short Description (Displayed on Chart)
MACD Advanced [CongTrader is an enhanced version of the traditional MACD, combining gradient histogram, multi-layer EMA, and smart markers to identify trend and momentum more accurately. Supports bullish/bearish crossover alerts in line with trend, helping traders seize opportunities quickly.
Detailed Description (SEO-friendly, professional)
MACD Advanced is designed for traders who want to:
Track market momentum through slope and gradient of the MACD.
Identify short-term and long-term trends using EMA 50 & EMA 200.
Receive visual trading signals with bullish/bearish markers directly on the chart.
Set intelligent alerts when MACD aligns with the trend, ensuring no opportunities are missed.
Key Features:
MACD Slope: measures the rate of MACD change to identify strong or weak momentum.
Gradient Histogram: colors change according to momentum → easy to see increasing/decreasing strength.
Multi-layer EMA: EMA 50 (short-term trend) & EMA 200 (long-term trend) → reduces noise.
Smart Markers: up/down triangles display crossover points + color indicates momentum.
Built-in Alerts: triggers when bullish/bearish signals confirm trend alignment.
How to Use
Setup:
Paste the code into Pine Editor → click “Add to Chart”.
Adjust input parameters:
Fast EMA / Slow EMA / Signal Line Length → MACD sensitivity.
Short-term EMA / Long-term EMA → trend confirmation.
Toggle EMA Trend Filter, histogram, and markers as needed.
Reading Signals:
Bullish Signal: MACD line crosses above signal line + positive slope + price above EMAs → consider buying.
Bearish Signal: MACD line crosses below signal line + negative slope + price below EMAs → consider selling.
Dark green histogram → strong upward momentum; dark red → strong downward momentum.
Markers on chart indicate crossovers → combine with EMA trend for confirmation.
Advanced Tips:
Use multiple timeframes to confirm trends.
EMA filters help reduce false signals in sideways markets.
Disclaimer
⚠️ Disclaimer:
This indicator is for educational and technical analysis purposes only. It **does not constitute financial advice** and does not guarantee profit.
Any trading decisions made based on this indicator are the sole responsibility of the user. Always apply proper risk management.
Acknowledgment
Thank you for using MACD Advanced [CongTrader! Wishing you safe and successful trading. Feedback and improvement suggestions are welcome on TradingView
MACD, MACD Advanced, MACD Histogram, MACD Trend, EMA Filter, Momentum, Technical Analysis, Trading, CT Style, Alerts

Cloud Matrix [CongTrader]🌥 Cloud Matrix
🔹 Short Description
A modern and enhanced Ichimoku-based system designed for Crypto, Forex, and Stock traders.
Cloud Matrix helps identify trends, momentum shifts, and Kumo breakouts with multi-timeframe EMA filters and a visual market summary table.
🧭 Full Description
Cloud Matrix is a next-generation evolution of the classic Ichimoku Cloud — optimized for the dynamic conditions of today’s markets, especially crypto and high-volatility assets.
This indicator combines the visual clarity of Ichimoku with advanced filters, adaptive presets, and built-in signal logic to help traders make more confident trend-based decisions.
⚙️ ✨ Key Features & Innovations
Preset System for Different Markets:
🕊 Traditional (9/26/52) – Standard Ichimoku setup
⚡ Crypto Fast (10/30/60) – Faster response for volatile markets
⚖️ Crypto Medium (20/60/120) – Balanced settings for swing trading
⚙️ Custom – Full manual control over Ichimoku parameters
Higher Timeframe EMA200 Filter:
Optionally apply a 200 EMA filter from a higher timeframe (e.g., 4H, 1D).
Only confirms bullish signals when the price is above the higher TF EMA, and bearish signals when below.
Dynamic Market Summary Table:
A real-time dashboard showing:
Price vs. Cloud position
Cloud twist direction (Span A vs. Span B)
Tenkan/Kijun relation
Chikou position
Higher timeframe EMA200 trend
Built-in Trade Signals & Alerts:
🔔 TK Cross (Tenkan-Kijun crossovers)
☁️ Kumo Breakouts (price breaks above/below the cloud)
Optional “alerts on candle close” to avoid fake intrabar signals.
Enhanced Visuals:
Cloud color auto-adjusts for bullish/bearish sentiment.
Adjustable opacity for better chart visibility.
Signal labels appear directly on the chart for clarity.
📘 How to Use
1️⃣ Add to chart:
Search for “Cloud Matrix ” in TradingView’s Indicators Library.
Works on all timeframes and markets.
2️⃣ Choose a preset:
Traditional – for Stocks/Forex.
Crypto Fast or Crypto Medium – for Crypto or high-volatility assets.
3️⃣ Use the Higher TF Filter:
Enable “Use HTF EMA200 Filter” → set timeframe (e.g., 4H or 1D).
Only take bullish setups when price > EMA200 on HTF, bearish setups when below.
4️⃣ Interpret the signals:
🟢 TK Cross (Bullish): Tenkan crosses above Kijun → potential early uptrend.
🔴 TK Cross (Bearish): Tenkan crosses below Kijun → potential early downtrend.
🌥 Kumo Break (Bullish): Price breaks above the cloud → strong trend confirmation.
🌩 Kumo Break (Bearish): Price breaks below the cloud → strong bearish continuation.
5️⃣ Read the Cloud Matrix Table:
Quickly view trend alignment:
Metric Green Red Gray
Price vs Cloud Above Below Inside
Cloud Twist Bullish Bearish —
Tenkan/Kijun Bullish Bearish —
Chikou Span Above Below —
HTF EMA200 Uptrend Downtrend Off
🌐 Practical Applications
Excellent for trend trading, swing setups, and dynamic support/resistance analysis.
Ideal for confirming directional bias before entering a trade.
Can be combined with RSI, MACD, or Volume indicators for stronger confluence.
Suitable for Crypto, Forex, Indices, and Stocks.
⚠️ Disclaimer
The Cloud Matrix script is provided for educational and analytical purposes only.
It is not financial advice, nor does it guarantee performance or profitability.
All trading decisions are made at your own risk.
Always verify signals with your own analysis and proper risk management.
🙏 Acknowledgments
A heartfelt thank-you to the TradingView community and all the traders who inspire continuous innovation.
Your feedback, ideas, and collaboration help make this tool possible.
If you find Cloud Matrix useful — please give it a like, comment, or share it to help others learn too. 💚
— CongTrader
📅 2025 | Version 1.0 – Open Source Educational Release
🏷️ Suggested Tags
Ichimoku, Cloud, Kumo, Trend, EMA200, Crypto, Forex, Swing, Multi-Timeframe, CongTrader, Educational, Indicator

Institutional Trend Confirmed PRO The Institutional Trend Confirmed PRO – v2.3 TUNE (Reactive & Strong) is an advanced institutional-grade indicator designed to confirm true trend direction and reversals with precision.
It combines adaptive RSI, ATR, ADX, and volume-delta filters into a single smoothed oscillator that reacts quickly yet remains stable across all timeframes.
The indicator assigns weighted confirmation scores between 0–100 to highlight early institutional flow, trend continuation, and strong reversal zones.
Works best on 30m, 1H, and 4H charts, offering reliable confirmation for swing and intraday traders who need fewer false signals and stronger momentum validation.
Includes optional alert signals when strong confirmation levels are reached.

Range breaking indicatorDescription
Bull/Bear Area Ratio (last N candles) helps identify potential end-of-range situations by analyzing the relative strength of bullish vs bearish candles over a rolling window of N bars.
Instead of simply counting up or down candles, this script measures the "area" of each candle — the absolute distance between open and close, optionally weighted by volume.
By summing these areas over the last N bars, it calculates the percentage of bullish and bearish energy within that period.
When both sides become balanced (near 50/50), it often signals range exhaustion or possible trend transition.
How it works
Calculates the bullish and bearish area of each candle (abs(close - open), optionally × volume).
Maintains rolling buffers of the last N bars to compute running totals.
Plots both Bullish % (green) and Bearish % (red).
Highlights possible range-ending zones when the bullish ratio nears 50% ± threshold.
Displays a label showing the current balance.
Includes an alert condition when equilibrium is detected.
Inputs
Number of candles (N) – Rolling window length.
Use volume weighting – Multiplies each candle’s area by its volume.
Balance threshold (%) – Sensitivity for detecting equilibrium (default: 10%).
Best use
Combine with volume or volatility indicators to confirm market compression or expansion.
Use on higher timeframes (H1, H4, D1) to detect early signs of accumulation or distribution.
Works across all asset types: crypto, forex, stocks, indices, etc.
Alerts
An alert is triggered when:
“The range of the last N candles is balanced (possible end of range).”

RonaldoCalculates ATR (Average True Range): Measures market volatility over a customizable period (default: 10). A higher ATR means more volatility. Calculates the Supertrend: Combines ATR with a multiplier (default: 3)

Premarket High/Low (4:00–9:30 AM)This indicator allows me to visualize the full range in which the price moved during the pre-market session, providing a bearish confirmation when the low is broken and a bullish confirmation when the high is breached.

Williams Percent Range + MAA modernized take on the classic Williams %R oscillator — enhanced with a configurable moving average (SMA, EMA, RMA, WMA, HMA, or KAMA) for trend confirmation. Overbought and oversold zones are fully adjustable, and background highlights appear when momentum shifts: green for bullish crosses in oversold areas, red for bearish crosses in overbought zones.

cd_sfp_CxGeneral:
This indicator is designed to assist users who trade the Swing Failure Pattern ( SFP ).
In technical literature (various definitions exist), an SFP is a situation where the price violates a previous swing level but fails to close beyond that level.
• (Liquidity Sweep)
• (Buyer or seller dominance)
• (Stop hunt)
• (Turtle Soup)
The general strategy is built upon seeking trade opportunities after an SFP is formed and conviction is established that the market direction has changed.
Components used to gather confirmation:
• Determining Bias: Periodic SAR
• Obtaining Breakout/Reversal Confirmation: Change in State Delivery (CISD)
• Defining the Buyer/Seller Block (Supply/Demand Zones): Mitg Blocks (Mitigation Blocks), FVG (Fair Value Gaps), and Standard Deviation Projection
• Key Levels: Previous HTF (Higher Time Frame) levels
• Setting Targets: Standard Deviation Projection
• Trade Management: Anchored VWAP and opposing blocks
• Time-Based Context: Session Killzone times
• Notifications: An alarm/alert system will be utilized to stay informed.
________________________________________
Details:
Swing and Swing Failure Pattern:
Swing Sweep Types (Liquidity Sweep):
1. Single
2. Consecutive (The liquidity of the entity that swept the liquidity is being swept)
Bias Determination
We need to filter out the numerous SFPs that occur across all time frames. Our first strong filter will be the Bias. We will only look for trades aligned with our bias.
We will use Periodic SAR (Stop and Reverse) to determine the bias. We compare the price with the SAR value from a Higher Time Frame than the one we are trading on.
• Price > SAR => Bullish Bias
• Price < SAR => Bearish Bias
Depending on the pair, H1 SAR may be chosen for scalp trades, and Daily/Weekly SAR for intraday and swing trades.
Key Levels
Strategies looking for trades after a liquidity grab generally state that the sweep / stop hunt movement should occur at a significant price level.
The most fundamental Key Level levels are (User can customize):
• Previous Week High & Low
• Previous Day High & Low
• Previous H4 High & Low
• Previous H1 High & Low
• Asia Killzone High & Low
• London Killzone High & Low
• New York Killzone High & Low
• Monday Range High & Low values
We will prefer SFP formations that occur when these levels are swept. When Key Levels are violated, an information label appears on the screen.
Blocks / Zones
To strengthen our hand, we will use three types of blocks/zones, either with Key Levels or separately. When an SFP structure is formed in these areas (along with bias and breakout confirmation), our expectation is for the price to continue in our desired direction. These regions are:
1. Mitigation Blocks (Mtg)
o (Details can be found in the cd_VWAP_mtg_Cx indicator)
o In short: A second candle, following a bullish candle, crosses its high but fails to close above it. We call this a sweep / SFP. When the price, which was expected to go to the low, instead makes a new high/close, an Mtg block is formed. (Buyers are dominant)
2. FVGs (Fair Value Gaps)
o We use classic FVG structures.
3. Standard Deviation Projection Boxes
o When we get an SFP structure + breakout confirmation (CISD), we use the Standard Deviation Projection to determine our profit-taking and take-profit levels.
o Based on the idea that the price often respects the range between -2 and -2.5 of the projection values, we box this range and use it as our area of interest. (Our expectation is for the price to reverse after reaching this target).
o Let's mark it on the chart.
Confirmation
To summarize what has been explained so far: we look for the price to form an SFP structure in levels/zones we deem important, aligned with our bias, and for the breakout to be confirmed with a CISD.
No single component is strong on its own, but the success rate increases when they occur together.
We observe the following as additional confirmation along with the CISD: a new Mtg block forming in the direction of the breakout, high-volume movement (with FVG and a large body), and respect for VWAPs, the resistance/support line, and the defense block.
Additional Confirmations with Breakouts:
• Defence block, new mtg and VWAP
• Resistance / Support Line:
Indicator Signals
The indicator marks all formed sweeps, selected key levels, blocks, the projection, and CISD confirmations on the screen. The candle where the CISD confirmation occurs is indicated by an arrow.
• Arrows with double short lines signify a CISD that follows an SFP occurring at a Key Level.
• All other CISD candle indications are shown with single-line arrows.
Trade Management
When selecting profit targets in trades (preferably), the projection, opposing blocks, and structures that have formed are taken into account. Do not neglect to look at the structures that have formed against you when entering a trade.
Menu Settings:
• For Mtg blocks, the trading timeframe or a higher timeframe can be selected.
• FVGs formed in the current timeframe are displayed when the price creates an SFP (in "Fvg" option).
• Deviation boxes are displayed when the price creates an SFP (in box).
• The SAR HTF setting (H1) for scalp trades may vary depending on the pair. Users trying trades on higher timeframes should increase the HTF setting.
o Example: If you are looking for a trade with an SFP structure on H1, the SAR HTF setting should be H4 or higher.
• VWAP lines are refreshed starting from the candle that executed the sweep when the price forms an SFP. The only setting to adjust is the source selection setting (hlc3 is selected).
• Time frames and Killzone / Special Zone settings for Key Levels can be changed/should be checked.
Alarms / Alerts:
The conditions that will trigger an alert can be selected from the menu.
• To receive an alert aligned with the bias, the "Alignment with bias" checkbox must be selected.
• The alert should be set on the timeframe where you plan to enter the trade.
• The display options do not affect the alarm conditions. (Example: FVGs are monitored even when the menu selection is "off").
• If the necessary conditions are met, the alarm is triggered on the new candle that opens after the CISD confirmation.
• The alarm will not be triggered more than once at the same Key Level.
The user can preferably select alerts:
• Bias-aligned or Bias-independent
• Sweep (without waiting for CISD)
• Sweep + CISD (without looking for other conditions)
• Sweep + Key Level + CISD (the swept level is a Key Level)
• Sweep + Mtg / Fvg / Dev. + CISD (SFP formed in any of the blocks)
• Sweep + Mtg + CISD (SFP formed in the Mtg block)
• Sweep + Fvg + CISD (SFP formed inside the FVG)
• Sweep + Deviation Box + CISD (SFP formed inside the Dev. Box)
• Sweep + Key Level + Mtg / Fvg / Dev. + CISD (SFP formed simultaneously at a Key Level and any of the blocks)
Trade Example:
• Conditions: Bias-aligned + Sweep + Mtg/Fvg/Dev (at least one) + CISD
• Extra Confirmations: Respect for the Defense Block + Respect for VWAP
• Target (TP): Projection between -2 and -2.5
I welcome your thoughts and suggestions regarding my indicator, which I believe will be successful in the long run by adhering to uncompromising risk management and a strict trading plan.
Happy Trading!

Time Based LiquidityTime Based Liquidity + Key Opens. Plots the High and Low of Monthly - Weekly - Daily - Asia - London. Key Opens - Monthly Open - Weekly Open - Midnight Open - Cycle Open - 9:30 Open.

JonnyFutures ScalpomaticThis indicator combines Fair Value Gap (FVG) detection with Exponential Moving Average (EMA) signals to help identify potential trade entry points based on market inefficiencies and trend direction.
⚙️ Main Components
1. EMAs
Two EMAs are calculated:
EMA 20 (short-term trend)
EMA 50 (medium-term trend)
ema20 = ta.ema(close, len20)
ema50 = ta.ema(close, len50)
These are plotted on the chart:
Orange line = EMA 20
Purple line = EMA 50
2. Fair Value Gaps (FVGs)
The script looks for gaps in price structure (imbalances):
Bullish FVG → when the high from two bars ago is less than the current bar’s low
→ Indicates a potential bullish inefficiency.
Bearish FVG → when the low from two bars ago is greater than the current bar’s high
→ Indicates a potential bearish inefficiency.
bullishFVG = high < low
bearishFVG = low > high
When found, the background color changes:
Light Green for bullish FVGs
Light Red for bearish FVGs
bgcolor(bullishFVG ? color.new(color.green,90) : na)
bgcolor(bearishFVG ? color.new(color.red,90) : na)
3. EMA Crossover Signals
The script plots visual buy/sell markers when the closing price crosses above or below each EMA:
For EMA 20:
✅ Long signal (triangle up, lime): close crosses above EMA 20
❌ Short signal (triangle down, red): close crosses below EMA 20
For EMA 50:
✅ Long signal (triangle up, aqua): close crosses above EMA 50
❌ Short signal (triangle down, maroon): close crosses below EMA 50
These signals help identify potential trend-following entries or exits.
📈 How to Use It
Trend Confirmation:
Watch the EMAs — if EMA20 > EMA50, the trend is generally bullish; if EMA20 < EMA50, it’s bearish.
FVG Zones:
When a bullish or bearish FVG appears, it highlights potential retracement zones where price may rebalance before continuing the trend.
Entry Timing:
Combine FVGs with EMA cross signals for confluence:
Long bias → bullish FVG + price crossing above EMA 20 or 50.
Short bias → bearish FVG + price crossing below EMA 20 or 50.
🎯 Summary
This indicator:
Detects Fair Value Gaps and shades them visually.
Plots EMA 20 and EMA 50 to define short- and mid-term trends.
Marks entry/exit signals when price crosses these EMAs.
Is designed for trend-following trades with FVG confirmation

MSB Trend Breakout Indicator**MSB Trend Breakout Indicator: The Low-Risk Trend Catcher**
This indicator is built on a proprietary system designed to identify and confirm high-momentum price breakouts within the prevailing market trend.
**What It Does:**
* **Confirms Trend Bias:** Uses a customized Moving Average filter to determine the direction of institutional flow (Long or Short).
* **Identifies Entry Momentum:** Plots signals only when price breaks a calculated short-term support/resistance level, confirming strong directional momentum.
* **Filters Noise:** Excludes signals during market chop or counter-trend movement, focusing on higher probability setups.
**Optimized For:** XAUUSD (Gold) on 15m/30m charts.
---
**Important Note & Risk Disclosure:**
The underlying logic is designed to optimize risk management. This tool is for informational and educational use only. Past performance is not indicative of future results, and this indicator does not guarantee profits. Please use appropriate risk tolerance when trading.

Ripping & Dipping ReversalsUses a ribbon of emas from 987 to 8. When all emas align from highest to lowest in either direction we have "Ripping" or "Dipping." If ripping or dipping end AND there have been a set number of rip/dip ends since the last crossover of the 987, a trade is indicated.

TREND - Clean WaveTrend oscillator. Displays WT1 (blue), WT2 (orange), momentum histogram, and key levels (58/51/-51/-58). Includes table with current state (overbought/oversold/neutral) and trend. Ideal for confirming momentum on any asset and timeframe.

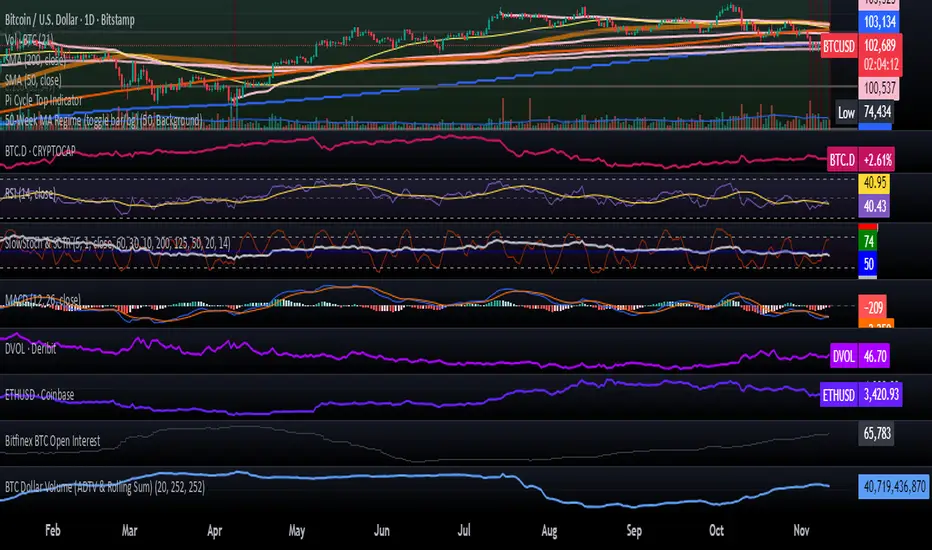
Bitcoin 50-Week MA “Cycle Line” — Bull/Bear RegimeOverview. This indicator plots the true 50-week simple moving average (SMA) on any timeframe by requesting weekly data, then colors the chart to show a bull/bear regime: green when price is above the 50-week MA, red when below. Many Bitcoin analysts treat this average as a cycle “line in the sand”—multiple weekly closes below it have historically coincided with the end of bull phases and the start of broader drawdowns, while holding above has aligned with continued strength.
Why it matters. Recently, research notes and market commentary have flagged the 50-week MA near ~$100k–$103k (feed-dependent) as a critical support/resistance area to watch. Use this tool to track that threshold on your own exchange feed and timeframe.
How it works.
Pulls weekly closes via request.security() and computes a 50-week SMA (not an EMA).
Plots the line on your current chart and applies a regime color (background or candles, toggle in settings).
Works on any symbol; optimized for BTC spot and futures.
Notes.
MA values vary by data source/exchange; confirm on a weekly chart if needed.
A single intrawEEK break can whipsaw; many analysts look for confirmed weekly closes. Pair with your macro/liquidity view and risk rules.
SMACD / MACD Screener with diffsTo find stocks certain values of SMACD, for instance SMACD crosses up through signal line when below of 0-line.

Stochastic + Bollinger Bands Multi-Timeframe StrategyThis strategy fuses the Stochastic Oscillator from the 4-hour timeframe with Bollinger Bands from the 1-hour timeframe, operating on a 10-hour chart to capture a unique volatility rhythm and temporal alignment discovered through observational alpha.
By blending momentum confirmation from the higher timeframe with short-term volatility extremes, the strategy leverages what some traders refer to as “rotating volatility” — a phenomenon where multi-timeframe oscillations sync to reveal hidden trade opportunities.
🧠 Strategy Logic
✅ Long Entry Condition:
Stochastic on the 4H timeframe:
%K crosses above %D
Both %K and %D are below 20 (oversold zone)
Bollinger Bands on the 1H timeframe:
Price crosses above the lower Bollinger Band, indicating a potential reversal
→ A long trade is opened when both momentum recovery and volatility reversion align.
✅ Long Exit Condition:
Stochastic on the 4H:
%K crosses below %D
Both %K and %D are above 80 (overbought zone)
Bollinger Bands on the 1H:
Price reaches or exceeds the upper Bollinger Band, suggesting exhaustion
→ The long trade is closed when either signal suggests a potential reversal or overextension.
🧬 Temporal Structure & Alpha
This strategy is deployed on a 10-hour chart — a non-standard timeframe that may align more effectively with multi-timeframe mean reversion dynamics.
This subtle adjustment exploits what some traders identify as “temporal drift” — the desynchronization of volatility across timeframes that creates hidden rhythm in price action.
→ For example, Stochastic on 4H (lookback 17) and Bollinger Bands on 1H (lookback 20) may periodically sync around 10H intervals, offering unique alpha windows.
📊 Indicator Components
🔹 Stochastic Oscillator (4H, Length 17)
Detects momentum reversals using %K and %D crossovers
Helps define overbought/oversold zones from a mid-term view
🔹 Bollinger Bands (1H, Length 20, ±2 StdDev)
Measures price volatility using standard deviation around a moving average
Entry occurs near lower band (support), exits near upper band (resistance)
🔹 Multi-Timeframe Logic
Uses request.security() to safely reference 4H and 1H indicators from a 10H chart
Avoids repainting by using closed higher-timeframe candles only
📈 Visualization
A plot selector input allows toggling between:
Stochastic Plot (%K & %D, with overbought/oversold levels)
Bollinger Bands Plot (Upper, Basis, Lower from 1H data)
This helps users visually confirm entry/exit triggers in real time.
🛠 Customization
Fully configurable Stochastic and BB settings
Timeframes are independently adjustable
Strategy settings like position sizing, slippage, and commission are editable
⚠️ Disclaimer
This strategy is intended for educational and informational purposes only.
It does not constitute financial advice or a recommendation to buy or sell any asset.
Market conditions vary, and past performance does not guarantee future results.
Always test any trading strategy in a simulated environment and consult a licensed financial advisor before making real-world investment decisions.

SMACD / MACD Screener with diffsTo create Pine screener with values for SMACD. Screen for example after crosses up for SMACD through signal when below 0-line.

Gold-Silver Ratio (GSR) ComparatorThis is a simple GSR comparator script. You can adjust the SMA and the various inputs, or use the default spot Gold/Silver.
