Indicators and strategies

SNR support and resistance支撐壓力線SNR support and resistance The dotted line represents a test, and the solid line represents a new support.


Singh Divergence SignalsThis indicator detects potential trend reversals by combining candle strength and volume momentum. It signals when candle value and Price Volume Trend (PVT) oscillator diverge, marking bullish and bearish reversal points directly on the price chart with arrows. Alerts notify you of these key divergence signals to help improve trade timing.

Relative Price Strength (RPS)Relative Price Strength (RPS) is a technical analysis indicator that measures the performance of a specific symbol relative to a benchmark or "Base Symbol".

(BTT) Asia & London Most Recent High/LowAsia and London session Highs and Lows
Completed version
This Marks out the Asian levels, as well as the London levels for you
You can specify the time frame that you want it to mark out in the settings

StarsAlignStarsAlign Indicator
The StarsAlign indicator identifies potential buy opportunities by combining three key technical conditions for precise market entry signals. A "BUY" flag is plotted on the chart when:
RSI is below 30, indicating oversold conditions.
Price is at or below the 190-day Simple Moving Average, suggesting a potential support level.
Average True Range (ATR) changes direction, signaling a shift in market volatility.
Features:
Customizable inputs for RSI length, oversold level, moving average period, and ATR length.
Visual "BUY" labels for clear entry signals.
Overlays the 190-day SMA for reference.
Usage:
Ideal for traders seeking confluence in oversold conditions, trend support, and volatility shifts. Apply to any timeframe or market, and adjust parameters to suit your strategy. Always combine with other analysis for best results.

🔔 Open Range Breakout Pro – Dashed Line FixedOpen Range Breakout Pro – Midpoint + Alerts
This advanced indicator captures the first 5-minute open range after the session begins and unlocks powerful intraday levels based on that structure. It’s ideal for traders looking to trade range breakouts, mean reversion, or high-volume trend confirmations.
🔍 What it does:
Locks in the first 5-min candle high/low after market open
Plots the upside and downside targets
Dynamically shows the range midpoint
Optional extension levels at 1.5x and 2x the opening range
Highlights breakouts with conditional background colors
Includes volume confirmation toggle to filter weak moves
Auto-resets daily for clean reinitialization
Compatible with stocks, futures, and crypto
🛎️ Built-in Alerts:
📈 Price crosses above high
📉 Price crosses below low
🔁 Price returns into the range
📦 Fully customizable and optimized for both discretionary and alert-based trading systems.

Weekly Day & Morning Session HighlighterThis is my Market Maker Method Daily Chart.
This paints red columns on the Weekends to remind you that Market Makers aren't active and anything can happen.
Each day of the week shows a different color to demonstrate the start and end of the day to more easily track patterns.
The black bar is the early morning setup period which typically results in an initial liquidity hunt fake out before a quick reversal.
This indicator is a work in progress inspired by TradeTravelChill.com
- Crypto Crow

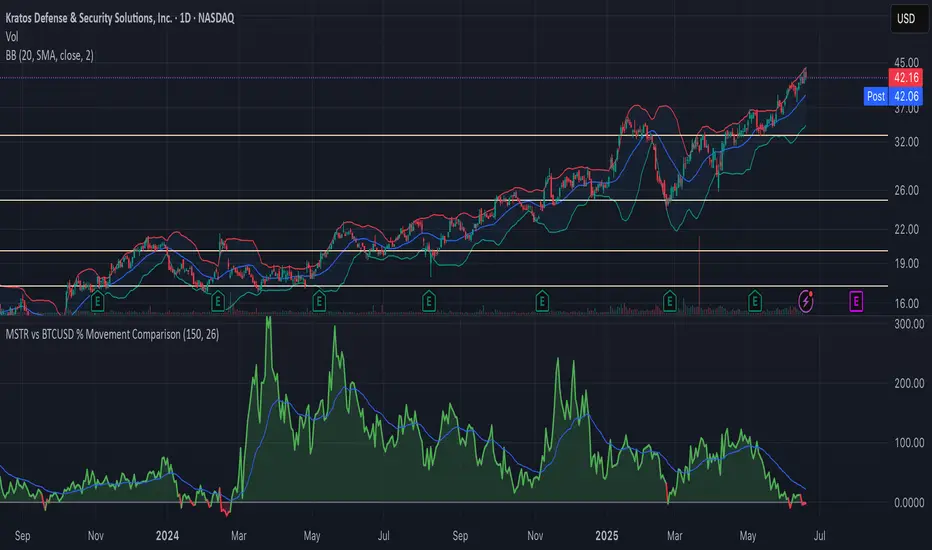
MSTR vs BTCUSD % Movement ComparisonThe indicator, in its current form, is a custom Pine Script (version 6) tool named "MSTR vs BTCUSD % Movement Comparison" that visually compares the percentage price movements of MicroStrategy (MSTR) and Bitcoin (BTCUSD) over a user-defined lookback period. It plots the difference in their percentage changes (diff_pct = mstr_pct - btcusd_pct) as a line, with a zero line for reference, and uses green/red coloring to indicate whether MSTR is outperforming (green, above zero) or underperforming (red, below zero) BTCUSD. The area between the difference line and zero line is filled with semi-transparent green or red for clarity. Additionally, an adjustable-period Exponential Moving Average (EMA) of the percentage difference smooths the trend, helping identify momentum shifts. The indicator is fixed to compare MSTR and BTCUSD, ensuring consistent output regardless of the chart’s active symbol (e.g., MSTR, MTPLF, or others).
Key Features:
Percentage Difference: Shows MSTR’s percentage change minus BTCUSD’s, highlighting relative performance.
Zero Line: A gray solid line at 0 for reference.
Color Coding: Green line/fill when MSTR outperforms, red when it underperforms.
Adjustable EMA: User-defined EMA period (default: 26) smooths the percentage difference.
Fixed Comparison: Always compares MSTR vs. BTCUSD, unaffected by the chart’s symbol.
User Inputs: Lookback period (default: 50 bars) and EMA period (default: 26) are customizable.
Example: On a 1-hour chart, if MSTR rises 4% and BTCUSD rises 1% over 50 bars, the difference line plots at +3 (green) with green fill, and the 26-period EMA might be at +2.2, indicating MSTR’s outperformance trend.
CQ_MTF Target Price Lines [BitCoin Hoy]This script is dedicated to Esteban Pérez, host and creator of Youtube Channel "Bitcoin Hoy".
The idea behind this indicator is his daily sugestion of having a notebook to write down the Intraday, 4H, Daily and Weekly calculated target prices. All the community in his channel will find this script helpful.
After typing in the target prices, they'll be shown on the chart.
Thank you very much Esteban!

Professional Breakout ChecklistThe " Professional Breakout Checklist Indicator " designed to automate and visually represent the stringent criteria for high-probability breakout trade entries. This indicator transforms a manual checklist into a dynamic, chart-based system, leveraging TradingView's robust charting and custom indicator capabilities .
At its core, the indicator systematically identifies consolidation phases, which are crucial precursors to genuine breakouts. It achieves this by calculating the range of price action over a user-defined lookback period and comparing it to a multiple of the Average True Range (ATR), a measure of market volatility. When price tightens within this calculated range, the indicator visually shades the consolidation zone on the chart, signaling potential accumulation or distribution.
For a breakout to be considered valid, the indicator demands specific volume and volatility confirmation. It calculates the average volume over a set period and only triggers a signal if the breakout candle's volume significantly exceeds this average—specifically, 1.5 times the mean volume. This ensures that the price movement has strong conviction and institutional interest behind it, filtering out weak or false breakouts.
The breakout trigger mechanism is precise, requiring the breakout candle to close not just beyond the detected support or resistance, but by a user-specified number of "clearance ticks." This addresses the need to avoid noise and confirm the true breach of a level. Upon a confirmed breakout, the indicator immediately calculates and plots a suggested risk-reward setup. This includes a stop-loss level, derived from the ATR, and a take-profit target that adheres to a minimum 2:1 reward-to-risk ratio. These visual cues assist traders in defining their risk exposure and potential gains before entry.
Furthermore, the indicator integrates crucial market context by offering an optional trend filter, typically a 50-period Exponential Moving Average (EMA). This ensures that breakout signals align with the broader market direction, enhancing probability.
Beyond these core checklist items, the indicator incorporates professional enhancements. It provides an option to wait for retest confirmation, a strategy often employed by seasoned traders where price retests the breakout level before continuing its move, offering a potentially safer entry point. Additionally, a false breakout filter assesses the quality of the breakout candle, prioritizing those with strong bodies and minimal wicks, which are less likely to be "trap" moves.
The indicator is displayed directly on the chart, using visual cues such as shaded consolidation boxes, distinct shapes for bullish/bearish entry signals, and plotted lines for stop-loss and take-profit targets. Its design enables traders to efficiently analyze setups, confirm adherence to their trading plan, and receive timely alerts for potential opportunities, streamlining the decision-making process within the dynamic trading environment of TradingView

RSI+MFI+RVI+stoch+BBAn indicator that displays five technical indicators in one code.
The technical indicators are:
RSI, MFI, RVI, Stoch, and BB.

Bias Bar Coloring + Multi-Timeframe Bias Table + AlertsMulti-Timeframe Bias Bar Coloring with Alerts & Table
This indicator provides a powerful, visual way to assess price action bias across multiple timeframes—Monthly, Weekly, and Daily—while also coloring each bar based on the current chart’s bias.
Features:
Persistent Bar Coloring: Bars are colored green for bullish bias (close above previous high), red for bearish bias (close below previous low), and persist the last color if neither condition is met. This makes trend shifts and momentum easy to spot at a glance.
Bias Change Alerts: Get notified instantly when the bias flips from bullish to bearish or vice versa, helping you stay on top of potential trade setups or risk management decisions.
Multi-Timeframe Bias Table: A table anchored in the top right corner displays the current bias for the Monthly, Weekly, and Daily charts, color-coded for quick reference. This gives you a clear view of higher timeframe context while trading any chart.
Consistent Logic: The same objective bias logic is used for all timeframes, ensuring clarity and reliability in your analysis.
How to Use:
Use the bar colors for instant visual feedback on trend and momentum shifts.
Watch the top-right table to align your trades with higher timeframe bias, improving your edge and filtering out lower-probability setups.
Set alerts to be notified of bias changes, so you never miss a potential opportunity.
This tool is ideal for traders who value multi-timeframe analysis, want clear visual cues for trend direction, and appreciate having actionable alerts and context at their fingertips.

previous day H/L 15 minThis indicator visualizes critical daily price levels to support intraday and swing trading decisions. Specifically, it calculates and displays the Previous Day High (PDH), Previous Day Low (PDL), and the midpoint (PDM) — the average of the high and low — based on price data from the prior trading day.
Each level line is anchored to start precisely at 6 PM New York time, marking the start of the trading day for many major markets. The lines then extend forward for a fixed duration, ensuring these key support and resistance zones remain visible well into the current trading session, giving traders a persistent frame of reference.
This persistent extension helps traders monitor price interaction with important levels throughout the day without cluttering the chart with obsolete lines. Labels indicating PDH, PDL, and PDM are displayed clearly on the left or right side of the chart, customizable to user preference.
By using this indicator, traders can better gauge potential reversal points, breakout zones, and price consolidation areas grounded on significant daily market structure, improving timing and risk management in their trading strategies.

Triple MA RS ConfluenceThis script evaluates relative strength confluence by comparing the ratio of an asset to a benchmark (e.g., Asset/SPY) against three configurable moving averages (MA #1, MA #2, MA #3).
Each bar is color-coded based on RS position relative to the MAs:
Lime Green — RS > all three MAs (full confluence)
Yellow — RS > MA #2 and MA #3, but ≤ MA #1 (partial confluence)
Red — RS ≤ MA #2 (no confluence)
Designed for systematic trend identification, this tool helps visually confirm RS alignment across short-, medium-, and long-term conditions. Inputs include adjustable MA lengths and types (EMA/SMA), benchmark symbol, and visual toggles for confluence state changes.
Pairs well with multi-timeframe RS strategies or clustered MA compression filters.

SniperMA Scalper (Long Only, Clean)use on 15s chart and back test from 01.01 2024 100.000k good luck and don't forget to like if you find good results

Astro's EMAScript Description – "Astro's EMA fill"
This TradingView indicator plots four Exponential Moving Averages (EMAs) and uses shaded fill areas to visually highlight bullish or bearish crossovers between two EMA pairs.
🔍 Key Features:
4 EMAs plotted:
EMA 1 (default 14) — Fast
EMA 2 (default 50) — Slow
EMA 3 (default 100) — Medium-Term
EMA 4 (default 200) — Long-Term
Shaded Fill Areas:
Area between EMA 1 & EMA 2 is filled green when EMA 1 is above EMA 2 (bullish), red when below (bearish).
Area between EMA 3 & EMA 4 is filled with the same logic, representing longer-term momentum.
Customizable Settings:
All EMA lengths and the price source are user-editable.
Transparent shading helps keep the chart clean while showing trend strength/direction.
📈 Use Case:
This tool helps you visually confirm:
Short-term vs long-term trend alignment
Trend strength and crossover points
Potential support/resistance zones formed by EMAs
Perfect for traders using multi-timeframe moving average confluence strategies or trend-based systems.
Let me know if you want to add:
Alerts when crossovers happen
Background color changes based on trend alignment
Toggle checkboxes for hiding individual EMAs or fills

Math by Thomas - SMC Structure ToolkitMath by Thomas – SMC Structure Toolkit is a purely visual educational tool based on Smart Money Concepts.
✅ Order Blocks: Marked using confirmed fractal swing highs/lows, optional displacement candle, and high volume filter.
✅ Fair Value Gaps (FVGs): Detected using a 3-bar gap logic, based on price imbalance.
✅ Fractals: Configurable between 3 or 5-bar logic to detect swing highs/lows.
✅ BoS / CHoCH: Labels are drawn comparing previous swing structures.
✅ Premium / Discount Zones: Based on the midpoint of the last confirmed swing high/low.
❌ This script does not generate alerts, signals, or entries.
✅ Meant only for educational visual analysis, not for auto trading or financial advice.

Cruce EMA 9 & 21 + VWAP + EMA50, EMA200 + SMA200
indicator("Cruce EMA 9 & 21 + VWAP + EMA50, EMA200 + SMA200", overlay=true)

Indicador de Trading AvançadoIndicator for trading operations in Forex, cryptocurrencies, stocks and indices of the dollar and the Brazilian stock exchange, such as the mini index (b3) in the M1, M2, M3, M5, M15, M30 and D1 fractals.
This indicator sends signals in the form of a buy and sell arrow to the TradingViev analysis platform. Green for buy and red for sell. Enter the name "BUY" for buy operations and "SELL" for sell operations.
Its function is to be used in situations of breakout, reversal and retraction of structures and for each time fractal, mentioned above.
It should always prioritize the macro and micro trend (Support and Resistance, Prior Cut Adjustment, Automatic Volume Profile among others, aiming for the best possible confluence. The objective is 85% assertiveness.
This indicator uses the combination of trend, momentum, volatility, price logic, price action and SMC indicators.
This indicator aims to provide the command to operate in the direction of the next arrow-shaped candlestick .
Nenhum indicador substituirá o seu conhecimento. Utilize-o como confluência para seu operacional!

Vortex Pivot IndicatorVortex Pivot Points Indicator (VPS)
Buy when most traders give up. Exit when price resets.
What is this indicator about?
This is a swing trading indicator designed to help you enter when most traders are stuck in losses — and exit when price bounces back.
It works by combining weekly Pivot Points with a smart filter using moving averages.
The system waits until all the right conditions are met — and only then, if price touches the S3 support level, it's a buy signal. You then exit when price reaches the Pivot Point from that same setup week.
Psychology Behind the Setup: The whole idea is based on trader positioning and market psychology.
We use two moving averages:
1) The 50-day moving average reflects the mid-term traders average buy price.
2) The 20-day moving average reflects the short-term traders average buy price.
3) When the 50-day is at the top, followed by the 20-day, and the price is below both, it means:
i) Most Mid-term traders are in loss
ii) Most Short-term traders are also in loss
The market is in a deep pessimistic phase
This is the moment when weak hands give up — and smart swing traders can step in.
Our exit happens at the Pivot Point from the same week as the S3 entry — keeping the trade clean and focused on that specific setup.
🛠 How to Use This Indicator
This indicator automatically checks all conditions and shows the S3 and Pivot Point only when everything aligns. That means fewer signals — but higher quality.
⚙️ Must-Use Settings:
Check “Lower time frame for condition” ✅
Lower Time Frame: 1 Day
Pivot Type: Fibonacci
Pivot Time Frame: Weekly
Number of Pivots Back: 200
Color Settings: Customize as per your style
- Use daily candlestick chart
📈 Strategy Logic
Buy when price touches the S3 line and all moving average conditions are met (sometimes indicator might glitch and you will have to check if SMA conditions are being met at the time of buying yourself, happens 1% of the time)
You can average based on your own understanding
Exit when price hits the Pivot Point from the same week as the S3 entry
No stop loss — stay patient as long as it takes (since we use this only on quality stocks)
Sometimes the bounce is quick. Other times it might take a few weeks. Either way, we wait until price resets.
✅ Summary
You’re buying when others are losing.
You’re exiting when the dust settles.

Failed 2U/2D + 50% Retrace Scannerbeta.. Failed 2u and 2d on the 1h and 4h
with tick and add for guidance on overall market
