Liquidity Sweep + BOS Retest System — Prop Firm Edition🟦 Liquidity Sweep + BOS Retest System — Prop Firm Edition
A High-Probability Smart Money Strategy Built for NQ, ES, and Funding Accounts
🚀 Overview
The Liquidity Sweep + BOS Retest System (Prop Firm Edition) is a precision-engineered SMC strategy built specifically for prop firm traders. It mirrors institutional liquidity behavior and combines it with strict account-safe entry rules to help traders pass and maintain funding accounts with consistency.
Unlike typical indicators, this system waits for three confirmations — liquidity sweep, displacement, and a clean retest — before executing any trade. Every component is optimized for low drawdown, high R:R, and prop-firm-approved risk management.
Whether you’re trading Apex, TakeProfitTrader, FFF, or OneUp Trader, this system gives you a powerful mechanical framework that keeps you within rules while identifying the market’s highest-probability reversal zones.
🔥 Key Features
1. Liquidity Sweep Detection (Stop Hunt Logic)
Automatically identifies when price clears a previous swing high/low with a sweep confirmation candle.
✔ Filters noise
✔ Eliminates early entries
✔ Locks onto true liquidity grabs
2. Automatic Break of Structure (BOS) Confirmation
Price must show true displacement by breaking structure opposite the sweep direction.
✔ Confirms momentum shift
✔ Removes fake reversals
✔ Ensures institutional intent
3. Precision Retest Entry Model
The strategy enters only when price retests the BOS level at premium/discount pricing.
✔ Zero chasing
✔ Extremely tight stop loss placement
✔ Prop-firm-friendly controlled risk
4. Built-In Risk & Trade Management
SL set at swept liquidity
TP set by user-defined R:R multiplier
Optional session filter (NY Open by default)
One trade at a time (no pyramiding)
Automatically resets logic after each trade
This prevents overtrading — the #1 cause of evaluation and account breaches.
5. Designed for Prop Firm Futures Trading
This script is optimized for:
Trailing/static drawdown accounts
Micro contract precision
Funding evaluations
Low-risk, high-probability setups
Structured, rule-based execution
It reduces randomness and emotional trading by automating the highest-quality SMC sequence.
🎯 The Trading Model Behind the System
Step 1 — Liquidity Sweep
Price must take out a recent high/low and close back inside structure.
This confirms stop-hunting behavior and marks the beginning of a potential reversal.
Step 2 — BOS (Break of Structure)
Price must break the opposite side swing with a displacement candle. This validates a directional shift.
Step 3 — Retest Entry
The system waits for price to retrace into the BOS level and signal continuation.
This creates optimal R:R entry with minimal drawdown.
📈 Best Markets
NQ (NASDAQ Futures) – Highly recommended
ES, YM, RTY
Gold (XAUUSD)
FX majors
Crypto (with high volatility)
Works best on 1m, 2m, 5m, or 15m depending on your trading style.
🧠 Why Traders Love This System
✔ No signals until all confirmations align
✔ Reduces overtrading and emotional decisions
✔ Follows market structure instead of random indicators
✔ Perfect for maintaining long-term funded accounts
✔ Built around institutional-grade concepts
✔ Makes your trading consistent, calm, and rules-based
⚙️ Recommended Settings
Session: 06:30–08:00 MST (NY Open)
R:R: 1.5R – 3R
Contracts: Start with 1–2 micros
Markets: NQ for best structure & volume
📦 What’s Included
Complete strategy logic
All plots, labels, sweep markers & BOS alerts
BOS retest entry automation
Session filtering
Stop loss & take profit system
Full SMC logic pipeline
🏁 Summary
The Liquidity Sweep + BOS Retest System is a complete, prop-firm-ready, structure-based strategy that automates one of the cleanest and most reliable SMC entry models. It is designed to keep you safe, consistent, and rule-compliant while capturing premium institutional setups.
If you want to trade with confidence, discipline, and prop-firm precision — this system is for you.
Good Luck -BG
Indicators and strategies

Global M2 ex-China MonitorGlobal M2 Monitor - Ultimate Edition
🎯 OVERVIEW
Advanced global M2 money supply monitoring indicator, offering a unique macroeconomic view of global liquidity. Real-time tracking of M2 evolution in major developed economies.
📊 KEY FEATURES
Global M2 Aggregation : USA, Japan, Canada, Eurozone, United Kingdom
Currency Conversion : All data converted to USD for consistent analysis
High Resolution Display : Daily curve by default
Technical Analysis : 50-period moving average (SMA/EMA/WMA)
Accurate YoY Calculation : Annual variation based on monthly data
Advanced Signal System : Multi-condition color codes
🎨 COLOR SYSTEM - DEFAULT SETTINGS
🟢 GREEN : YoY ≥ 7% AND M2 ≥ SMA → Strong growth + Bullish momentum
🔴 RED : YoY ≤ 2% AND M2 ≤ SMA → Weak growth + Bearish momentum
🟢 LIGHT GREEN : YoY ≥ 7% BUT M2 < SMA → Good fundamentals, temporarily weak momentum
🔴 LIGHT RED : YoY ≤ 2% BUT M2 > SMA → Weak fundamentals, price still supported
🔵 BLUE : YoY between 2% and 7% → Neutral zone of moderate growth
🇨🇳 WHY IS CHINA EXCLUDED BY DEFAULT?
Chinese M2 data presents methodological reliability and transparency issues. Exclusion allows for more consistent analysis of mature market economies.
Different M2 definition vs Western standards
Capital controls affecting real convertibility
Frequent monetary manipulations by authorities
✅ Available option : Can be activated in settings
⚙️ OPTIMIZED DEFAULT PARAMETERS
// DISPLAY SETTINGS
Candle Period: D (Daily)
// MOVING AVERAGE
MA Period: 50, Type: SMA
// BACKGROUND LOGIC
YoY Bullish: 7%, YoY Bearish: 2%
SMA Method: absolute, Threshold: 0.2%
// COLORS
Transparency: 5%
China M2: Disabled
📈 RECOMMENDED USAGE
Traders : Anticipate sector rotations
Investors : Identify abundant/restricted liquidity phases
Macro-analysts : Monitor monetary policy impacts
Portfolio managers : Understand inflationary pressures
🔍 ADVANCED INTERPRETATION
M2 ↗️ + YoY ≥ 7% → Favorable risk-on environment
M2 ↘️ + YoY ≤ 2% → Defensive risk-off environment
Divergences → Early warning signals for trend changes
💡 WHY THIS INDICATOR?
Global money supply is the lifeblood of the financial economy . Its growth or contraction typically precedes market movements by 6 to 12 months.
"Don't fight the Fed... nor the world's central banks"
🛠️ ADVANCED CUSTOMIZATION
All parameters are customizable:
YoY bullish/bearish thresholds
SMA comparison method (absolute/percentage)
Colors and transparency
Moving average period and type
Optional China inclusion
📋 TECHNICAL INFORMATION
YoY Calculation : Based on monthly data for consistency
Sources : FRED, ECONOMICS, official data
Updates : Real-time with publications
Currencies : Updated exchange rates

KSL Academy Indicator🔥 KuyTrade Gold Scalping Pro v2 - ครบทุกอาวุธในตัวเดียว! ⚡
📊 Indicator สำหรับเทรด Gold M30 ที่รวมเอา 7 กลยุทธ์เข้าด้วยกัน
✅ EMA Trend Filter
✅ RSI + Stochastic (Momentum)
✅ ATR Volatility Filter
✅ Support/Resistance
✅ Price Action Patterns
✅ RSI Divergence
✅ Session Time Filter (London/NY/Asia)💰 ระบบ TP/SL แบบ Pro:
TP 3 ระดับ
Trailing Stop อัตโนมัติ
คำนวณ Risk:Reward Ratio
แยกตั้งค่า BUY/SELL ได้
🎯 ข้อดี
✔ ครบจบในตัวเดียว - ไม่ต้องใช้ Indicator หลายตัว
✔ สัญญาณชัดเจน - มี Label บอกรายละเอียดเต็ม
✔ กรองคุณภาพสูง - Strict Filter Mode
✔ เหมาะกับ Scalping - TP/SL ระยะสั้น⚠️ ข้อควรระวัง:
💡 เหมาะกับใครบ้าง?
👉 Scalper ที่ชอบเทรด Gold M30
👉 คนที่ชอบสัญญาณครบถ้วน
👉 มือใหม่ที่ต้องการ Indicator All-in-One⚙️ Timeframe แนะนำ: M30 (30 นาที)
💵 สินทรัพย์: XAUUSD (Gold)
🕐 ช่วงเวลา: London + NY Session + Sydney + Tokyo

TRADERL01 MA editable14/21/50/100/200 MA EDITABLE
MOVING AVERAGES
There doesn't seem to be one out there like it.
Editable to change the MAS as you please & toggle ON/OFF
TRADERL01

Market Breadth Decision HelperMarket Breadth Decision Helper (NYSE/NASDAQ VOLD, ADD, TICK)
Combines NYSE VOLD, NASDAQ VOLD (VOLDQ), NYSE/NASDAQ ADD, and TICK into a single intraday dashboard for tactical bias and risk management.
Tiered pressure scale (sign shows direction, abs(tier) shows intensity): 0 = Neutral, 1 = Mild, 2 = Strong, 3 = Severe, 4 = Panic. On-chart legend makes this explicit.
Table view highlights value, tier, bull/bear point contributions, and notes (PANIC, OVERRIDE, DIVERGENCE). VOLD and ADD panic trigger “stand down”; VOLD ±2 triggers bull/bear overrides; NYSE vs NASDAQ ADD divergence triggers “scalp only.”
Bull/bear points: VOLD 2 pts, ADD NYSE 2 pts, ADD NASDAQ 1 pt, TICK 1 pt. ≥3 pts on a side lifts that side’s multiplier to 1.5. Bias flips Bullish/Bearish only if a side leads and has ≥2 pts; otherwise Neutral.
Breadth modes: PANIC_NO_TRADE → DIVERGENCE_SCALP_ONLY → VOLD_OVERRIDE_BULL/BEAR → NORMAL/NO_EDGE.
Intraday context: tracks current session day_high / day_low for the chart symbol.
JSON/Alert export (optional) sends raw values plus *_tier and *_tier_desc labels (NEUTRAL/MILD/STRONG/SEVERE/PANIC) with sign/magnitude hints, so agents/bots never have to guess what “1 vs 2 vs 3 vs 4” mean.
Customizable bands for VOLD/ADD/TICK, table styling, label placement, and dashboard bias input to align with higher-timeframe context.
Best use
Quick read on internal participation and pressure magnitude.
Guardrails: respect PANIC and overrides; treat divergence as “scalp only.”
Pair with your strategy entries; let breadth govern when to press, scale back, or stand down.
Symbols (defaults)
VOLD (NYSE volume diff), VOLDQ (NASDAQ volume diff), ADD (NYSE), ADDQ (NASDAQ), TICK (NYSE). Adjust in Inputs as needed.
Alerts
Panic, divergence, strong bullish/bearish breadth. Enable JSON export to feed algo/agent workflows.

H1 Z-score + DevVWAP (swing filters)H1 Z-Score + DevVWAP (Swing Filters) — TradingView Indicator
Purpose
A lightweight filter to confirm or fade swing setups (1–5 days) using intermarket context. It measures how unusual the last 1-hour move is (Z-score) and how far price is from session VWAP (DevVWAP). Designed for risk-off proxies (DXY, ZN, VIX/VX) but works on any symbol.
What it shows
H1 Z-Score line
𝑍
=
1h return
𝜎
1h, rolling
Z=
σ
1h, rolling
1h return
using H1 data pulled via request.security.
Guide levels: ±1 (strong), ±1.5 (very strong), ±2 (extreme).
DevVWAP line (optional)
DevVWAP
=
Close
−
VWAP
VWAP
DevVWAP=
VWAP
Close−VWAP
from the current session.
Text panel / status (optional)
Human-readable hint: “PRO long equity”, “CONTRO long equity”, or “Mixed”, depending on Z and the asset’s role.
Inputs
Sessions lookback (default 20): how many sessions to estimate the 1h volatility baseline.
Hours per session (default 23): adjust for Globex vs cash hours.
Show DevVWAP (on/off).
Asset role = Risk-OFF? (true for DXY/ZN/VIX; false for equity indices/ETFs or risk-on FX/crypto).
How to read it (equity swing context)
For Risk-OFF assets (DXY, ZN, VIX/VX):
Z ≤ −1 (down move stronger than usual) and/or DevVWAP < 0 → PRO long equity (risk-on confirmation).
Z ≥ +1 and/or DevVWAP > 0 → CONTRO long equity (risk-off pressure).
For Risk-ON assets (set “Risk-OFF?” = false), invert the logic.
Typical use with a swing setup (Break & Retest):
If your setup is valid, add +10–15% confidence when ≥2 filters align (e.g., DXY Z ≤ −1 and below VWAP).
If signals are mixed, halve size (Reduce).
If ≥2 filters oppose, skip new entries (OFF).
Why it helps
Standardizes “strong vs normal”: Z-score compares the current 1h impulse to its own 20-session history.
Anchors to fair value: DevVWAP tells you if the filter asset is trading above/below its session value.
Portable: same logic across ES/FDAX/NQ/FESX (just apply the indicator to the filter symbols).
Practical tips
Symbols: prefer futures or liquid proxies (DX or 6E for DXY, ZN for UST 10y, VX for VIX future) so VWAP is meaningful.
Timeframe setting: the script fetches H1 internally; you can run it on any chart TF.
Labels vs timeframe: If you enable on-chart labels, do not pass a timeframe argument in indicator() (Pine forbids side effects with fixed TF).
Smoothing: keep 20 sessions; shorten only if regime shifts make the baseline stale.
Don’t trade it alone: it’s a filter for your swing setup (bias from D1/H4, trigger on H1/M15).
Typical workflow (1 minute)
Open a chart of the filter asset (e.g., DXY future).
Check Z relative to ±1/±1.5 and DevVWAP sign.
Repeat for ZN and VIX/VX.
If ≥2 agree with your trade direction → ON / size full; if mixed → Reduce; if opposed → OFF.
Limitations
Z-score assumes the recent 1h return distribution is a useful baseline; during extreme news this can break.
DevVWAP is session-dependent; ensure your session settings match the instrument’s trading hours.
No entry/exit rules by itself; it’s a context tool to modulate probability and size.

NASDAQ 5MIN — 8×13 EMA + VWAP Pro Setup (2025)NASDAQ 5MIN — 8×13 EMA + VWAP Pro Setup (2025 Funded Trader Edition)
by ASALEH2297
The exact same 5-minute Nasdaq scalping system that multiple 6- and 7-figure funded accounts are running live in 2025 – now public.
100 % mechanical, zero repaint, zero guesswork.
Core Rules (executed instantly when the arrow prints):
• 8 EMA crosses 13 EMA
• Must be on the correct side of daily VWAP AND sloping 34 EMA
• Price closed beyond the 34 EMA
• High-confidence filter = price well away from VWAP + fast 8 EMA trending + volume spike → massive bright “3↑ / 3↓” arrow (load full size)
• Normal confidence = small arrow (normal or half size)
Key Features:
• Automatic dynamic swing stops plotted in real-time (6-point buffer beyond prior 10-bar extreme – the exact 2025 NQ stop method)
• Clean, impossible-to-miss arrows (huge bright for Conf 3, small for regular)
• Built-in alert conditions so “LONG (Conf 3)” and “SHORT (Conf 3)” appear instantly in mobile/desktop alerts
• Works perfectly on NQ1! (full) and MNQ1! (micro) 5-minute charts
• Best sessions: 09:30–11:30 ET and 14:00–16:00 ET
How to trade it:
1. Big 3-arrow appears on closed bar → market order in
2. Stop = red dashed line (already drawn)
3. Scale out 50 % at +40 pts NQ / +20 pts MNQ, move rest to breakeven, trail with 13 EMA
Pine Script v6 – zero errors, zero warnings.
Used daily on live funded desks. Add it, set the two Conf-3 alerts, and let the phone scream only when the real money prints.
“When the 3↑ hits… the bag follows.”
— ASALEH2297

Buyers in Control █ OVERVIEW
The "Buyers in Control" indicator identifies periods when buying pressure dominates the market by combining three key technical factors:
✓ Price Momentum - Price trading above exponential moving average
✓ Volume Confirmation - Current volume exceeding average (strong participation)
✓ RSI Strength - Momentum indicator confirming bullish bias
When all three conditions align, the indicator signals that buyers are in control of the market.
█ HOW IT WORKS
The indicator evaluates three independent conditions:
1. PRICE POSITION: Close > EMA(21)
→ Confirms price is in an uptrend
2. VOLUME SURGE: Volume > SMA(20) × 1.2
→ Validates that the move has genuine buying interest
3. MOMENTUM: RSI(14) > 50
→ Ensures bullish momentum is present
Only when ALL three conditions are true does the indicator confirm buyer control.
█ KEY FEATURES
• Real-time Dashboard - Shows status of each condition (✓/✗)
• Visual Alerts - Green background + labels when buyers take control
• EMA Reference Line - Visual trend indicator
• Customizable Parameters - Adjust sensitivity for any market/timeframe
• Built-in Alerts - Notification when control shifts to buyers
• Clean Code - Well-documented Pine Script v6
█ SETTINGS
Price Momentum:
- EMA Length (default: 21) - Shorter = faster signals, Longer = more conservative
Volume Confirmation:
- Volume Multiple (default: 1.2) - Higher = requires stronger volume
- Volume SMA Length (default: 20) - Lookback period for average volume
RSI Momentum:
- RSI Length (default: 14) - Standard RSI calculation period
- RSI Threshold (default: 50) - Minimum RSI for buyer control
Display:
- Toggle background, labels, EMA line, and customize colors
█ USE CASES
• Trend Confirmation - Validate bullish moves before entering long positions
• Filter Weak Rallies - Avoid low-volume pumps that often reverse
• Multi-Timeframe Analysis - Check buyer control across multiple charts
• Alert System - Get notified when market regime shifts to buyers
█ BEST PRACTICES
✓ Works best in trending markets (avoid choppy/ranging conditions)
✓ Combine with support/resistance for optimal entries
✓ Test different EMA lengths for your specific asset/timeframe
✓ Use alongside risk management rules (stop losses, position sizing)
✓ Consider the dashboard to see which conditions are missing
█ TIMEFRAMES
Suitable for all timeframes:
• Intraday: 1m-15m (use EMA 9 for faster signals)
• Swing: 1h-4h (default settings work well)
• Position: Daily-Weekly (use EMA 50 for conservative signals)
█ TECHNICAL NOTES
• Pine Script v6 - Latest version for optimal performance
• No repainting - All calculations based on closed bar data
• Lightweight - Minimal CPU usage
• Open Source - Full code available for review and modification
█ ALERT CONDITIONS
1. "Buyers Take Control" - Fires when all three conditions become true
2. "Buyers Lose Control" - Fires when any condition breaks
█ LIMITATIONS
⚠ Not a standalone trading system - use as a confluence tool
⚠ May generate false signals in sideways/choppy markets
⚠ Volume data unavailable on some forex pairs (use tick volume)
⚠ Lagging by nature - confirmatory indicator, not predictive
█ CREDITS
Indicator combines classic technical analysis principles:
• EMA for trend direction
• Volume analysis for validation
• RSI for momentum confirmation
No proprietary algorithms - transparent, time-tested methods.

Daily Candle by NatantiaIntroduction to the Daily Candle Indicator
The Daily Candle Indicator is a powerful and customizable tool designed for traders to visualize daily price action on any chart timeframe.
This Pine Script (version 5) indicator, built for platforms like TradingView, overlays a single candle representing the day's open, high, low, and close prices, with options to adjust its appearance and session focus.
Key Features:
Customizable Appearance: Users can set the colors for bullish (default green) and bearish (default white) candles, as well as the wick color (default white). The horizontal offset and candle thickness can also be adjusted to fit the chart layout.
Dynamic Updates: The candle updates on the last bar, with wicks drawn to reflect the daily high and low, providing a clear snapshot of the day's price movement.
This is the same version as before, but we had to republish it because the chart contained other indicators, which violated the publication rules. We apologize for the inconvenience.
Have a nice trades!
-Natantia

[ArchLabs] Support & Resitance Levels Support & Resistance Levels — SR-v1.100
Smart, auto-managed zones for clean market structure
⸻
🔍 What this indicator does
This script automatically finds and maintains high-quality support & resistance zones on your chart, so you don’t have to keep redrawing levels by hand.
It:
• Detects major swing highs and lows (pivots)
• Builds support and resistance zones (not just thin lines)
• Filters out overlapping / redundant levels
• Tracks how price interacts with those zones in real time
• Marks and alerts:
• ✅ Breakouts
• 🚨 False breakouts
• 🔁 Retests
• Flips broken support → resistance and resistance → support automatically
You get a clean structural map of the market, continuously updated.
⸻
🧠 How levels are built (conceptually)
1. The indicator looks back over a configurable window and finds significant highs and lows (pivots).
2. From each confirmed pivot, it creates:
• A core level price (horizontal line)
• A price area around it (shaded zone), sized relative to recent price range/volatility
3. It then checks for overlaps between existing levels and new candidates:
• If a new level is too close to an existing one (within your overlap threshold), it gets discarded.
• This keeps only the most meaningful, non-redundant levels on the chart.
4. A cap of around 10 levels per side (support / resistance) keeps the view readable.
The result: a curated set of zones that actually matter, not a wall of lines.
⸻
🎨 Visuals on the chart
You’ll see:
• Support zones
• Line: bullish color (default green)
• Area: semi-transparent band below/around the line
• Resistance zones
• Line: bearish color (default red)
• Area: semi-transparent band above/around the line
Colors are customizable for:
• Level line
• Zone area
• Breakout highlight
• Retest label
This makes it easy to visually separate support vs resistance and quickly spot key reactions.
⸻
⚡ Dynamic behavior & level lifecycle
Each level goes through a natural “life cycle,” which the indicator tracks for you:
1. Active zone
• The level is valid and extended to the right as long as price stays “engaged” with it (using smoothed highs/lows to avoid noise).
2. Extension / pause
• When price pulls away from the level far enough, the extension can temporarily stop so the level doesn’t stretch indefinitely without interaction.
• If price comes back into the zone with meaningful action, the level can resume extension.
3. Break & role reversal
• When price cleanly breaks the level (based on smoothed price, not just a wick), the zone is:
• Stopped and locked in place
• Marked as broken
• Immediately cloned and flipped:
• Broken support becomes a new resistance zone at the same area.
• Broken resistance becomes a new support zone.
This gives you automatic role-reversal levels without manually redrawing anything.
⸻
🧷 Event tags & alerts
The indicator tracks three key interactions with each zone:
1. Breakouts (optional)
When price decisively breaks a level:
• A small breakout label appears on/near the level:
• Support broken → bearish breakout style
• Resistance broken → bullish breakout style
• An alert message is fired (if alerts are enabled on the script)
Use this to catch true structural breaks that may signal trend continuation or regime change.
⸻
2. False breakouts (optional)
False breakouts are marked when price:
• Wicks through a level, but
• Fails to close beyond it and quickly returns inside the zone
When detected:
• A 🚨 FB label appears at the level
• The label tracks with price while the false breakout is active
• An alert can fire each time this behavior is confirmed
This is very useful for reversal traders and anyone fading failed breakouts.
⸻
3. Retests (optional)
Retests are detected when:
• Price re-enters a zone after previously moving away from it
• The candle comes back into the area for the first time in this new approach
The script:
• Marks the retest with a “T” label in a distinct color for support vs resistance
• Brings that level to the top of the internal priority list, keeping fresh retests visually and logically “hot”
Traders often use these as high-probability reaction points (e.g., breakout → retest → continuation).
⸻
⚙️ Key settings
All inputs are grouped for clarity:
Support / Resistance Levels
• Pivots Lookback
Controls how far back the indicator looks for swing highs/lows.
• Higher value → fewer, stronger levels
• Lower value → more reactive, more levels
• Overlap Multiplier (Pips)
Sets how aggressively overlapping levels are merged/ignored.
• Higher value → fewer levels, more consolidation
• Lower value → more granular levels
• Auto Overlap
When enabled, the script automatically adjusts the overlap threshold based on timeframe:
• Intraday lower timeframes → tighter filtering
• Higher/intra-session → more appropriate scaling
This lets you drop the indicator on multiple timeframes without constantly retuning.
⸻
Level Event Toggles
• Breakout Labels & Alerts (on/off)
• False Breakout Labels & Alerts (on/off)
• Retest Labels & Alerts (on/off)
Turn on only what fits your style.
Scalpers might want all three; swing traders may prefer only breakouts + retests.
⸻
Support / Resistance Colors
Separate color groups for:
• Line & area of support levels
• Line & area of resistance levels
• Visual styling for breakouts
• Visual styling for retests
You can match your existing chart theme or build a dedicated SR layout.
⸻
📈 How to use it in your trading
Here are a few practical ways to integrate this indicator:
• Context map
Use it as a structural overlay on any symbol/timeframe to see where price is likely to react.
• Breakout + retest setups
• Wait for a level to break with a breakout label.
• Then watch for a T (retest) label into the flipped zone.
• Combine with your own confirmation (price action, volume, oscillators, etc.).
• Mean-reversion & fade trades
• Hunt for false breakout (FB) labels on key levels.
• These are often good spots to fade aggressive moves that lose momentum.
• Confluence builder
• Combine zones with trend tools, VR/DC, moving averages, or higher timeframe structure.
• A breakout/retest at a level that also lines up with higher TF structure can be especially meaningful.
⸻
✅ Summary
Support & Resistance Levels (SR-v1.100) is designed to be:
• Clean – no cluttered spaghetti of lines
• Adaptive – zones evolve with the market and flip roles automatically
• Actionable – breakout, false breakout, and retest events are clearly marked and alert-ready
• Flexible – works on any market and timeframe with simple, intuitive inputs
Drop it on your chart, tune the lookback & overlap to your style, and let it handle the heavy lifting of structural mapping while you focus on decisions.

Indicator for Confirming AccumulationStrong Buying Pressure Confirmation Indicator
This indicator helps identify stocks showing strong buying pressure, highlighting moments when significant money is flowing into a symbol. By analyzing active buying volume, price strength, momentum, and institutional-style accumulation, it automatically marks stocks with powerful upward behavior.
It is useful for spotting early accumulation, potential breakouts, and high-probability bullish setups.

MoneyM Line StrategyPrimary Test: 2020-Present (most relevant for future)
Secondary Test: 2021-Present (includes full cycle)
Validation Test: 2017-Present (longer history)
Target Annual Return: 100-200% (2-4x BTC's 50-100%)
Target Max DD: 25-35% (50% less than BTC's typical 60-70%)
Target Trades: 20-40 per year on weekly (sustainable monitoring)
Kim Lisa – Accurate PDH/PDL + PWH/PWL + Weekend Gap (EST)This indicator provides highly accurate market structure reference levels using official New York (EST) session data. It is designed for traders who rely on precise daily and weekly highs/lows as well as the weekly opening gap between Friday’s close and Monday’s open.
✔ Accurate Daily & Weekly Levels (EST)
The indicator fetches all levels directly from the D and W timeframes using request.security().
This ensures the levels are always correct, regardless of:
your broker
your chart’s timezone
your instrument
or your platform settings
You will always see the true official market structure:
PDH – Previous Day High
PDL – Previous Day Low
PWH – Previous Week High
PWL – Previous Week Low
These levels are essential for liquidity targeting, reversals, sweeps, and intraday trading.
✔ Clean Visual Lines + Labels
Each level is displayed as a clean, thin line on the chart with a small label for quick identification:
PDH (red)
PDL (green)
PWH (purple)
PWL (light purple)
The labels automatically update and move with the chart.
✔ New Week Opening Gap (Friday Close → Monday Open)
The indicator also identifies and highlights the Weekend Opening Gap, which forms between:
Friday’s official NY close (17:00 EST)
Monday’s official NY open
If a gap exists, the indicator draws a shaded box across the chart and labels it:
“NEW WEEK OPENING GAP”
This makes it easy to spot imbalances that often act as magnets for price during the new trading week.
✔ Works on ALL Timeframes
Intraday (1m–15m), swing trading, and even higher timeframes.
The levels always come from the correct higher timeframe data.
⭐ Ideal For:
Smart Money Concepts (SMC)
ICT trading
Liquidity strategies
Reversal traders
Scalpers
Gap traders
Market structure analysis
Opening week setups
💡 Why This Indicator Is Better
Most PDH/PDL indicators recalc levels from the local chart timezone, which leads to incorrect values.
This one pulls official NY session data, giving you:
✔ Consistency
✔ Accuracy
✔ Institutional-grade levels
✔ Perfect alignment with professional trading models

Swing Point PnL PressureThis indicator visualizes the cumulative profit potential of bulls and bears based on recent swing highs and lows — offering a unique lens into trend maturity, sentiment imbalance, and exhaustion risk.
🟢 Bull PnL rises as price moves above prior swing lows — reflecting unrealized gains for long positions
🔴 Bear PnL rises as price drops below prior swing highs — capturing short-side profitability
Over time, these curves diverge during strong trends, revealing which side is in control. But when they converge, it often signals that the dominant side is losing steam — a potential turning point where profit-taking, traps, or reversals may emerge.
This tool doesn’t predict tops or bottoms — it tracks the emotional and financial pressure building on each side of the market. Use it to:
Spot trend exhaustion before price confirms it
Identify profit parity zones where sentiment may flip
Time accumulation or distribution phases with greater confidence
Whether you’re swing trading or analyzing macro structure, this indicator helps you see what price alone can’t: who’s winning, who’s trapped, and who’s about to give up.

Rasta Long/Short — StrategyThe Rasta Long/Short Strategy is a visual and educational framework designed to help traders study momentum shifts that appear when a fast EMA interacts with a slower smoothed baseline.
It is not a signal service. Instead, it is a research tool that helps you observe transitions, structure, and behavior across different market conditions and smoothing contexts.
The script plots:
A primary EMA line (fast reaction wave).
A Smoothed line (your chosen smoothing method).
Color-coded fog regions showing directional bias.
Optional DNA rung connections between the two lines for structural comparison.
Together, these allow a deeper study of how momentum pushes, volatility compression, expansions, and drift emerge around fast/slow EMA interactions.
✦ Core Idea
The Rasta Long/Short mechanism studies how price behaves when the fast EMA crosses above or below a smoothed anchor.
Rather than predicting price, it reveals where transitions occur across different structures, timeframes, and smoothing techniques.
The Long/Short logic simply highlights flips in directional structure.
It is not intended for real-time signals or automated execution; it is intended for understanding market movement.
✦ Smoothing Types (Explained)
The strategy allows experimenting with several smoothing families to observe how they transform the fast EMA:
SMA (Simple Moving Average)
Averaged, slower response. Good for stability comparisons.
EMA (Exponential)
Faster reaction, more responsive, smoother behavior during momentum.
RMA (Wilder’s)
Used in RSI calculations; steady, well-balanced response.
WMA (Weighted)
More weight to recent bars; bridges SMA and EMA dynamics.
None
Raw EMA vs EMA interaction with no secondary smoothing.
Each smoothing type provides unique structural information and can lead to different interpretations.
✦ Modes of Study
Designed for multi-timeframe research:
1H / 4H — Momentum flow mapping and structural identification.
Daily / Weekly — Higher-timeframe rotations, macro structure transitions.
1–15m — Microstructure studies, noise vs trend emergence.
Use the built-in Strategy Tester to explore entry/exit context, but treat results as research, not predictive performance.
✦ Components (Visual Study Tools)
EMA Line (Fast)
Primary reactive wave. Shows fast directional shifts.
Smoothed Line (Slow)
Trend baseline / reference structure.
Fog Region
Highlights fast-vs-smoothed directional alignment.
DNA Rungs (Optional)
Structural “bridges” showing the exact relationship between waves on each bar.
Useful for studying separation, compression, and expansions.
✦ Educational Insights
This strategy helps illuminate:
How fast and slow EMAs interact dynamically.
How structure changes precede trend emergence.
Where volatility compresses before expansion.
How noise, drift, and clean reversals differ.
How different smoothers alter the interpretation of the same price data.
The goal is clarity — not prediction.
✦ How to Use
Apply to any timeframe or instrument.
Enable or disable fog depending on preferred visibility.
Use DNA rungs for close structural comparison.
Observe long/short flips as educational reference points — not signals.
Study transitions visually, then backtest using the Strategy Tester for pattern research.
✦ Disclaimer
This script is provided for educational and research purposes only.
It does not provide trading signals, financial advice, or recommendations.
Past behavior does not indicate future performance.
Always practice risk-aware study and consult qualified financial professionals when needed.
✦ Author
Michael Culpepper (mikeyc747)
Creator of the Rasta framework and related market structure studies.

ATRP & Volatility Table - AIMAN93The ATRP & Volatility Table is a simple yet powerful tool designed to quantify market volatility and help traders adapt their position sizing accordingly.
It calculates the Average True Range Percentage (ATRP) — the ATR value relative to current price — and classifies market conditions into three volatility levels: LOW, MEDIUM, or HIGH. Based on the volatility level, it suggests an indicative risk percentage to guide your trade management.
This visual tool displays real-time ATRP, volatility classification, and corresponding risk percentage in a compact on-chart table. Ideal for systematic traders who rely on volatility-based decision-making, position sizing, or risk management models.
Features:
- Dynamic ATRP calculation for any symbol or timeframe
- Customizable colors for text and background
- Automatic volatility classification (low / medium / high)
- Suggested risk percentage for each volatility level

Session Volume Profile - Open Source (DeadCat) Decided to make this Open Source so everyone can make edits.
Volume Profile is a charting study that displays trading activity over specific time periods at various price levels. It appears as a horizontal histogram on the chart, revealing where traders have shown the most interest based on volume concentration.
This Volume Profile automatically anchors to user-selected timeframes, creating fresh volume analysis for each new period while maintaining clean, systematic visualization of price-volume relationships.
Core Components:
Point of Control (POC): The price level with the highest volume activity during the selected period, marked with a yellow line and left-side label.
Value Area High/Low (VAH/VAL): Price boundaries that contain a specified percentage of the total volume (default 40%), helping identify the main trading range where most activity occurred.
Volume Histogram: Left-aligned bars showing volume distribution across price levels, with value area highlighting for enhanced visual clarity.
Key Features:
- Automatic Period Detection: Supports hourly, daily, weekly, and monthly timeframe anchoring
- Customizable Granularity: Adjustable rows (10-500) for different price resolution needs
- Labels: Clear POC, VAH, and VAL identification positioned at profile start
- Toggle Controls**: Optional display for volume rows, key levels, and background fills
- Clean Visualization: Profiles reset automatically at each new period for current market focus
Display Options:
- Profile Rows: Show/hide the volume histogram bars
- Key Level Lines: Individual controls for POC, VAH, and VAL display
- Value Area Background: Optional shading between VAH and VAL levels
- Color Customization: Separate color controls for all visual elements
The indicator provides systematic volume analysis by creating fresh profiles at regular intervals, helping traders identify significant price levels and volume patterns within their preferred timeframe structure.
Disclaimer: This indicator is for educational and informational purposes only. Trading decisions should be based on comprehensive analysis and proper risk management. Past performance does not guarantee future results.

Etherium CME gaps multi-timeframe auto finderThis indicator is a powerful tool that automatically detects and visualizes price gaps (Gaps) in the Ethereum CME futures market across multiple timeframes and also provides alert functionality. Price gaps occur when the futures market is inactive for a certain period, often acting as potential support or resistance zones.
What is an Ethereum CME Gap?
CME (Chicago Mercantile Exchange) is one of the largest derivatives exchanges globally. The Ethereum CME futures market is closed on weekends and certain holidays. When the market reopens, a price difference may occur between the previous closing price and the new opening price, referred to as a "CME Gap."
Key Features of the Indicator
Multi-timeframe gap detection: Detects and displays gaps across 5m, 15m, 30m, 1h, 4h, 1d timeframes simultaneously.
Customizable CME Symbol: You can specify Ethereum CME futures symbols, such as ETH1!.
Two gap price display methods:
CME_price: Displays the gap based on the actual price levels in the CME futures market.
Chart_price: Adjusts the gap to match the price levels on the chart being viewed (e.g., spot market). This helps visualize the impact of futures gaps on the spot market.
Visual customization:
Individual color settings for bullish/bearish gap boxes for each timeframe.
Adjust the extension (display length) of gap boxes in bars.
Configure label display, position, text size, background, and text color.
Highlight significant gaps: Emphasize gaps above a specified percentage with a unique color and border thickness.
Alert functionality: Receive notifications when a gap is detected, with options to enable alerts only for specific timeframes.
Why CME Gaps Matter
Traders often consider CME gaps as significant price zones.
Gap Fill: Historical data shows that many gaps tend to get "filled" over time, meaning the price returns to the gap area, reaching the start or end point of the gap.
Support/Resistance: Unfilled gaps can serve as potential support (Bullish Gap) or resistance (Bearish Gap) zones.
Bullish Gap: Occurs when the current opening price is higher than the previous closing price. Typically leaves an unfilled gap below (previous high), which can act as potential support.
Bearish Gap: Occurs when the current opening price is lower than the previous closing price. Typically leaves an unfilled gap above (previous low), which can act as potential resistance.
How to Use the Indicator
Add Indicator on TradingView: Click the "Indicators" button on the TradingView chart.
Find the indicator in "My Scripts" or "Invite-Only Scripts" and add it to the chart.
Adjust Settings: Once the indicator is added, click the settings (gear) icon to adjust inputs.
CME Symbol (ETH): ETH1! is typically the default symbol for Ethereum CME futures. Confirm based on your broker or data feed.
Min gap %: Set the minimum gap size in percentage; smaller gaps will not be displayed.
Select Exchanges to Display gap price: Choose between "CME_price" or "Chart_price." For viewing futures gaps on a spot chart, "Chart_price" is recommended.
Show Xm/h/d gap boxes: Select which timeframe gap boxes to display.
Color, Extension, Label settings: Customize the visual aspects of gap boxes and labels.
Highlight gap % (>=): Set the minimum percentage for highlighting significant gaps.
Enable Alerts: Choose whether to receive alerts when a gap is detected.
Alert Timeframe: Select whether alerts apply to all timeframes or specific ones only.
Chart Analysis
Once the indicator is applied, gap boxes for the selected timeframes appear on the chart.
Green shades indicate Bullish Gaps, and red shades indicate Bearish Gaps (default green can be customized, and bearish gap color can be set separately).
Highlighted gaps may carry higher significance and should be monitored carefully.
Potential trading opportunities can be explored when the price approaches or attempts to fill a gap.
Usage Strategies (Examples)
Support/Resistance Confirmation: The lower boundary of a bullish gap can act as potential support, while the upper boundary of a bearish gap can act as potential resistance. Observe for reversals or breakouts when price reaches these areas.
Retracement Trading: Trade when the price returns to fill a gap after leaving it through a sharp move up or down.
Multi-timeframe Analysis: Gaps overlapping across multiple timeframes can form stronger support/resistance zones.
Considerations
* "Gap Filled" Condition: The indicator does not draw a gap if it determines that the gap has already been filled by the current bar’s low (bullish gap) or high (bearish gap).
* Tool Only: This indicator is a gap detection tool and should not be used alone for trading decisions. Always combine with other technical analysis tools and your trading strategy.
* Past Data ≠ Future Guarantee: Historical gap fill trends do not guarantee future occurrences.
This indicator allows effective tracking of Ethereum CME futures gaps and provides valuable insights for enhancing your trading strategy.

Elder Force Index Alexander Elder's volume indicator. Stay in long as long as the background is green and there are no green crosses. The same applies for short.

VWAP TrendSignalVWAP TrendSignal
VWAP (Volume-Weighted Average Price) is the market’s true fair value — the benchmark institutions use to see when price is balanced, extended, or trending with real intent.
Price often snaps back when it moves too far (mean reversion), and only shows genuine strength when it holds above or below VWAP.
VWAP TrendSignal makes this insight effortless by color-coding VWAP direction:
Yellow = VWAP rising → bullish pressure
Red = VWAP falling → bearish pressure
No bands. No noise. Just pure directional clarity.
Anchor VWAP to the Session, Week, Month, Quarter, or Year, and tailor the Slope Smoothing Filter to your timeframe:
1–2 smoothing → fast & reactive (1–5m scalping)
3–5 smoothing → clean & stable (5–15m intraday)
6–10 smoothing → slow flips (1H–4H swings)
10–15 smoothing → macro bias only (Daily/Weekly)
The line adapts to how you trade.
How to Use It
Mean Reversion
When price stretches far from VWAP, expect pullbacks or snapbacks.
Trend Direction
Yellow supports long bias, red supports short bias.
Simple, reliable, instantly visible.
Balance Zones
Price sitting near VWAP = compression, buildup, or chop.
A perfect signal to wait or prepare for a breakout.
Why It Works
VWAP TrendSignal distills institutional logic into a clean, single-line tool.
It shows fair value, trend slope, and balance all at once — making your chart clearer and your decisions faster.
Once you get used to reading it, trading without it feels blind.

Candle 2 Closure📌 Indicator Presentation – Candle 2 Closure
" Candle 2 Closure "s is an indicator designed to identify three types of price–action-based signals in real time: Long, Short, and Generic.
The goal is to visually highlight moments when the market breaks a key level of the previous candle but rejects that break, closing on the opposite side.
The idea was inspired by the study of pure price action and specifically by the following video:
👉 www.youtube.com
🎯 How the Indicator Works
The indicator generates signals on bar close (barstate.isconfirmed), making them reliable and free from repainting.
🔵 LONG Signal
A long signal is triggered when:
The current candle breaks the low of the previous candle
But then closes back above that low
→ This is often a sign of a bear trap or a liquidity rejection to the downside.
🔴 SHORT Signal
A short signal is triggered when:
The current candle breaks the high of the previous candle
But then closes back below that high
→ This may indicate a bull trap or a liquidity rejection to the upside.
⚪ GENERIC Signal
A generic signal is triggered when:
A high or low is broken,
But neither the long nor short conditions are met,
Resulting in a simple unconfirmed break.
📍 Operational Advantages
Highlights liquidity absorption zones
Works on all timeframes (1m → 1D)
Useful for scalping, intraday, or swing trading
Clear and immediate visual signals on the chart
Zero repainting
✨ Visual Style
LONG displayed below the candle, white color
SHORT displayed above the candle, white color
Generic signal shown with a neutral label

🔰BGL Algo Break out and Trend Indicator publicdesigned for public use no charges identifying chart trends

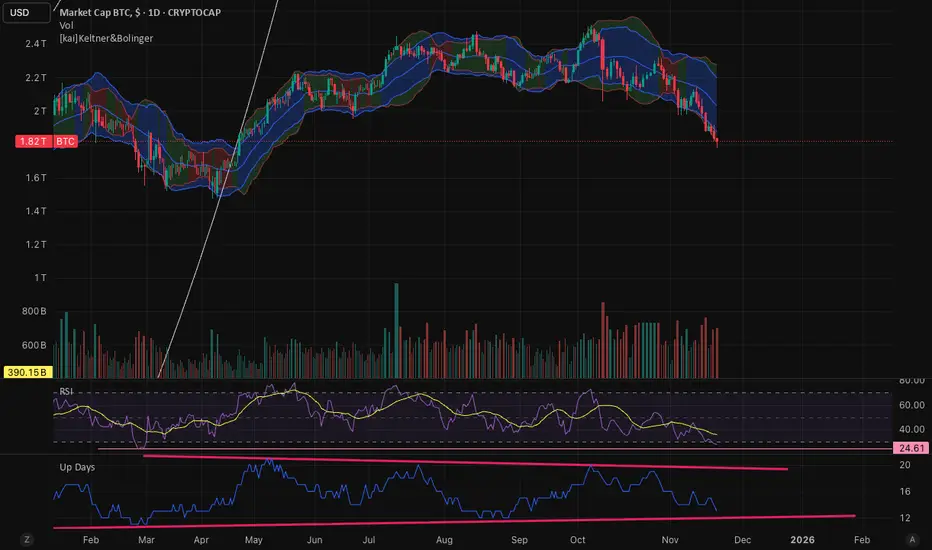
Up DaysMeasures Number of UP days over a lookback period (default 30 trading days). A Simple yet powerful script to show potential trend exhaustions and turning points.