Indicators and strategies

VWAP + EMA20 + EMA200 + RSI + SR + Panel vwap ema 20 + ema 200 con senales de entrada y soportes dinamicos ideal 1 hora

CoffeeShopCrypto Supertrend Liquidity EngineMost SuperTrend indicators use fixed ATR multipliers that ignore context—forcing traders to constantly tweak settings that rarely adapt well across timeframes or assets.
This Supertrend is a nodd to and a more completion of the work
done by Olivier Seban ( @olivierseban )
This version replaces guesswork with an adaptive factor based on prior session volatility, dynamically adjusting stops to match current conditions. It also introduces liquidity-aware zones, real-time strength histograms, and a visual control panel—making your stoploss smarter, more responsive, and aligned with how the market actually moves.
📏 The Multiplier Problem & Adaptive Factor Solution
Traditional SuperTrend indicators rely on fixed ATR multipliers—often arbitrary numbers like 1.5, 2, or 3. The issue? No logical basis ties these values to actual market conditions. What works on a 5-minute Nasdaq chart fails on a daily EUR/USD chart. Traders spend hours tweaking multipliers per asset, timeframe, or volatility phase—and still end up with stoplosses that are either too tight or too loose. Worse, the market doesn’t care about your setting—it behaves according to underlying volatility, not your parameter.
This version fixes that by automating the multiplier selection entirely. It uses a 4-zone model based on the current ATR relative to the previous session’s ATR, dynamically adjusting the SuperTrend factor to match current volatility. It eliminates guesswork, adapts to the asset and timeframe, and ensures you’re always using a context-aware stoploss—one that evolves with the market instead of fighting it.
ATR EXAMPLE
Let’s say prior session ATR = 2.00
Now suppose current ATR = 0.32
This places us in Zone 1 (Very Low Volatility)
It doesn’t imply "overbought" or "oversold" — it tells you the market is moving very little, which often means:
Lower risk | Smaller stops | Smaller opportunities (and losses)
🔁 Liquidity Zones vs. Arbitrary Pullbacks
The standard SuperTrend stop loss line often looks like price “barely misses it” before continuing its trend. Traders call this "stop hunting," but what’s really happening is liquidity collection—price pulls back into a zone rich in orders before continuing. The problem? The old SuperTrend doesn’t show this zone. It only draws the outer limit, leaving no visual cue for where entries or continuation moves might realistically originate.
This script introduces 2 levels in the Liquidity Zone. One for Support and one for Stophunts, which draw dynamically between the current price and the SuperTrend line. These levels reflect where the market is most likely to revisit before resuming the trend. By visualizing the area just above the Supertrend stop loss, you can anticipate pullbacks, spot ideal re-entries, and avoid premature exits. This bridges the gap between mechanical stoploss logic and real-world liquidity behavior.
⏳ Prior Session ATR vs. Live ATR
Using real-time ATR to determine movement potential is like driving by looking in your rearview mirror. It’s reactive, not predictive. Traders often base decisions on live ATR, unaware that today’s range is still unfolding —creating volatility mismatches between what’s calculated and what actually matters. Since ATR reflects range, calculating it mid-session gives an incomplete and misleading picture of true volatility.
Instead, this system uses the ATR from the previous session , anchoring your volatility assumptions in a fully-formed price structure . It tells you how far price moved in the last full market phase—be it London, New York, or Tokyo—giving you a more reliable gauge of expected range today. This is a smarter way to estimate how far price could move rather than how far it has moved.
The Smoothing function will take the ATR, Support, Resistance, Stophunt Levels, and the Moving Avearage and smooth them by the calculation you choose.
It will also plot a moving average on your chart against closing prices by the smoothing function you choose.
🧭 Scalping vs. Trending Modes
The market moves in at least 4 phases. Trending, Ranging, Consolidation, Distribution.
Every trader has a different style —some scalp low-volatility moves during off-hours, while others ride macro trends across days. The problem with classic SuperTrend? It treats every market condition the same. A fixed system can’t possibly provide proper stoploss spacing for both a fast scalp and a long-term swing. Traders are forced to rebuild their system every time the market changes character or the session shifts.
This version solves that with a simple toggle:
Scalping or Trend Mode . With one switch, it inverts the logic of the adaptive factor to either tighten or loosen your trailing stops. During low-liquidity hours or consolidation phases, Scalping Mode offers snug stoplosses. During expansion or clear directional bias.
Trend Mode lets the trade breathe. This is flexibility built directly into the logic—not something you have to recalibrate manually.
📉 Histogram Oscillator for Move Strength
In legacy indicators, there’s no built-in way to gauge when the move is losing power . Traders rely on price action or momentum indicators to guess if a trend is fading. But this adds clutter, lag, and often contradiction. The classic SuperTrend doesn’t offer insight into how strong or weak the current trend leg is—only whether price has crossed a line.
This version includes a Trending Liquidity Histogram —a histogram that shows whether the liquidity in the SuperTrend zone is expanding or compressing. When the bars weaken or cross toward zero, it signals liquidity exhaustion . This early warning gives you time to prep for reversals or anticipate pullbacks. It even adapts visually depending on your trading mode, showing color-coded signals for scalping vs. trending behavior. It's both a strength gauge and a trade timing tool—built into your stoploss logic.
Histogram in Scalping Mode
Histogram in Trending Mode
📊 Visual Table for Real-Time Clarity
A major issue with custom indicators is opacity —you don’t always know what settings or values are currently being used. Even worse, if your dynamic logic changes mid-trade, you may not notice unless you go digging into the code or logs. This can create confusion, especially for discretionary traders.
This SuperTrend solves it with a clean visual summary table right on your chart. It shows your current ATR value, adaptive multiplier, trailing stop level, and whether a new zone size is active. That means no surprises and no second-guessing—everything important is visible and updated in real-time.

HTF CandlesThis indicator helps to visualize what is happening on the higher timeframe on your current chart without having to change intervals. Quickly see gaps, imbalances, trends on the higher timeframe while you are trading. Works excellent for seeing 5m or 15m trend on a 1m chart for example.

Multi EMA with Smoothing & BBMulti EMA with Smoothing & BB
────────────────────────────
This script overlays **four exponential moving averages**—fully adjustable (defaults 20/30/40/50)—to give an instant read on trend direction via “EMA stacking.”
• When the faster lines (short lengths) sit above the slower ones, the market is in up-trend alignment; the opposite stack signals down-trend momentum.
┌─ Optional Smoothing Engine
│ The 4th EMA (slowest) can be run through a second moving-average filter to cut noise:
│ ─ SMA ─ EMA ─ SMMA/RMA ─ WMA ─ VWMA ─ None
│ You choose both the type and length (default 14).
│ This smoothed line often acts as dynamic support/resistance for pull-back entries.
└───────────────────────────
┌─ Built-in Bollinger Bands
│ If you pick **“SMA + Bollinger Bands,”** the script wraps the smoothed EMA with upper/lower bands using a user-set standard-deviation multiplier (default 2.0).
│ • Band expansion ⇒ rising volatility / breakout potential.
│ • Band contraction ⇒ consolidation / squeeze conditions.
└───────────────────────────
Extra Utilities
• **Offset** (±500 bars) lets you shift every plot forward or backward—handy for visual back-testing or screenshot aesthetics.
• Selectable data *source* (close, HLC3, etc.) for compatibility with custom feeds.
• Transparent BB fill improves chart readability without hiding price.
Typical Uses
1. **Trend Confirmation** – Trade only in the direction of a clean EMA stack.
2. **Dynamic Stops/Targets** – Trail stops along the smoothed EMA or take profit at opposite BB.
3. **Volatility Filter** – Enter breakout strategies only when BB width begins to widen.
Parameter Summary
• EMA Lengths: 1–500 (defaults 20 | 30 | 40 | 50)
• Smoothing Type: None / SMA / EMA / SMMA / WMA / VWMA / SMA + BB
• Smoothing Length: 1–500 (default 14)
• BB StdDev: 0.001–50 (default 2.0)
• Offset: -500…+500 bars
No repainting – all values calculated on fully closed candles.
Script written in Pine Script v6. Use at your own discretion; not financial advice.

Volumetric Expansion/Contraction### Indicator Title: Volumetric Expansion/Contraction
### Summary
The Volumetric Expansion/Contraction (PCC) indicator is a comprehensive momentum oscillator designed to identify high-conviction price moves. Unlike traditional oscillators that only look at price, the PCC integrates four critical dimensions of market activity: **Price Change**, **Relative Volume (RVOL)**, **Cumulative Volume Delta (CVD)**, and **Average True Range (ATR)**.
Its primary purpose is to help traders distinguish between meaningful, volume-backed market expansions and noisy, unsustainable price action. It gives more weight to moves that occur in a controlled, low-volatility environment, highlighting potential starts of new trends or significant shifts in market sentiment.
### Key Concepts & Purpose
The indicator's unique formula synthesizes the following concepts:
1. **Price Change:** Measures the magnitude and direction of the primary move.
2. **Relative Volume (RVOL):** Confirms that the move is backed by significant volume compared to its recent average, indicating institutional participation.
3. **Cumulative Volume Delta (CVD):** Measures the underlying buying and selling pressure, confirming that the price move is aligned with the net flow of market orders.
4. **Inverse Volatility (ATR):** This is the indicator's unique twist. It normalizes the signal by the inverse of the Average True Range. This means the indicator's value is **amplified** when volatility (ATR) is low (signifying a controlled, confident expansion) and **dampened** when volatility is high (filtering out chaotic, less predictable moves).
The goal is to provide a single, easy-to-read oscillator that signals when price, volume, and order flow are all in alignment, especially during a breakout from a period of contraction.
### Features
* **Main Oscillator Line:** A single line plotted in a separate pane that represents the calculated strength of the volumetric expansion or contraction.
* **Zero Line:** A dotted reference line to easily distinguish between bullish (above zero) and bearish (below zero) regimes.
* **Visual Threshold Zones:** The background automatically changes color to highlight periods of significant strength:
* **Bright Green:** Indicates a "Strong Up Move" when the oscillator crosses above the user-defined upper threshold.
* **Bright Fuchsia:** Indicates a "Strong Down Move" when the oscillator crosses below the user-defined lower threshold.
### Configurable Settings & Filters
The indicator is fully customizable to allow for extensive testing and adaptation to different assets and timeframes.
#### Main Calculation Inputs
* **Price Change Lookback:** Sets the period for calculating the primary price change.
* **CVD Normalization Length:** The lookback period for normalizing the Cumulative Volume Delta.
* **RVOL Avg Volume Length:** The lookback for the simple moving average of volume, used to calculate RVOL.
* **RVOL Normalization Length:** The lookback period for normalizing the RVOL score.
* **ATR Length & Normalization Length:** Sets the periods for calculating the ATR and its longer-term average for normalization.
#### Weights
* Fine-tune the impact of each core component on the final calculation, allowing you to emphasize what matters most to your strategy (e.g., give more weight to CVD or RVOL).
#### External Market Filter (Powerful Feature)
* **Enable SPY/QQQ Filter for Up Moves?:** A checkbox to activate a powerful regime filter.
* **Symbol:** A dropdown to choose whether to filter signals based on the trend of **SPY** or **QQQ**.
* **SMA Period:** Sets the lookback period for the Simple Moving Average (default is 50).
* **How it works:** When enabled, this filter will **only allow "Strong Up Move" signals to appear if the chosen symbol (SPY or QQQ) is currently trading above its specified SMA**. This is an excellent tool for aligning your signals with the broader market trend and avoiding bullish entries in a bearish market.
#### Visuals
* **Upper/Lower Threshold:** Allows you to define what level the oscillator must cross to trigger the colored background zones, letting you customize the indicator's sensitivity.
***
**Disclaimer:** This tool is designed for market analysis and confluence. It is not a standalone trading system. Always use this indicator in conjunction with your own trading strategy, risk management, and other forms of analysis.


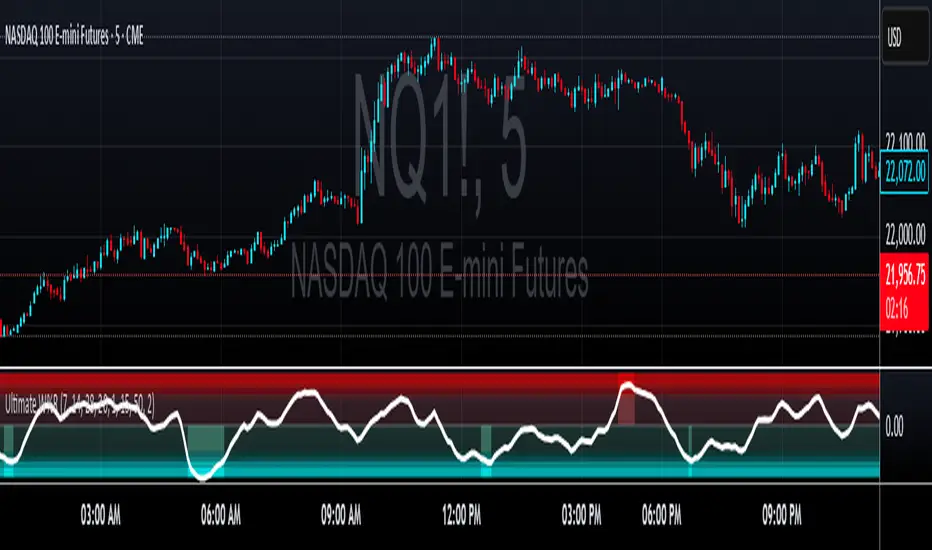
Ultimate Williams %RUltimate Williams %R
The most advanced Williams %R indicator available - featuring multi-timeframe analysis, zero-lag processing, volatility adaptivity, and intelligent extreme zone detection.
Key Improvements Over Standard Williams %R
Multi-Timeframe: Combines short, medium, and long-term Williams %R calculations with Ultimate Oscillator-style weighting for superior signal quality
Zero-Lag Implementation: Utilizes Ehler's Zero-Lag EMA with error correction, eliminating traditional oscillator lag while maintaining smoothness
Volatility Adaptive: Automatically adjusts periods based on ATR volatility analysis for optimal performance in all market conditions
Z-Score Normalization: Provides consistent, statistically-based extreme level detection across different market environments
Perfect For
Overbought/Oversold Identification: Instantly spot extreme market conditions with visual intensity that scales with signal strength
Divergence Analysis: Enhanced responsiveness and smooth operation make divergence patterns clearer and more reliable
Multi-Timeframe Confirmation: Built-in timeframe combination eliminates the need for multiple Williams %R indicators
Entry/Exit Timing: Zero-lag processing provides earlier signals without sacrificing accuracy
Customizable Settings
Timeframe Periods: Adjustable short (7), medium (14), and long (28) periods
Volatility Adaptation: Configurable ATR-based period adjustment
Zero-Lag Processing: Toggle and fine-tune the smoothing system
Z-Score Normalization: Adjustable lookback period for statistical analysis
Extreme Levels: Customizable threshold for extreme signal detection
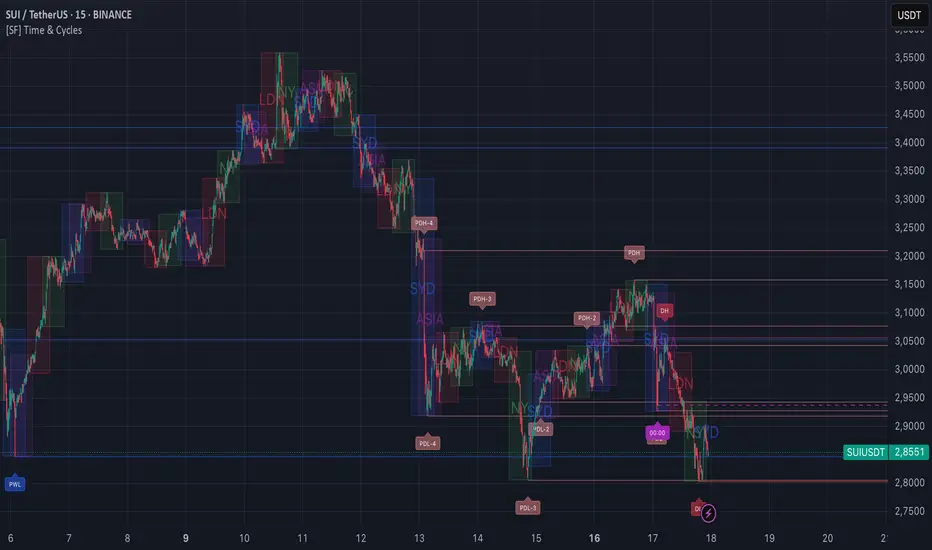
[FS] Time & Cycles Time & Cycles
A comprehensive trading session indicator that helps traders identify and track key market sessions and their price levels. This tool is particularly useful for forex and futures traders who need to monitor multiple trading sessions.
Key Features:
• Multiple Session Support:
- London Session
- New York Session
- Sydney Session
- Asia Session
- Customizable TBD Session
• Session Visualization:
- Clear session boxes with customizable colors
- Session labels with adjustable visibility
- Support for sessions crossing midnight
- Timezone-aware calculations
• Price Level Tracking:
- Daily High/Low levels
- Weekly High/Low levels
- Previous session High/Low levels
- Customizable history depth for each level type
• Customization Options:
- Adjustable colors for each session
- Customizable border styles
- Label visibility controls
- Timezone selection
- History level depth settings
• Technical Features:
- High-performance calculation engine
- Support for multiple timeframes
- Efficient memory usage
- Clean and intuitive visual display
Perfect for:
• Forex traders monitoring multiple sessions
• Futures traders tracking market hours
• Swing traders identifying key session levels
• Day traders planning their trading hours
• Market analysts studying session patterns
The indicator helps traders:
- Identify active trading sessions
- Track session-specific price levels
- Monitor market activity across different time zones
- Plan trades based on session boundaries
- Analyze price action within specific sessions
Note: This indicator is designed to work across all timeframes and is optimized for performance with minimal impact on chart loading times.
RSI Distance+Here’s a Pine Script that highlights when the RSI line is significantly far from its moving average, just like in your marked image:
🔍 How It Works:
Calculates RSI and its SMA.
Measures absolute distance between the two.
If that distance exceeds your chosen threshold (e.g. 4.0), it:
Colors the background behind the RSI.
Marks it with a small red circle on the RSI line.
You can adjust the distanceThreshold input to fine-tune sensitivity based on your preference.

IKODO Harmonic Patterns🧠 IKODO Prof Price Action Indicator
"Let the price speak. We just listen."
While most traders rely on lagging tools, IKODO Prof reads the raw language of the market — price itself.
🔹 Zero lag. Zero noise. Pure price intelligence.
🔹 Real-time detection of breaker zones, liquidity hunts, and smart money traps
🔹 Designed for institutional-grade precision
🔹 Built for scalpers, swing traders, and those who don't follow the herd
> “Price action is not a tool — it’s a mindset.”
Welcome to IKODO Prof — a weapon, not just an indicator.

Breakout Time Zones (CT)High and low of 3am-7am central time plus high and low of 8:30-8:44 high and low

EMA 52W 65-80% Down ShiftShifted EMA 52W. Useful in identifying the low points of medium- and long-term trends on altcoins. EMA 52 W - Annual Trend A 65-75% downward shift relative to the current position potentially indicates deep drawdowns for most investor participants and can serve as an approximate zone for a medium-term rebound or trend reversal.

Running Minimum HighThe running minimum high looks at the minimum high from a defined lookback period (default 10 days) and plots that on the price chart. Green arrows signify when the low of the candle is above the running minimum high (suggesting an uptrend), and red arrows signify when the high of the candle is below the running minimum high (suggesting a downtrend).
It is recommended to use this on high timeframes (e.g. 1 hour and above) given the high number of signals it generates on lower timeframes.


Session Range ProjectionsSession Range Projections
Purpose & Concept:
Session Range Projections is a comprehensive trading tool that identifies and analyzes price ranges during user-defined time periods. The indicator visualizes high-probability reversal zones and profit targets by projecting Fibonacci levels from custom session ranges, making it ideal for traders who focus on time-based market structure analysis.
Key Features & Calculations:
1. Custom Time Range Analysis
- Define any time period for range calculation - from traditional sessions (Asian, London, NY) to custom periods like opening ranges, hourly ranges, or 4-hour blocks
- Automatically captures the highest and lowest prices within your specified timeframe
- Supports multiple timezone selections for global market analysis
- Flexible enough for intraday scalping ranges or longer-term swing trading setups
2. Premium & Discount Zones
- Automatically divides the range into premium (above 50%) and discount (below 50%) zones
- Visual differentiation helps identify institutional buying and selling areas
- Color-coded boxes clearly mark these critical price zones
3. Optimal Trade Entry (OTE) Zones
- Highlights the 79-89% retracement zone in premium territory
- Highlights the 11-21% retracement zone in discount territory
- These zones represent high-probability reversal areas based on institutional order flow concepts
4. Fibonacci Projections
- Projects 11 customizable Fibonacci extension levels from the range extremes
- Levels extend both above and below the range for symmetrical analysis
- Each level can be individually toggled and color-customized
- Default levels include common retracement ratios: -0.5, -1.0, -2.0, -2.33, -2.5, -3.0, -4.0, -4.5, -6.0, -7.0, -8.0
How to Use:
Set Your Time Range: Input your desired session start and end times (24-hour format)
Select Timezone: Choose the appropriate timezone for your trading session
Customize Display: Toggle various visual elements based on your preferences
Monitor Price Action: Watch for reactions at projected levels and OTE zones
Set Alerts: Configure sweep alerts for when price breaks above/below range extremes
Input Parameters Explained:
Time Range Settings
Range Start/End Hour & Minute: Define your analysis period
Time Zone: Ensure accurate session timing across different markets
Visual Settings
Range Box: Toggle the premium/discount zone visualization
Horizontal Lines: Customize high/low line appearance
Internal Range Levels: Show/hide equilibrium and OTE zones
Labels: Configure text display for key levels
Fibonacci Projections: Enable/disable extension levels
Display Settings
Historical Ranges: Show up to 10 previous session ranges
Alert Type: Choose between high sweep, low sweep, or both
Trading Applications:
Session-Based Trading: Analyze specific market sessions (Asian, London, New York, opening ranges, hourly ranges)
Reversal Trading: Identify high-probability reversal zones at OTE levels
Breakout/Reversal Trading: Monitor range breaks/reversals with built-in sweep alerts
Risk Management: Use Fibonacci projections as profit targets or rejection areas
Multi-Timeframe Analysis: Apply to any timeframe for various trading styles
Important Notes:
This indicator is for educational purposes only and should not be considered financial advice
Past performance does not guarantee future results
Always use proper risk management when trading
The indicator automatically manages historical data to maintain chart performance

RACZ-SIGNAL-V2.1RACZ-SIGNAL-V2.1 – Reactive Analytical Confluence Zones
Developed by: RACZ Trading
Indicator Type: Multi-Factor Confluence System
Overlay: Off (separate pane)
Purpose: Detect powerful trade opportunities through confluence of technical signals.
⸻
🔍 What is RACZ?
RACZ stands for Reactive Analytical Confluence Zones.
It’s a high-precision trading tool built for traders who rely on multi-signal confirmation, momentum alignment, and market structure awareness.
Rather than relying on a single technical metric, RACZ dynamically combines RSI, VWAP-RSI, Divergence, ADX, and Volume Analytics to produce a composite signal score from 0 to 12 — the higher the score, the stronger the signal.
⸻
🧠 How It Works – Core Components
1. RSI Analysis
• Detects momentum shifts.
• Compares RSI value to overbought (default: 67) and oversold (default: 33) thresholds.
• Adds points to Bullish or Bearish score.
2. VWAP-RSI
• Uses RSI based on VWAP (Volume Weighted Average Price).
• Adds weight to signals influenced by volume-adjusted price movement.
3. Divergence Detection
• Detects potential reversal zones.
• Bullish Divergence: RSI crosses up from low zone.
• Bearish Divergence: RSI crosses down from high zone.
• Strong confluence signal when present.
4. ADX Dynamic Strength Filter
• Custom-calculated ADX (trend strength indicator).
• Uses a dynamic threshold derived from SMA of ADX over a lookback period, scaled by a factor (default 0.9).
• Ensures signals are only validated in strong trend environments.
5. Volume Z-Score
• Detects anomalies in volume behavior.
• Z-score applied to 20-period volume average & deviation.
• Labels spikes, drops, high/low volume conditions.
⸻
📊 Signal Scoring Logic
Each component (RSI, VWAP-RSI, Divergence, ADX) can score up to 3 points each.
• Bullish Score: Total from bullish alignment of each factor.
• Bearish Score: Total from bearish alignment of each factor.
• Signal Power = max(bullish, bearish)
📈 Signal Interpretation
• BUY: Bullish Score > Bearish Score
• SELL: Bearish Score > Bullish Score
• NEUTRAL: Scores are equal
• Signal power is plotted on a 0–12 histogram:
• 0–5 = Weak
• 6–8 = Medium
• 9–12 = Strong (High Confluence Zone)
🖥️ Live Status Panel (Top-Right Corner)
This real-time panel helps you break down the signal:Component
Value Explanation: RSI / VWAP / DIV / ADX
Shows points contributing to signal
SIGNAL: Current market bias (BUY, SELL, NEUTRAL)
VOLUME: Volume classification (Spike, Drop, High, Low, Normal)
Color-coded for quick interpretation.
✅ How to Use
1. Look at Histogram: Bars ≥6 suggest valid setups, especially ≥9.
2. Confirm Panel Agreement: Check which components are supporting the signal.
3. Validate Volume: Unusual spikes/drops often precede strong moves.
4. Follow Direction: Use BUY/SELL signals aligned with signal power and trend.
⸻
⚙️ Customizable Inputs
• RSI period, overbought/oversold levels
• VWAP-RSI period
• ADX period and dynamic threshold settings
• Fully adjustable to fit any trading style
⸻
🚀 Why Choose RACZ?
• Clarity: Scores & signals derived from multiple tools, not just one.
• Confluence Logic: Designed for traders who look for confirmation across indicators.
• Speed: Real-time responsiveness to changing market dynamics.
• Volume Awareness: Integrated volume intelligence gives a deeper edge.
⸻
⚠️ Disclaimer
This indicator is intended strictly for educational and informational purposes only. It is not financial advice and should not be used to make actual investment decisions. Always conduct your own research or consult with a licensed financial advisor before trading or investing. Use of this script is at your own risk.

cd_cisd_market_CxHi Traders,
Overview:
Many traders follow market structure to identify the market direction and seek trade opportunities in line with the trend.
However, markings derived from user-defined inputs can create different structures, depending on personal choices. For instance, choosing a pivot distance of 3 instead of 2 alters the structure, even though the chart remains the same. Ideally, the structure should remain consistent.
"Change in State Delivery" ( CISD ) is a widely accepted concept among traders and is considered a significant indicator of market direction based on the gain/loss of CISD levels.
In this indicator, CISD is selected as the primary criterion for marking market structure, eliminating the influence of user-dependent variations.
Here is a summary of the key logic and rules applied:
• When the price forms a new high/low, that level is only considered a pivot if a CISD has occurred.
• A bullish CISD is always followed by a bearish CISD, and vice versa.
• Pivot points form the internal structure.
• The internal structure is used to interpret the swing structure.
• Probabilities are derived from internal structure patterns.
________________________________________
Details:
How is CISD determined?
As is commonly known:
• When price makes a new high, the opening level of the first candle in the consecutive bullish candle sequence is marked.
• When price makes a new low, the opening of the first candle in the consecutive bearish sequence is marked.
• If there’s only one candle in the sequence, its opening level is used.
In a bullish market, losing a bearish CISD level (i.e., a close below it) or in a bearish market, gaining a bullish CISD level (i.e., a close above it) is interpreted as a potential shift in buyer-seller dominance and a possible market reversal.
________________________________________
How are internal (pivot) levels determined?
• When price closes below a bearish CISD level, the highest candle's high becomes a pivot high (PH).
• When price closes above a bullish CISD level, the lowest candle's low becomes a pivot low (PL).
• If the new PH is above the previous PH, it’s labeled as HH (Higher High); otherwise, LH (Lower High).
• If the new PL is below the previous PL, it’s labeled as LL (Lower Low); otherwise, HL (Higher Low).
________________________________________
Internal Market Structure:
• A series of HHs indicates a bullish internal structure.
• A series of LLs indicates a bearish internal structure.
________________________________________
Swing (Main) Market Structure:
Using internal pivots and previous swing levels, the main market structure is derived.
• A new swing high (SH) requires the price to move above the previous SH.
• A new swing low (SL) requires the price to move below the previous SL.
________________________________________
Probability Calculation:
Pivot levels forming the internal structure are coded as five-element sequences.
There are 64 possible combinations of such sequences made from consecutive PH and PL values.
Each pattern’s frequency from its starting candle is tracked.
To make it more understandable:
For example, after the four-sequence “HH, LL, LH,HL”, either HH or LH might follow.
The table shows the statistical likelihood of both possible outcomes for the most recent four-element sequence on the chart.
________________________________________
How reliable is it?
To assess reliability, results are calculated from the beginning using:
Success Rate (Suc. Rt) = Number of Correct Predictions / Total Predictions
This value is added to the table for reference.
It’s important to note that no statistical outcome guarantees certainty—every result offers a different interpretation. What truly matters is to avoid getting stopped out 😊.
________________________________________
Menu Options:
Show/hide preferences and color selections can be customized via the indicator menu.
________________________________________
What’s Coming in Future Versions?
Features such as FVG (Fair Value Gaps) between swing levels, volume imbalances, order blocks / mitigation blocks, Fibonacci levels, and relevant trade suggestions will be added.
________________________________________
This is a BETA version that I believe will help simplify your market reading. I’d be happy to hear your feedback and suggestions.
Cheerful Trading!

PDH/PDL + OVN-H/L (Right-Aligned Labels + Alerts)Automatically plots the PDH/L (Prior Day High/Low) and OVN-H/L (Overnight High/Low) of the current session.
✅ What it does:
Plots PDH/PDL each day — they appear freshly after 9:30 AM EST, for the entire regular session.
Does NOT extend lines overnight — breaks the line between 16:00 and the next 9:30.
Plots OVN-H / OVN-L as dashed lines, after 9:30 AM EST each day, from 9:30 to 16:00 only.
Clean lines that reset daily
Right-aligned labels showing the level names and price values
🔔 Alerts Included:
Cross Above PDH
Cross Below PDL
Cross Above OVN-H
Cross Below OVN-L
Works on 30min or lower timeframe

Supertrend with EMASupertrend with EMA Technical Documentation
This document provides a technical overview of the "Supertrend with EMA" Pine Script indicator, designed for use on TradingView. This indicator combines the popular Supertrend indicator with an Exponential Moving Average (EMA) and an additional smoothing line, offering a comprehensive view of trend direction and potential support/resistance levels.
Indicator Overview
The "Supertrend with EMA" indicator is an overlay script, meaning it plots directly on the price chart. It is compatible with all timeframes and handles timeframe gaps.
Key Features:
Supertrend Calculation: Identifies trend direction using Average True Range (ATR) and a user-defined factor.
EMA Integration: Displays an Exponential Moving Average for additional trend confirmation and dynamic support/resistance.
Smoothing Line: Incorporates a customizable smoothing line applied to the EMA, offering further refinement of trend signals.
Visual Trend Representation: Clearly distinguishes uptrends (green) from downtrends (red) using filled areas.
Alerts: Provides alert conditions for Supertrend trend reversals.
Inputs
Users can customize the indicator's behavior through the following input parameters:
Supertrend Settings
ATR Length: input.int(10, "ATR Length", minval = 1)
Description: The lookback period used for calculating the Average True Range (ATR). A higher value results in a smoother Supertrend line, while a lower value makes it more reactive.
Default: 10
Minimum: 1
Factor: input.float(3.0, "Factor", minval = 0.01, step = 0.01)
Description: The multiplier applied to the ATR to determine the Supertrend bands. A higher factor creates wider bands and fewer signals, while a lower factor creates narrower bands and more signals.
Default: 3.0
Minimum: 0.01
Step: 0.01
EMA Settings
EMA Length: input.int(9, minval=1, title="EMA Length")
Description: The number of bars used in the Exponential Moving Average calculation.
Default: 9
Minimum: 1
Source: input(close, title="Source")
Description: The price series used for EMA calculation. By default, it uses the close price.
Default: close
Offset: input.int(title="Offset", defval=0, minval=-500, maxval=500, display = display.data_window)
Description: Shifts the EMA plot horizontally by the specified number of bars.
Default: 0
Minimum: -500
Maximum: 500
Smoothing Settings
Method: input.string(title = "Method", defval = "SMA", options= , group="Smoothing", display = display.data_window)
Description: Selects the type of moving average to use for smoothing the EMA. Options include Simple Moving Average (SMA), Exponential Moving Average (EMA), Smoothed Moving Average (SMMA/RMA), Weighted Moving Average (WMA), and Volume Weighted Moving Average (VWMA).
Default: "SMA"
Length: input.int(title = "Length", defval = 5, minval = 1, maxval = 100, group="Smoothing", display = display.data_window)
Description: The lookback period for the selected smoothing method.
Default: 5
Minimum: 1
Maximum: 100
Calculations
Supertrend Calculation
The Supertrend indicator is calculated using the built-in ta.supertrend function:
= ta.supertrend(factor, atrPeriod)
supertrend: The actual Supertrend line value.
direction: Indicates the current trend direction. A value of -1 typically signifies an uptrend, and 1 signifies a downtrend.
The supertrend line is plotted in green for uptrends and red for downtrends, with fills between the bodyMiddle (average of open and close prices) and the Supertrend line for visual clarity.
Exponential Moving Average (EMA) Calculation
The EMA is calculated using the ta.ema function:
out = ta.ema(src, len)
src: The user-defined source series (default: close).
len: The user-defined EMA length.
Smoothing Line Calculation
A custom ma function is used to calculate various types of moving averages, which is then applied to the EMA output:
out: The calculated EMA value.
smoothingLength: The user-defined length for the smoothing moving average.
typeMA: The user-selected type of moving average for smoothing.
Plots
The indicator plots the following on the chart:
Up Trend: The Supertrend line when the direction indicates an uptrend (color: green).
Down Trend: The Supertrend line when the direction indicates a downtrend (color: red).
Body Middle: The average of the open and close prices (open + close) / 2. This plot is hidden (display = display.none) but used for filling the areas between the price and Supertrend line.
EMA: The Exponential Moving Average (color: blue).
Smoothing Line: The moving average applied to the EMA (color: orange, hidden by default).
Alerts
The indicator provides three alert conditions based on Supertrend trend reversals:
Downtrend to Uptrend: Triggers when the Supertrend direction switches from downtrend (direction > direction) to uptrend.
Uptrend to Downtrend: Triggers when the Supertrend direction switches from uptrend (direction < direction) to downtrend.
Trend Change: Triggers on any Supertrend trend reversal (direction != direction), combining both downtrend to uptrend and uptrend to downtrend changes.

🎯 IKODO Prof Price Action⚔️ IKODO Prof Price Action Indicator
"Let the price speak. We just listen."
Forget lagging indicators.
IKODO Prof is not just another tool – it’s your edge in a market full of noise.
Crafted with precision, this indicator:
🔹 Strips away clutter and focuses on pure price movement
🔹 Detects liquidity grabs, fakeouts, and smart money footprints
🔹 Analyzes candle structures, breaker zones, and trend shifts in real-time
🔹 Never lags — because price action never lies
Built for traders who understand that:
> "Price is the ultimate indicator."
Whether you're scalping or swing trading, IKODO Prof keeps you on the right side of the market — the side where institutions play.
This isn’t just an indicator.
This is a framework, a philosophy, a weapon.
> Welcome to the next level.
Welcome to IKODO Prof.

5 EMAs 200, 55, 50, 21, 9This indicator combines 5 EMAs
200 EMA => shows larger trend
9 EMA => fast
21 => medium, Fibonacci number
50 => Slow, Fibonacci number
55 => Slow, frequently used in the market
when the 9 crossed 21 to the upside, signals uptrend
when 21 crosses 55 => stronger uptrend
when the 9 crossed 21 to the downside, signals downtrend
when 21 crosses 55 => stronger downtrend

FXMC Breakout with Strict Single SignalIt's designed to help traders identify and act on breakouts from the first candle of the trading day, with sophisticated options for managing trades and booking profits.
Understanding the "FXMC Breakout with Strict Single Signal" Indicator
This indicator, aptly named "FXMC Breakout with Strict Single Signal," is a powerful tool for day traders. It focuses on a popular strategy: trading the high and low of the first X-minute candle of the trading session. What makes this version particularly useful is its emphasis on clean, non-repetitive signals and its integration of multiple advanced exit strategies.
Core Concept: First Candle Breakout
The fundamental idea is simple: the first candle of the trading day (often the 5-minute or 15-minute candle) sets an important range. A breakout above its high suggests bullish momentum, while a break below its low suggests bearish momentum.
Here's how the script establishes this:
Adjustable First Candle: You can select the duration of this "first candle" directly from the indicator's settings (e.g., 1-minute, 5-minute, 15-minute, etc.). This makes it versatile for different markets and strategies.
Session Time: You define your trading session (e.g., "0915-1530" for Indian markets). The script will capture the high and low of the selected first candle only at the start of this session each day.
Daily Reset: At the beginning of each new day, all previous signals and trade states are reset, preparing the indicator for a fresh set of opportunities.
Visualizing the Range: Once identified, the high (green line) and low (red line) of this first candle are plotted as horizontal lines that extend throughout the trading day, clearly marking your breakout levels.
Entry Signals: Once per Direction, Per Day
The script generates clear entry signals:
Buy Entry (Green Up-Triangle): Appears when the price closes above the first candle's high.
Sell Entry (Orange Down-Triangle): Appears when the price closes below the first candle's low.
Strict Single Signal: A key feature is that you'll only see one Buy Entry and one Sell Entry signal per day. If a buy signal triggers, the script won't generate another buy signal until the trade is exited and a new opportunity arises (which would be the next day, as this strategy is typically intraday). Similarly for sell signals.
Advanced Exit Strategies: Multiple Options, Single Signal
This is where the indicator truly shines, offering robust ways to manage your trades once an entry has occurred. You can enable or disable these methods in the indicator settings:
Price Cross Back (Default Exit):
Long Trade Exit: If you're in a long position and the price closes back below the first candle's high, it signals an exit.
Short Trade Exit: If you're in a short position and the price closes back above the first candle's low, it signals an exit.
ATR Trailing Stop:
Volatility-Adjusted: This stop loss automatically adjusts to market volatility. When you enter a trade, a trailing stop is set a certain multiple of the Average True Range (ATR) away from the entry price.
Protects Profits: As the price moves in your favor, the stop trails behind it, locking in profits while still allowing room for normal market fluctuations. It never moves against your position.
Exit Trigger: An exit signal is generated if the price closes back beyond this trailing stop level.
RSI Exit (Overbought/Oversold):
Momentum Based: Uses the Relative Strength Index (RSI) to identify extreme momentum conditions.
Long Trade Exit: If you're long and the RSI moves above a user-defined "overbought" level (e.g., 70 or 80), it suggests the upward move might be exhausted, prompting an exit.
Short Trade Exit: If you're short and the RSI moves below a user-defined "oversold" level (e.g., 30 or 20), it suggests the downward move might be overdone, prompting an exit.
EMA Crossover Exit:
Trend Reversal: This uses two Exponential Moving Averages (EMAs) – a fast one and a slow one.
Long Trade Exit: If you're long and the fast EMA crosses below the slow EMA, it indicates a potential shift to a bearish trend, signaling an exit.
Short Trade Exit: If you're short and the fast EMA crosses above the slow EMA, it indicates a potential shift to a bullish trend, signaling an exit.
Single Exit Signal (Crucial Improvement): Just like entries, you'll only see one exit signal (an "X" mark) per trade. The script tracks your implied position (long, short, or flat). Once you're in a trade, it continually checks all enabled exit conditions. The first condition met will trigger the single exit signal, flatten your implied position, and reset for the next trading day.
Visual Aids and Alerts
Background Colors: The chart background changes color to indicate if the indicator is currently in a simulated Long position (light green) or Short position (light orange). This gives you a quick visual overview of the trade's duration.
Plotting Trailing Stop (Optional): You can see the ATR trailing stop line dynamically adjust on your chart when a position is active, providing clear visualization of your protective stop.
Alerts: The indicator is equipped with alerts for both entries and exits, so you can be notified in real-time when signals occur without constantly watching the chart.
How to Use It
Add to Chart: Apply the indicator to any intraday chart (e.g., 1-minute, 5-minute, 15-minute).
Adjust Settings: Open the indicator's settings (Inputs tab) to:
Set your desired "First Candle Timeframe."
Define your "Session Time."
Enable or disable each of the "Exit Conditions" (ATR, RSI, EMA) and customize their parameters to fit your trading style and the asset you're analyzing.
Analyze Signals: Observe the entry and exit signals, along with the background colors, to understand the indicator's proposed trades.
This robust indicator provides a comprehensive framework for a first-candle breakout strategy, offering clear signals and dynamic trade management, all with a focus on a clean, uncluttered chart.
