Indicators and strategies
SMC Structure IndicatorTitle: SMC Structures Indicator
Description:
The SMC Structures indicator is a powerful tool designed to identify and visualize key structural elements in price action, based on the principles of Smart Money Concepts (SMC). This indicator helps traders identify potential areas of support, resistance, and price reversals by highlighting significant market structures.
Key Features:
Structure Identification: The indicator automatically detects and marks important high and low structures in the market.
Break of Structure (BOS) Detection: It identifies and labels instances where previous structures are broken, indicating potential trend changes or continuations.
Change of Character (CHoCH) Detection: The indicator recognizes and marks Changes of Character, which are significant shifts in market behavior.
Customizable Visuals: Users can personalize the appearance of BOS and CHoCH markings, including colors, line styles, and widths.
Current Structure Display: The indicator can optionally show the current active structure, helping traders understand the immediate market context.
Historical Structure Tracking: Users can specify the number of historical structure breaks to display, allowing for a cleaner chart while maintaining relevant information.
Flexible Break Confirmation: The indicator offers the option to confirm structure breaks using either the candle body or wick, accommodating different trading styles.
Technical Details:
The indicator uses advanced algorithms to identify significant price structures based on local highs and lows.
It employs a lookback period of 10 bars for structure detection, ensuring relevance to current market conditions.
The code includes safeguards to handle different market phases and avoid false signals during ranging periods.
Customization Options:
Colors for Bullish and Bearish BOS and CHoCH markings
Line styles and widths for all structure markings
Number of historical breaks to display
Option to show or hide the current active structure
Choice between candle body or wick for structure break confirmation
Use Cases:
Trend Analysis: Identify the start of new trends or potential trend reversals.
Support and Resistance: Pinpoint key levels where price may react.
Trade Entry and Exit: Use structure breaks as potential entry or exit signals.
Market Context: Understand the broader market structure to make informed trading decisions.

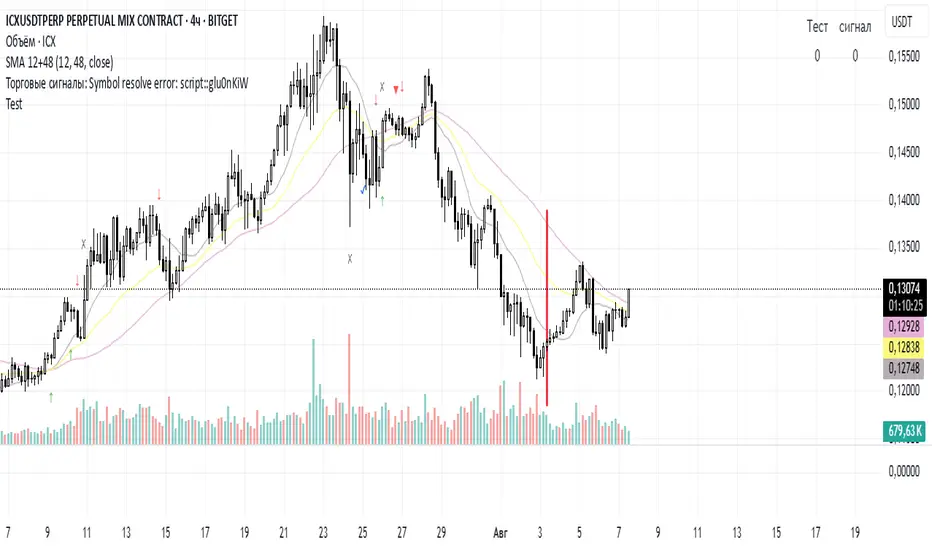
Volume point of control weighted SMASimple moving average based on my volume moving point of control (PoC) techical library.
This gives a more nuanced and stretched view of SMA factoring in volume data.
On this chart you will see the volume weighted SMA in blue (thick) compared to the SMA (in yellow).

[Stratégia] VWAP Mean Magnet v9 (Simple Alert)This strategy is specifically designed for a ranging (sideways-moving) Bitcoin market.
A trade is only opened and signaled on the chart if all three of the following conditions are met simultaneously at the close of a candle:
Zone Entry
The price must cross into the signal zone: the red band for a Short (sell) position, or the green band for a Long (buy) position.
RSI Confirmation
The RSI indicator must also confirm the signal. For a Short, it must go above 65 (overbought condition). For a Long, it must fall below 25 (oversold condition).
Volume Filter
The volume on the entry candle cannot be excessively high. This safety filter is designed to prevent trades during risky, high-momentum breakouts.

Bougies bleues en cas de gap haussierHere is the script to visually and quickly identify bullish gaps in blue.
Thank you, Mr. Kabbai Thami, for the power of this 'bullish gap' insight, which you combine with other indicators.
Green Arrow Signal: Close > EMA9 and EMA9 of RSI123 > 100Plot a green arrow below the bar when:
Close price > EMA9
EMA9 of RSI(123) > 100

Multi conditions, curve fitting strategies - indicators combinedThe goal of this script is to educate about curve fitted strategies.
You can use it to combine multiple indicators with many parameters, for both entry and exit, all at once, in order to evaluate their combined effect with either AND or OR operators.
Available technical indicators:
- Intra Bar Strengh (IBS)
- Fisher Transform
- Buy the dip (after *nb* falling bars)
- Timing (mondays | fridays)
- Timing (Five days low etc ...)
- SMA
- EMA
- RSI
- Higher Timeframe RSI (choose a HTF)
- HML
- Accumulation / Distribution
- Stochastic
- Point of control moving average (from me)
Buy orders options:
- Limit order percentage from entry point
- Stop order percentage from entry point
- Entry price source
- Nb of bars behind entry point (as price reference for order)
Sell orders option:
- Exit price source
- Nb of bars behind exit reference point
Take profits and stop losses:
- Take profit percentage
- Stop loss percentage
- Only take profit from exit signal if higher than entry take profits
Other parameters:
- Put a limit to the number of exit signals
- Always trigger exit signal after {n} bars
It is *highly* encouraged to use the "skip random trades" checkbox in order to add some noise and see the outcome of the strategy if the market would have played differently for the asset.
Of course the whole point of this little dashboard is to see that a performance chart depends on market conditions, performance is often more random than predictable and curve fitting doesn't create nice equity curves.
This script is a provided entirely free of charge and open source. It is based on my multi-conditions matrice library.

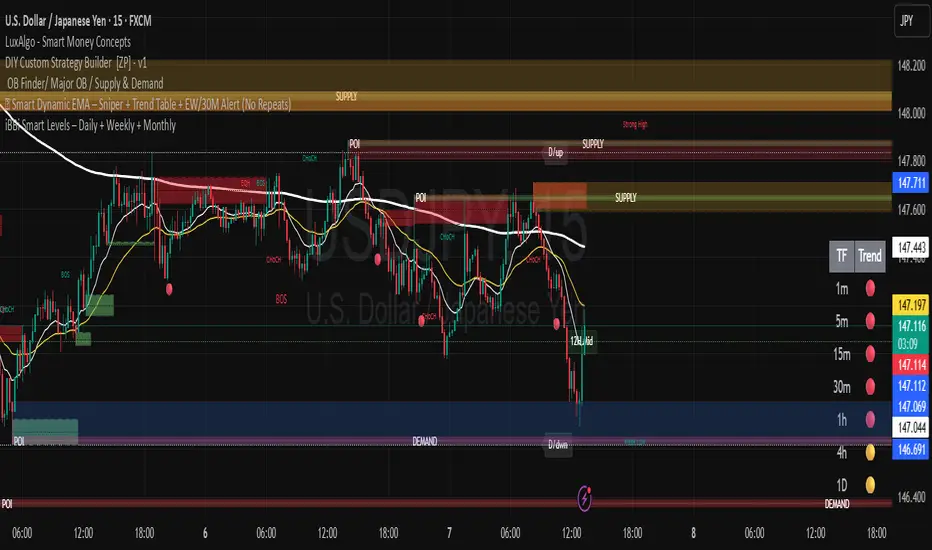
iBBi Smart Levels – Daily + Weekly + MonthlyThis is a level indicator. In trading levels make lots of difference - this indicator gives us, daily, weekly and monthly levels. Then, it gives last 12-hours high and low level. This means at any given time you will have these EIGHT LEVELS available to you.
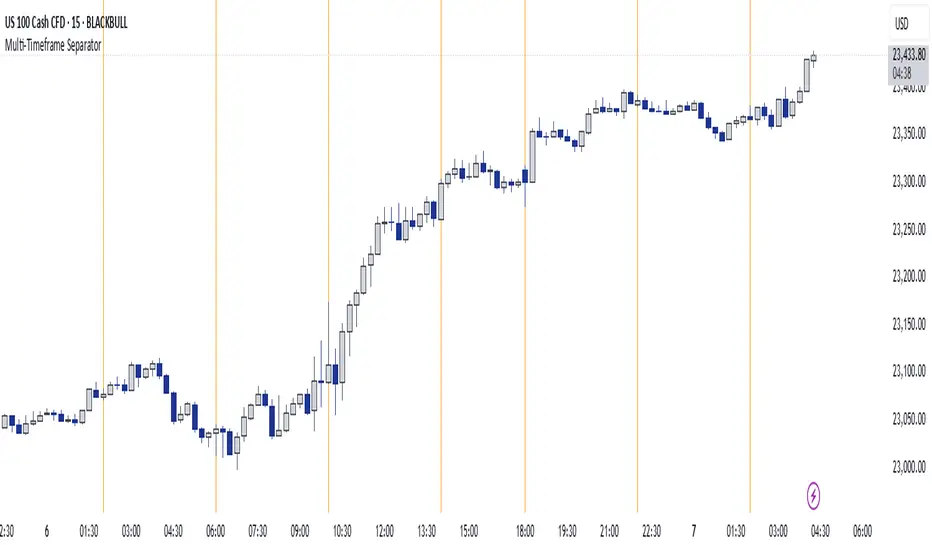
Multi-Timeframe SeparatorThis indicator draws vertical separator lines at the start of each candle from a higher timeframe, allowing you to visually align your current chart with key multi-timeframe structure such as 4H, Daily, Weekly, etc.
IMACD SniperIMACD Sniper
Description:
This strategy is designed for scalping with precision using the Impulse MACD and dynamic price ranges. It is especially optimized for traders with low capital and a fixed contract size, offering clear visual representation of Take Profit (TP) and Stop Loss (SL) targets for each trade.
Key Features:
Capital-efficient: Initial capital set at $1000, operating with a contract size of 0.1 (fully adjustable).
Clear Entry Logic: Based on Impulse MACD crossovers with distance filters, strong candles, and volume confirmation.
Dynamic TP/SL: Targets are calculated based on average candle range over the last N bars, with customizable multipliers.
Visual Clarity: Each trade displays a clean box showing both TP and SL prices as floating text without labels, reducing chart clutter.
Exit Conditions:
TP or SL is hit (whichever comes first).
MACD crosses in the opposite direction, triggering an early exit.
Inputs:
MACD Fast / Slow / Signal Length
MACD Minimum Distance
Zero Line Proximity Filter
EMA Length (default 20)
Dynamic Range Settings (TP/SL multipliers and lookback)
Volume Filter
How to Use:
Apply this strategy to assets with good volume and clear trends (e.g., XAUUSD, BTCUSD, NASDAQ). Best suited for timeframes between 5 and 15 minutes. Ensure spread and slippage are considered if trading manually.
Important Notes:
This script does not repaint.
All visual and capital parameters are configurable via input fields.
Backtest results may vary depending on the asset and timeframe. Always validate before going live.


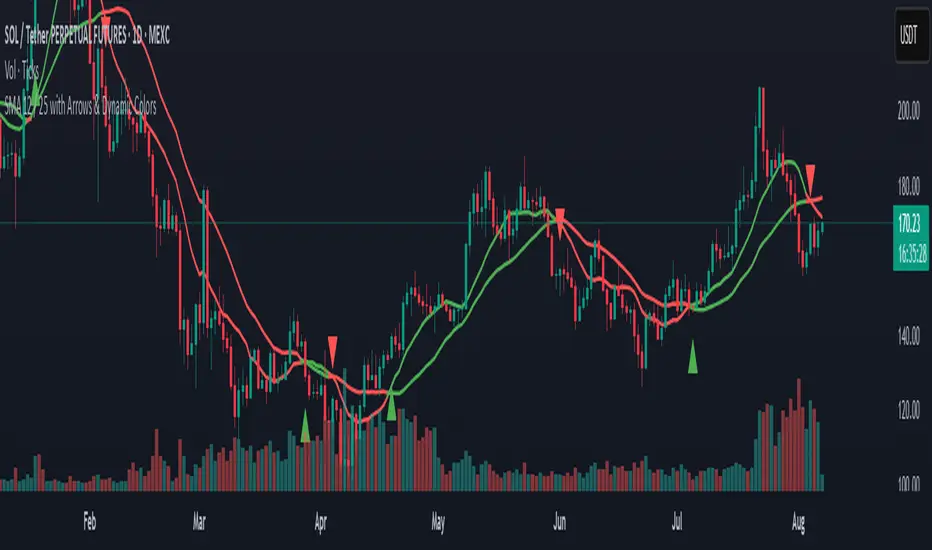
SMA 12 / 25 with Arrows & Dynamic ColorsSMA 12 / 25 with Arrows & Dynamic Colors
Colors are the same after crosses
Up down arrows at crosses
EMA 9/21 Crossover Alert (BerryRight)This indicator gives entry signals through EMA crossover and the gives the opportunity to set up alerts. I will update this indicator with exits in the future. it's written in Pinesctipt v5

5 EMA No-Touch Breakout 1:3 (Only 5m)This strategy is built for traders who want to ride strong trends using the principle of EMA rejection.
The concept is simple:
📉 Sell when price stays below the 5 EMA without touching it — indicating strong bearish momentum.
📈 Buy when price stays above the 5 EMA without touching it — indicating strong bullish momentum.

TCP | Market Session | Session Analyzer📌 TCP | Market Session Indicator | Crypto Version
A powerful, real-time market session visualization tool tailored for crypto traders. Track the heartbeat of Asia, Europe, and US trading hours directly on your chart with live session boxes, behavioral analysis, liquidity grab detection, and countdown timers. Know when the action starts, how the market behaves, and where the traps lie.
🔰 Introduction:
Trade the Right Hours with the Right Tools
Time matters in trading. Most significant moves happen during key sessions—and knowing when and how each session unfolds can give you a sharp edge. The TCP Market Session Indicator, developed by Trade City Pro (TCP), puts professional session tracking and behavioral insights at your fingertips.
Whether you're a scalper or swing trader, this indicator gives you the timing context to enter and exit trades with greater confidence and clarity.
🕒 Core Features
• Live Session Boxes :
Highlight active ranges during Asia, Europe, and US sessions with dynamic high/low updates.
• Session Start/End Labels :
Know exactly when each session begins and ends plotted clearly on your chart with context.
• Session Behavior Analysis :
At the end of each session, the indicator classifies the price action as:
- Trend Up
- Trend Down
- Consolidation
- Manipulation
• Liquidity Grab Detection: Automatically detects possible stop hunts (fake breakouts) and marks them on the chart with precision filters (volume, ATR, reversal).
• Session Countdown Table: A live dashboard showing:
- Current active session
- Time left in session
- Upcoming session and how many minutes until it starts
- Utility time converter (e.g. 90 min = 01:30)
• Vertical Session Lines: Visualize past and upcoming session boundaries with customizable history and future range.
• Multi-Day Support: Draw session ranges for previous, current, and future days for better backtesting and forecasting.
⚙️ Settings Panel
Customize everything to fit your trading style and schedule:
• Session Time Settings:
Set the opening and closing time for each session manually using UTC-based minute inputs.
→ For example, enter Asia Start: 0, Asia End: 480 for 00:00–08:00 UTC.
This gives full flexibility to adjust session hours to match your preferred market behavior.
• Enable or Disable Elements:
Toggle the visibility of each session (Asia, Europe, US), as well as:
- Session Boxes
- Countdown Table
- Session Lines
- Liquidity Grab Labels
• Timezone Selection:
Choose between using UTC or your chart’s local timezone for session calculations.
• Customization Options:
Select number of past and future days to draw session data
Adjust vertical line transparency
Fine-tune label offset and spacing for clean layout
📊 Smart Session Boxes
Each session box tracks high, low, open, and close in real time, providing visual clarity on market structure. Once a session ends, the box closes, and the behavior type is saved and labeled ideal for spotting patterns across sessions.
• Asia: Green Box
• Europe: Orange Box
• US: Blue Box
💡 Why Use This Tool?
• Perfect Timing: Don’t get chopped in low-liquidity hours. Focus on sessions where volume and volatility align.
• Pattern Recognition: Study how price behaves session-to-session to build better strategies.
• Trap Detection: Spot manipulation moves (liquidity grabs) early and avoid common retail pitfalls.
• Macro Session Mapping: Use as a foundational layer to align trades with market structure and news cycles.
🔍 Example Use Case
You're watching BTC at 12:45 UTC. The indicator tells you:
The Asia session just ended (label shows “Asia Session End: Trend Up”)
Europe session starts in 15 minutes
A liquidity grab just triggered at the previous high—label confirmed
Now you know who’s active, what the market just did, and what’s about to start—all in one glance.
✅ Why Traders Trust It
• Visual & Intuitive: Fully chart-based, no clutter, no guessing
• Crypto-Focused: Designed specifically for 24/7 crypto markets (not outdated forex models)
• Non-Repainting: All labels and boxes stay as printed—no tricks
• Reliable: Tested across multiple exchanges, pairs, and timeframes
🧩 Built by Trade City Pro (TCP)
The TCP Market Session Indicator is part of a suite of professional tools used by over 150,000 traders. It’s coded in Pine Script v6 for full compatibility with TradingView’s latest capabilities.
🔗 Resources
• Tutorial: Learn how to analyze sessions like a pro in our TradingView guide:
"TradeCityPro Academy: Session Mapping & Liquidity Traps"
• More Tools: Explore our full library of indicators on

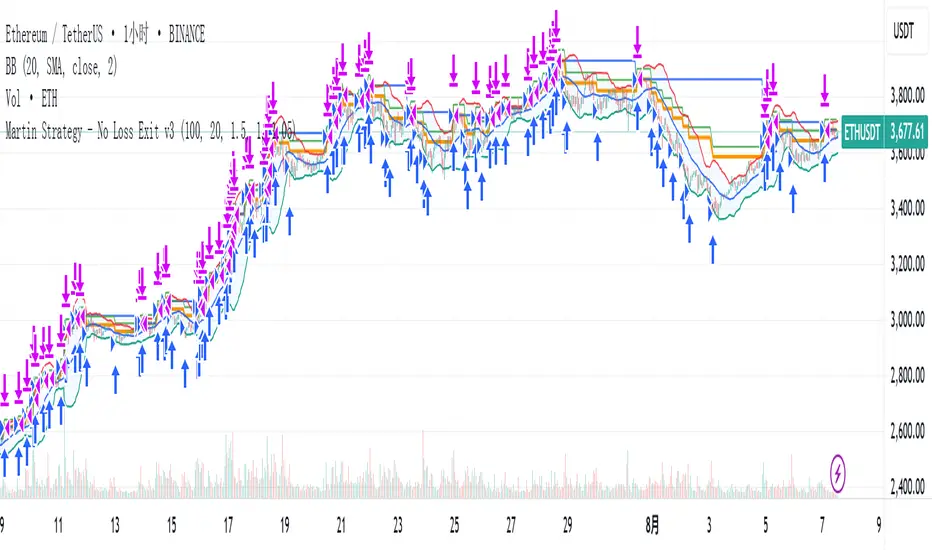
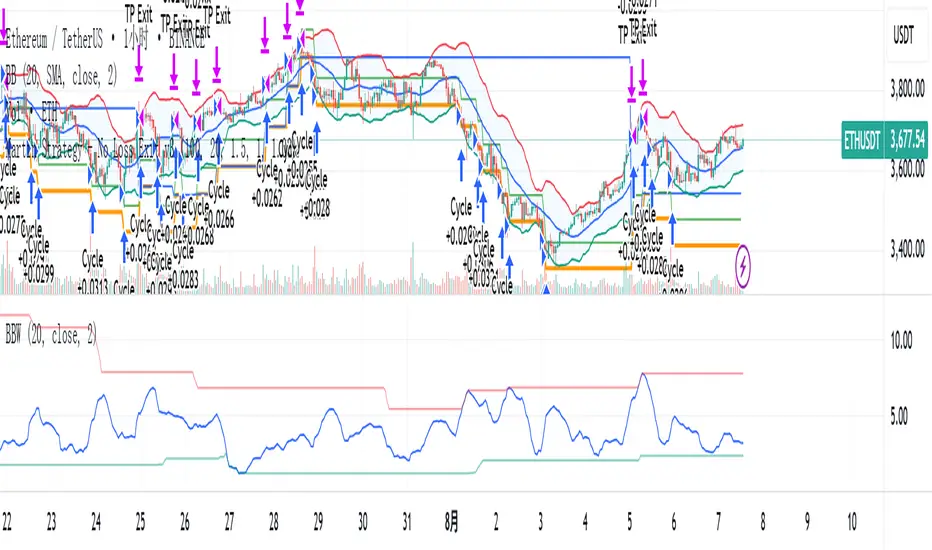
Martin Strategy - No Loss Exit v3Martin Strategy - No Loss Exit v3Martin Strategy - No Loss Exit v3Martin Strategy - No Loss Exit v3
Advance FVG with 3 EMAThis is a very powerful script and is an advanced version of Fair Value Gaps with powerful EMAs.

Martin Strategy - No Loss Exit v3Martin Strategy1.0 Martin Strategy1.0 Martin Strategy1.0 Martin Strategy1.0 Martin Strategy1.0 Martin Strategy1.0
StratNinjaTableAuthor’s Instructions for StratNinjaTable
Purpose:
This indicator is designed to provide traders with a clear and dynamic table displaying The Strat candle patterns across multiple timeframes of your choice.
Usage:
Use the input panel to select which timeframes you want to monitor in the table.
Choose the table position on the chart (top left, center, right, or bottom).
The table will update each bar, showing the candle type, direction arrow, and remaining time until the candle closes for each selected timeframe.
Hover over or inspect the table to understand current market structure per timeframe using The Strat methodology.
Notes:
The Strat pattern is displayed as "1", "2U", "2D", or "3" based on the relationship of current and previous candle highs and lows.
The timer updates in real-time and adapts to daily, weekly, monthly, and extended timeframes.
This script requires Pine Script version 6. Please use it on supported platforms.
MFI or other indicators are not included in this base version but can be integrated separately if desired.
Credits:
Developed and inspired by shayy110 — thanks for your foundational work on The Strat in Pine Script.
Disclaimer:
This script is for educational and informational purposes only. Always verify signals and manage risk accordingly.

RSI Label + OB-OS + BB Trend & Candle ColorA trend Bollinger Bands with Colored Candles and RSI label at the close, plus Over bought/Oversold RSI Labels on the candles.

Squeeze Momentum Regression Clouds [SciQua]╭──────────────────────────────────────────────╮
☁️ Squeeze Momentum Regression Clouds
╰──────────────────────────────────────────────╯
🔍 Overview
The Squeeze Momentum Regression Clouds (SMRC) indicator is a powerful visual tool for identifying price compression , trend strength , and slope momentum using multiple layers of linear regression Clouds. Designed to extend the classic squeeze framework, this indicator captures the behavior of price through dynamic slope detection, percentile-based spread analytics, and an optional UI for trend inspection — across up to four customizable regression Clouds .
────────────────────────────────────────────────────────────
╭────────────────╮
⚙️ Core Features
╰────────────────╯
Up to 4 Regression Clouds – Each Cloud is created from a top and bottom linear regression line over a configurable lookback window.
Slope Detection Engine – Identifies whether each band is rising, falling, or flat based on slope-to-ATR thresholds.
Spread Compression Heatmap – Highlights compressed zones using yellow intensity, derived from historical spread analysis.
Composite Trend Scoring – Aggregates directional signals from each Cloud using your chosen weighting model.
Color-Coded Candles – Optional candle coloring reflects the real-time composite score.
UI Table – A toggleable info table shows slopes, compression levels, percentile ranks, and direction scores for each Cloud.
Gradient Cloud Styling – Apply gradient coloring from Cloud 1 to Cloud 4 for visual slope intensity.
Weight Aggregation Options – Use equal weighting, inverse-length weighting, or max pooling across Clouds to determine composite trend strength.
────────────────────────────────────────────────────────────
╭──────────────────────────────────────────╮
🧪 How to Use the Indicator
1. Understand Trend Bias with Cloud Colors
╰──────────────────────────────────────────╯
Each Cloud changes color based on its current slope:
Green indicates a rising trend.
Red indicates a falling trend.
Gray indicates a flat slope — often seen during chop or transitions.
Cloud 1 typically reflects short-term structure, while Cloud 4 represents long-term directional bias. Watch for multi-Cloud alignment — when all Clouds are green or red, the trend is strong. Divergence among Clouds often signals a potential shift.
────────────────────────────────────────────────────────────
╭───────────────────────────────────────────────╮
2. Use Compression Heat to Anticipate Breakouts
╰───────────────────────────────────────────────╯
The space between each Cloud’s top and bottom regression lines is measured, normalized, and analyzed over time. When this spread tightens relative to its history, the script highlights the band with a yellow compression glow .
This visual cue helps identify squeeze zones before volatility expands. If you see compression paired with a changing slope color (e.g., gray to green), this may indicate an impending breakout.
────────────────────────────────────────────────────────────
╭─────────────────────────────────╮
3. Leverage the Optional Table UI
╰─────────────────────────────────╯
The indicator includes a dynamic, floating table that displays real-time metrics per Cloud. These include:
Slope direction and value , with historical Min/Max reference.
Top and Bottom percentile ranks , showing how price sits within the Cloud range.
Current spread width , compared to its historical norms.
Composite score , which blends trend, slope, and compression for that Cloud.
You can customize the table’s position, theme, transparency, and whether to show a combined summary score in the header.
────────────────────────────────────────────────────────────
╭─────────────────────────────────────────────╮
4. Analyze Candle Color for Composite Signals
╰─────────────────────────────────────────────╯
When enabled, the indicator colors candles based on a weighted composite score. This score factors in:
The signed slope of each Cloud (up, down, or flat)
The percentile pressure from the top and bottom bands
The degree of spread compression
Expect green candles in bullish trend phases, red candles during bearish regimes, and gray candles in mixed or low-conviction zones.
Candle coloring provides a visual shorthand for market conditions , useful for intraday scanning or historical backtesting.
────────────────────────────────────────────────────────────
╭────────────────────────╮
🧰 Configuration Guidance
╰────────────────────────╯
To tailor the indicator to your strategy:
Use Cloud lengths like 21, 34, 55, and 89 for a balanced multi-timeframe view.
Adjust the slope threshold (default 0.05) to control how sensitive the trend coloring is.
Set the spread floor (e.g., 0.15) to tune when compression is detected and visualized.
Choose your weighting style : Inverse Length (favor faster bands), Equal, or Max Pooling (most aggressive).
Set composite weights to emphasize trend slope, percentile bias, or compression—depending on your market edge.
────────────────────────────────────────────────────────────
╭────────────────╮
✅ Best Practices
╰────────────────╯
Use aligned Cloud colors across all bands to confirm trend conviction.
Combine slope direction with compression glow for early breakout entry setups.
In choppy markets, watch for Clouds 1 and 2 turning flat while Clouds 3 and 4 remain directional — a sign of potential trend exhaustion or consolidation.
Keep the table enabled during backtesting to manually evaluate how each Cloud behaved during price turns and consolidations.
────────────────────────────────────────────────────────────
╭───────────────────────╮
📌 License & Usage Terms
╰───────────────────────╯
This script is provided under the Creative Commons Attribution-NonCommercial 4.0 International License .
✅ You are allowed to:
Use this script for personal or educational purposes
Study, learn, and adapt it for your own non-commercial strategies
❌ You are not allowed to:
Resell or redistribute the script without permission
Use it inside any paid product or service
Republish without giving clear attribution to the original author
For commercial licensing , private customization, or collaborations, please contact Joshua Danford directly.

Multi-Tool Nasdaq US100 IndikatorA combination of several tools such as moving averages (EMA 50, 100, 200), Fibonacci retracements, pivot points, RSI (Relative Strength Index), order blocks, fair value gaps, supply and demand zones, and a simple volume profile.
The indicator is designed to enable high profitability by combining various established technical analysis approaches into one tool, facilitating decision-making regarding entry and exit points.
The script can be integrated and used directly in TradingView by creating a new indicator script and pasting the code there.

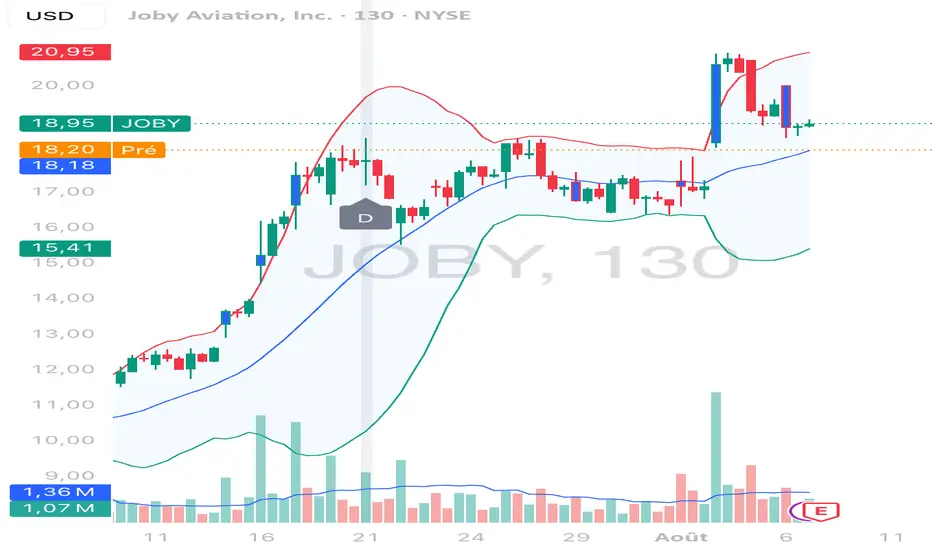
RS Ratio vs Benchmark (Colored)📈 RS Ratio vs Benchmark (with Color Change)
A simple but powerful tool to track relative strength against a benchmark like QQQ, SPY, or any other ETF.
🔍 What it Shows
RS Ratio (orange line): Measures how strong a stock is relative to a benchmark.
Moving Average (teal line): Smooths out RS to show trend direction.
Color-coded RS Line:
🟢 Green = RS is above its moving average → strength is increasing.
🔴 Red = RS is below its moving average → strength is fading.
📊 How to Read It
Above 100 = Stock is outperforming the benchmark.
Below 100 = Underperforming.
Rising & Green = Strongest signal — accelerating outperformance.
Above 100 but Red = Consolidating or losing momentum — potential rest period.
Crosses below 100 = Warning sign — underperformance.
✅ Best Uses
Spot leading stocks with strong momentum vs QQQ/SPY.
Identify rotation — when strength shifts between sectors.
Time entries and exits based on RS trends and crossovers.
