Custom Session ZonesCreate your own custom market session zones. Currently marks for Asia, London, NY, NY Open, ICT Silver Bullet AM/PM timings.
Indicators and strategies

Bot Superindicador v1.1This indicator was developed to complement automated trading systems, providing clear buy and sell signals based on technical criteria and trend analysis. It is useful for traders who want to visualize strategies directly on the chart.
Features:
Entry and exit signals based on momentum logic and moving averages.
Optimized for the BTC/USDT pair, but adaptable to other pairs.
Can be used as a base for webhook alert systems.

Palfrey Ltd: CBT Navigator Legacy🧭 How to Use the CBT Navigator Legacy Indicator
The CBT Navigator Legacy is designed to assist long-term Bitcoin holders with structured exit planning across the capital cycle. It overlays key price zones and ROI thresholds to help you manage conviction, de-risk responsibly, and navigate euphoric conditions with clarity.
🔹 Setup & Inputs
Average Entry: Input the average USD price at which you acquired your BTC position.
Cycle Peak Estimate: Set a hypothetical top for the current market cycle (e.g. $250,000).
Funding Rate Proxy: Enter a manually observed or estimated annualized funding rate (e.g. 0.12 for 12%).
🔹 What It Displays
The indicator renders horizontal lines at:
Sell Zone 1 (72% of peak): Early de-risking for disciplined capital preservation.
Sell Zone 2 (90% of peak): Start reducing core positions.
Sell Zone 3 (100% of peak): Near peak euphoria—high-risk environment.
Sell Zone Max (110% of peak): Blow-off top zone—exit remaining speculative exposure.
ROI Multiples (2x to 10x): Visualize profit multiples based on your entry price.
A small dashboard on-screen summarizes which zones price has entered and whether funding rates are elevated (above 10%).
🔹 How to Use It
Strategic Planning: Use the tool to define your sell zones before the market gets volatile.
Psychological Anchor: The visual zones provide a reference point when sentiment becomes irrational.
Non-Overfitting: It works without relying on live market data proxies or on-chain feeds—ideal for legacy views.
For deeper insights into how this framework fits into broader cycle structure, macro analysis, and risk models, refer to the articles at
📬 coinandcapital.substack.com

EBP mtf+fib (Nephew_Sam_)EBP (Engulfing Bar Pattern) Multi-Timeframe Indicator
This indicator identifies special engulfing bar patterns that take liquidity from previous candles, making it ideal for trading reversals and continuations. Unlike traditional engulfing patterns, this enhanced version requires the current candle to break the previous candle's extreme (high/low) before closing beyond its open.
Key Features:
• Multi-timeframe analysis (up to 6 timeframes)
• Customizable Fibonacci retracement levels
• Visual table showing active engulfing patterns
• Color-coded bars for easy pattern identification
• Optional timeframe labels on Fibonacci levels
Trading Strategy:
1. Identify EBP patterns on higher timeframes (HTF)
2. Use Fibonacci levels from the EBP candle for potential entries on lower timeframes
3. For bullish setups: Price breaks previous low then closes above previous open
4. For bearish setups: Price breaks previous high then closes below previous open
Perfect for traders looking to catch strong reversal moves or continuation patterns with clear entry points based on liquidity sweeps.

Trendlines with Breaks + Hull Suite + SuperTrendEntering after breaking or breaking the trend corresponding to the cloud and exit with changing the colour of the graduated line
الدخول بعد اختراق أو كسر الترند المطابق للسحابة والخروج مع تغيير لون الخط المتدرج

Trendlines with Breaks + Hull Suite + SuperTrend
الدخول بعد اختراق او كسر الترند المطابق للسحابه والخروج مع تغيير لون الخط المتدرج
Entering after breaking or breaking the trend corresponding to the cloud and exit with changing the colour of the graduated line

SHYY TFC SPX Sectors list This script provides a clean, configurable table displaying real-time data for the major SPX sectors, key indices, and market sentiment indicators such as VIX and the 10-year yield (US10Y).
It includes 16 columns with two rows:
* The top row shows the sector/asset symbol.
* The bottom row shows the most recent daily close price.
Each price cell is dynamically color-coded based on:
* Direction (green/red) during regular trading hours
* Separate colors during extended hours (pre-market or post-market)
* VIX values greater than 30 trigger a distinct background highlight
Users can fully control the position of the table on the chart via input settings. This flexibility allows traders to place the table in any screen corner or center without overlapping key price action.
The script is designed for:
* Monitoring broad market health at a glance
* Understanding sector performance in real-time
* Spotting risk-on/risk-off behavior (via SPY, QQQ, VIX, US10Y)
Unlike traditional watchlists, this table visually encodes directional movement and trading session context (regular vs. extended hours), making it highly actionable for intraday, swing, or macro-level analysis.
All data is pulled using `request.security()` on daily candles and uses pure Pine logic without external dependencies.
To use:
1. Add the indicator to your chart.
2. Adjust the table position via the input dropdown.
3. Read sector strength or weakness directly from the table.


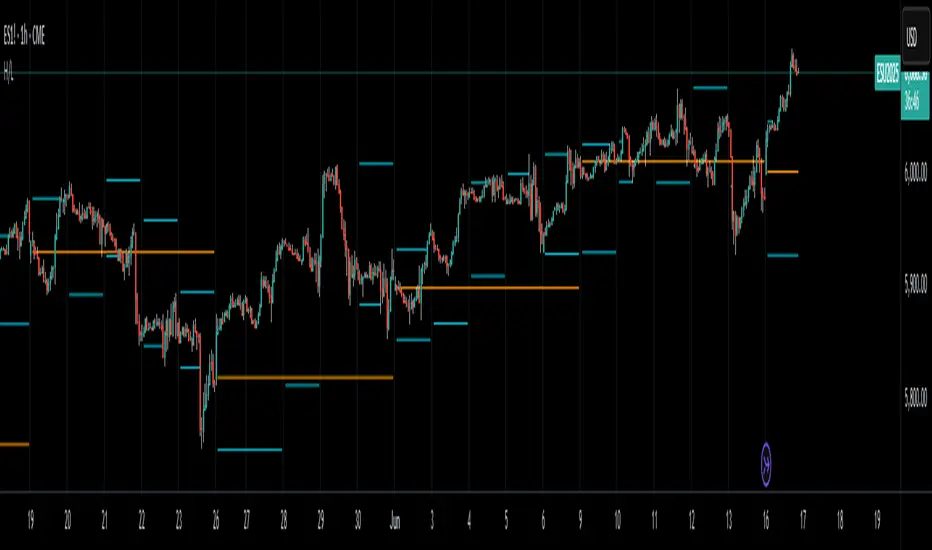
High/LowPrevious Day High/Low & Weekly Open Indicator
A clean and simple indicator that displays key reference levels for intraday trading.
Features:
Previous day's high and low levels
Current week's opening price
Auto-hides levels once broken (prevents clutter)
Resets automatically at the start of each trading day
No repainting - uses proper security function calls
How it works:
The indicator plots yesterday's high/low as horizontal lines on your chart. When price breaks above the previous day's high, that level disappears. Same for the low. This keeps your chart clean and shows only unbroken levels.
Perfect for:
Day traders using previous day's range as reference
Breakout trading strategies
Support/resistance analysis
Clean chart setup without manual level drawing
The cyan lines show previous day's high/low, while the orange line displays the weekly open. All levels use non-repainting data for reliable backtesting.
1-Min Change of State Buy/Sell SignalBuy & Sell Indicator. Calls a signal based on break of structure, momentum and trend

1-Min Change of State Buy/Sell SignalBuy & Sell Indicator. signals a trade based on BOS (Break of Structure), Momentum, and trend

ATR & Ticker + SMA Display (Table)Displays ATR with moving average of choice
Allows display by screen location and by selection of moving average type

RSI + 200 EMA Strategy🔹 Rules to follow (5-minute)
✅ Buy (Long) when:
➥ Price is above 200 EMA (uptrend).
➥ RSI drops below 30 (oversold) and then crosses back above 30.
➥ Ideally, you enter after the first green 5-minute candle following the RSI reversal.
✅ Sell (Short) when:
➥ Price is below 200 EMA (downtrend).
➥ RSI crosses above 70 (overbought) and then drops back below 70.
➥ Ideally, you enter after the first red 5-minute candle following the reversal.

Timeframe Resistance Evaluation And Detection - CoffeeKillerTREAD - Timeframe Resistance Evaluation And Detection Guide
🔔 Important Technical Limitation 🔔
**This indicator does NOT fetch true higher timeframe data.** Instead, it simulates higher timeframe levels by aggregating data from your current chart timeframe. This means:
- Results will vary depending on what chart timeframe you're viewing
- Levels may not match actual higher timeframe candle highs/lows
- You might miss important wicks or gaps that occurred between chart timeframe bars
- **Always verify levels against actual higher timeframe charts before trading**
Welcome traders! This guide will walk you through the TREAD (Timeframe Resistance Evaluation And Detection) indicator, a multi-timeframe analysis tool developed by CoffeeKiller that identifies support and resistance confluence across different time periods.(I am 50+ year old trader and always thought I was bad a teaching and explaining so you get a AI guide. I personally use this on the 5 minute chart with the default settings, but to each there own and if you can improve the trend detection methods please DM me. I would like to see the code. Thanks)
Core Components
1. Dual Timeframe Level Tracking
- Short Timeframe Levels: Tracks opening price extremes within shorter periods
- Long Timeframe Levels: Tracks actual high/low extremes within longer periods
- Dynamic Reset Mechanism: Levels reset at the start of each new timeframe period
- Momentum Detection: Identifies when levels change mid-period, indicating active price movement
2. Visual Zone System
- High Zones: Areas between long timeframe highs and short timeframe highs
- Low Zones: Areas between long timeframe lows and short timeframe lows
- Fill Coloring: Dynamic colors based on whether levels are static or actively changing
- Momentum Highlighting: Special colors when levels break during active periods
3. Customizable Display Options
- Multiple Plot Styles: Line, circles, or cross markers
- Flexible Timeframe Selection: Wide range of short and long timeframe combinations
- Color Customization: Separate colors for each level type and momentum state
- Toggle Controls: Show/hide different elements based on trading preference
Main Features
Timeframe Settings
- Short Timeframe Options: 15m, 30m, 1h, 2h, 4h
- Long Timeframe Options: 1h, 2h, 4h, 8h, 12h, 1D, 1W
- Recommended Combinations:
- Scalping: 15m/1h or 30m/2h
- Day Trading: 30m/4h or 1h/4h
- Swing Trading: 4h/1D or 1D/1W
Display Configuration
- Level Visibility: Toggle short/long timeframe levels independently
- Fill Zone Control: Enable/disable colored zones between levels
- Momentum Fills: Special highlighting for actively changing levels
- Line Customization: Width, style, and color options for all elements
Color System
- Short TF High: Default red for resistance levels
- Short TF Low: Default green for support levels
- Long TF High: Transparent red for broader resistance context
- Long TF Low: Transparent green for broader support context
- Momentum Colors: Brighter colors when levels are actively changing
Technical Implementation Details
How Level Tracking Works
The indicator uses a custom tracking function that:
1. Detects Timeframe Periods: Uses `time()` function to identify when new periods begin
2. Tracks Extremes: Monitors highest/lowest values within each period
3. Resets on New Periods: Clears tracking when timeframe periods change
4. Updates Mid-Period: Continues tracking if new extremes are reached
The Timeframe Limitation Explained
`pinescript
// What the indicator does:
short_tf_start = ta.change(time(short_timeframe)) != 0 // Detects 30m period start
= track_highest(open, short_tf_start) // BUT uses chart TF opens!
// What true multi-timeframe would be:
// short_tf_high = request.security(syminfo.tickerid, short_timeframe, high)
`
This means:
- On a 5m chart with 30m/4h settings: Tracks 5m bar opens during 30m and 4h windows
- On a 1m chart with same settings: Tracks 1m bar opens during 30m and 4h windows
- Results will be different between chart timeframes
- May miss important price action that occurred between your chart's bars
Visual Elements
1. Level Lines
- Short TF High: Upper resistance line from shorter timeframe analysis
- Short TF Low: Lower support line from shorter timeframe analysis
- Long TF High: Broader resistance context from longer timeframe
- Long TF Low: Broader support context from longer timeframe
2. Zone Fills
- High Zone: Area between long TF high and short TF high (potential resistance cluster)
- Low Zone: Area between long TF low and short TF low (potential support cluster)
- Regular Fill: Standard transparency when levels are static
- Momentum Fill: Enhanced visibility when levels are actively changing
3. Dynamic Coloring
- Static Periods: Normal colors when levels haven't changed recently
- Active Periods: Momentum colors when levels are being tested/broken
- Confluence Zones: Different intensities based on timeframe alignment
Trading Applications
1. Support/Resistance Trading
- Entry Points: Trade bounces from zone boundaries
- Confluence Areas: Focus on areas where short and long TF levels cluster
- Zone Breaks: Enter on confirmed breaks through entire zones
- Multiple Timeframe Confirmation: Stronger signals when both timeframes align
2. Range Trading
- Zone Boundaries: Use fill zones as range extremes
- Mean Reversion: Trade back toward opposite zone when price reaches extremes
- Breakout Preparation: Watch for momentum color changes indicating potential breakouts
- Risk Management: Place stops outside the opposite zone
3. Trend Following
- Direction Bias: Trade in direction of zone breaks
- Pullback Entries: Enter on pullbacks to broken zones (now support/resistance)
- Momentum Confirmation: Use momentum coloring to confirm trend strength
- Multiple Timeframe Alignment: Strongest trends when both timeframes agree
4. Scalping Applications
- Quick Bounces: Trade rapid moves between zone boundaries
- Momentum Signals: Enter when momentum colors appear
- Short-Term Targets: Use opposite zone as profit target
- Tight Stops: Place stops just outside current zone
Optimization Guide
1. Timeframe Selection
For Different Trading Styles:
- Scalping: 15m/1h - Quick levels, frequent updates
- Day Trading: 30m/4h - Balanced view, good for intraday moves
- Swing Trading: 4h/1D - Longer-term perspective, fewer false signals
- Position Trading: 1D/1W - Major structural levels
2. Chart Timeframe Considerations
**Important**: Your chart timeframe affects results
- Lower Chart TF: More granular level tracking, but may be noisy
- Higher Chart TF: Smoother levels, but may miss important price action
- Recommended: Use chart timeframe 2-4x smaller than short indicator timeframe
3. Display Settings
- Busy Charts: Disable fills, show only key levels
- Clean Analysis: Enable all fills and momentum coloring
- Multi-Monitor Setup: Use different color schemes for easy identification
- Mobile Trading: Increase line width for visibility
Best Practices
1. Level Verification
- Always Cross-Check: Verify levels against actual higher timeframe charts
- Multiple Timeframes: Check 2-3 different chart timeframes for consistency
- Price Action Confirmation: Wait for candlestick confirmation at levels
- Volume Analysis: Combine with volume for stronger confirmation
2. Risk Management
- Stop Placement: Use zones rather than exact prices for stops
- Position Sizing: Reduce size when zones are narrow (higher risk)
- Multiple Targets: Scale out at different zone boundaries
- False Break Protection: Allow for minor zone penetrations
3. Signal Quality Assessment
- Momentum Colors: Higher probability when momentum coloring appears
- Zone Width: Wider zones often provide stronger support/resistance
- Historical Testing: Backtest on your preferred timeframe combinations
- Market Conditions: Adjust sensitivity based on volatility
Advanced Features
1. Momentum Detection System
The indicator tracks when levels change mid-period:
`pinescript
short_high_changed = short_high != short_high and not short_tf_start
`
This identifies:
- Active level testing
- Potential breakout situations
- Increased market volatility
- Trend acceleration points
2. Dynamic Color System
Complex conditional logic determines fill colors:
- Static Zones: Regular transparency for stable levels
- Active Zones: Enhanced colors for changing levels
- Mixed States: Different combinations based on user preferences
- Custom Overrides: User can prioritize certain color schemes
3. Zone Interaction Analysis
- Convergence: When short and long TF levels approach each other
- Divergence: When timeframes show conflicting levels
- Alignment: When both timeframes agree on direction
- Transition: When one timeframe changes while other remains static
Common Issues and Solutions
1. Inconsistent Levels
Problem: Levels look different on various chart timeframes
Solution: Always verify against actual higher timeframe charts
2. Missing Price Action
Problem: Important wicks or gaps not reflected in levels
Solution: Use chart timeframe closer to indicator's short timeframe setting
3. Too Many Signals
Problem: Excessive level changes and momentum alerts
Solution: Increase timeframe settings or reduce chart timeframe granularity
4. Lagging Signals
Problem: Levels seem to update too slowly
Solution: Decrease chart timeframe or use more sensitive timeframe combinations
Recommended Setups
Conservative Approach
- Timeframes: 4h/1D
- Chart: 1h
- Display: Show fills only, no momentum coloring
- Use: Swing trading, position management
Aggressive Approach
- Timeframes: 15m/1h
- Chart: 5m
- Display: All features enabled, momentum highlighting
- Use: Scalping, quick reversal trades
Balanced Approach
- Timeframes: 30m/4h
- Chart: 15m
- Display: Selective fills, momentum on key levels
- Use: Day trading, multi-session analysis
Final Notes
**Remember**: This indicator provides a synthetic view of multi-timeframe levels, not true higher timeframe data. While useful for identifying potential confluence areas, always verify important levels by checking actual higher timeframe charts.
**Best Results When**:
- Combined with actual multi-timeframe analysis
- Used for confluence confirmation rather than primary signals
- Applied with proper risk management
- Verified against price action and volume
**DISCLAIMER**: This indicator and its signals are intended solely for educational and informational purposes. The timeframe limitation means results may not reflect true higher timeframe levels. Always conduct your own analysis and verify levels independently before making trading decisions. Trading involves significant risk of loss.


TAIndicatorsThis library offers a comprehensive suite of enhanced technical indicator functions, building upon TradingView's built-in indicators. The primary advantage of this library is its expanded flexibility, allowing you to select from a wider range of moving average types for calculations and smoothing across various indicators.
The core difference between these functions and TradingView's standard ones is the ability to specify different moving average types beyond the default. While a standard ta.rsi() is fixed, the rsi() in this library, for example, can be smoothed by an 'SMMA (RMA)', 'WMA', 'VWMA', or others, giving you greater control over your analysis.
█ FEATURES
This library provides enhanced versions of the following popular indicators:
Moving Average (ma): A versatile MA function that includes optional secondary smoothing and Bollinger Bands.
RSI (rsi): Calculate RSI with an optional smoothed signal line using various MA types, plus built-in divergence detection.
MACD (macd): A MACD function where you can define the MA type for both the main calculation and the signal line.
ATR (atr): An ATR function that allows for different smoothing types.
VWAP (vwap): A comprehensive anchored VWAP with multiple configurable bands.
ADX (adx): A standard ADX calculation.
Cumulative Volume Delta (cvd): Provides CVD data based on a lower timeframe.
Bollinger Bands (bb): Create Bollinger Bands with a customizable MA type for the basis line.
Keltner Channels (kc): Keltner Channels with selectable MA types and band styles.
On-Balance Volume (obv): An OBV indicator with an optional smoothed signal line using various MA types.
... and more to come! This library will be actively maintained, with new useful indicator functions added over time.
█ HOW TO USE
To use this library in your scripts, import it using its publishing link. You can then call the functions directly.
For example, to calculate a Weighted Moving Average (WMA) and then smooth it with a Simple Moving Average (SMA) :
import ActiveQuants/TAIndicators/1 as tai
// Calculate a 20-period WMA of the close
// Then, smooth the result with a 10-period SMA
= tai.ma("WMA", close, 20, "SMA", 10)
plot(myWma, color = color.blue)
plot(smoothedWma, color = color.orange)
█ Why Choose This Library?
If you're looking for more control and customization than what's offered by the standard built-in functions, this library is for you. By allowing for a variety of smoothing methods across multiple indicators, it enables a more nuanced and personalized approach to technical analysis. Fine-tune your indicators to better fit your trading style and strategies.

SuperTrend Adaptive (STD Smooth)Supertrend Adaptive (Smoothed StdDev)
Supertrend Adaptive is a refined trend-following indicator based on the classic Supertrend. It enhances the original by incorporating smoothed standard deviation into the volatility calculation, instead of relying solely on ATR. This hybrid approach enables more responsive and adaptive trend detection, reducing noise and false signals in volatile or ranging markets. The indicator also features confidence-weighted signal labels and a clean, uncluttered display, making it practical for any trading timeframe.
🔍 Detailed Methodology and Conceptual Foundation
Unlike traditional Supertrend indicators that use only absolute volatility (ATR) to define trend bands, this version blends standard deviation — a relative volatility measure — into the calculation. Standard deviation helps capture the dispersion of price, not just its range, and when smoothed, it filters out erratic jumps caused by sudden spikes or drops.
This fusion creates trend bands that expand and contract dynamically based on recent price variability. As a result:
Fewer whipsaws : The trend bands adjust to both low and high volatility environments, which helps avoid unnecessary signal flips during consolidation.
Stronger trend adherence : Signals are less reactive to momentary price movements. This allows the indicator to hold positions longer in trending markets, giving traders the opportunity to ride extended moves.
Bollinger Band-style adaptation : By including standard deviation, this indicator behaves similarly to Bollinger Bands — accounting for relative price change rather than absolute moves alone.
These enhancements make the tool suitable not only for identifying directional bias, but also for refining entries and exits with more context-aware volatility filtering.
📈 How to Use the Indicator
Trend Direction: The script draws a colored line beneath (uptrend) or above (downtrend) price. Green indicates bullish trend, red indicates bearish.
Buy/Sell Labels: Only the most recent signal is shown to reduce clutter:
🟢 Green "Buy" label = trend reversal to bullish, with strong confidence.
🔵 Blue "Buy" label = same reversal, but with lower volume confidence.
🔴 Red "Sell" label = trend reversal to bearish, with strong confidence.
🟠 Orange "Sell" label = bearish signal with lower volume confidence.
These color codes are derived from comparing current volume to its average — a higher-than-average volume gives greater confidence to the signal.
Settings:
ATR Period: Controls the smoothing window for volatility calculation.
ATR Multiplier: Adjusts the size of the trend bands.
Std Smooth: Controls smoothing applied to standard deviation to reduce jitter.
Change ATR Method: Option to toggle between default and smoothed ATR.
Show Signals: Toggle for label display.
📢 Alerts
The script includes three built-in alert conditions:
Buy Signal: Triggered when the trend flips to bullish.
Sell Signal: Triggered when the trend flips to bearish.
Trend Direction Change: Alerts on any switch in trend regardless of confidence level.
These alerts allow traders to automate notifications or integrations with bots or trading platforms.
🧼 Clean Chart Display
To ensure clarity and comply with best practices:
The chart shows only this indicator.
Trend lines are drawn in real time for visual context.
Only one label per direction is shown — the most recent one — to keep the chart readable.
No drawings or unrelated indicators are included.
This setup ensures the script’s signals and structure are immediately understandable at a glance.
📌 Best Use Cases
This tool is designed for:
Traders who want adaptive volatility filters instead of rigid ATR-based models.
Scalpers and swing traders who prefer clean charts with minimal lag and fewer false signals.
Any asset class — works well on crypto, FX, and equities.
Shortcoming of this tool is sideway price action (will be tackled in next versions).
Credit for www.tradingview.com the version which this script extends.

Futures Contract SizerThis script helps futures traders instantly calculate the ideal number of contracts to trade based on their desired dollar risk and tick stop-loss size. Whether you're trading micro contracts (e.g., MNQ, MES) or full-size contracts (e.g., NQ, ES), this tool takes the guesswork out of position sizing and risk management.

[ayogetit] Ultimate AVWAPsUltimate AVWAPs - Complete Multi-Timeframe AVWAP Suite
The Ultimate AVWAPs indicator combines eight essential Anchored Volume Weighted Average Price (AVWAP) levels in one clean tool, providing comprehensive support and resistance analysis across multiple timeframes.
Features:
Since Inception AVWAP
All-Time High/Low AVWAPs
16-Week High/Low AVWAPs
52-Week High/Low AVWAPs
Today's AVWAP
Best Performance:
Works exceptionally well on 1D charts for optimal multi-timeframe analysis. Also effective on shorter timeframes during regular trading hours.
Perfect for identifying key institutional levels, trend direction, and optimal entry/exit points without cluttering your chart with multiple individual AVWAP indicators.

Double Inside Body Candles with Box & Alert + 5-Bar LinesThis indicator identifies Double Inside Body Candle patterns, where:
Candle 1 is completely inside Candle 2,
Candle 2 is completely inside Candle 3 (the parent candle),
Candle 3 has a real body (not a doji or negligible body size).
Once the pattern is detected:
A label appears below the current candle.
A highlight box is drawn around Candle 3 (the parent candle) body range.
Horizontal lines are drawn from the top and bottom of Candle 3’s body and extend forward for exactly 5 bars to visualize potential breakout levels.
The script also detects and highlights breakouts:
🔼 Bullish breakout: if price closes above Candle 3's body high.
🔽 Bearish breakout: if price closes below Candle 3's body low.
Alerts are available for:
Double Inside Body pattern detection
Bullish breakout
Bearish breakout
Traders can use this script to identify consolidation periods (double inside bars), then monitor for breakout opportunities in either direction, using the 5-bar lines as short-term breakout levels.

Consolidation Zones[RanaAlgo]Overview
This indicator helps traders identify price consolidation zones (ranges) and potential breakouts in the market. It is useful for spotting periods of low volatility before significant price movements.
How It Works
Detects Consolidation Zones
Uses the ADX (Average Directional Index) to determine when the market is in a consolidation phase .
When ADX is below the threshold , the indicator marks the start of a consolidation zone.
Draws a semi-transparent box around the price range, adjusting its height as new highs/lows form.
Tracks Breakouts
When price breaks above/below the consolidation box, it signals a potential trend continuation.
Displays breakout arrows/labels (configurable shape & style) when price exits the range.
Visual Features
Boxes highlight consolidation areas (customizable color, border, and style).
Labels show real-time status ("CONSOLIDATING" or "TRENDING").
Breakout signals appear as arrows or shapes (up/down).
Usefulness in Trading
Range Trading: Helps traders identify sideways markets for buying low and selling high.
Breakout Trading: Signals potential trend entries when price exits consolidation.
Trend Confirmation: Low ADX + consolidation box = weak trend; breakout = possible trend start.
Example: If price stays in a blue box (consolidation) and then breaks above with an arrow, it suggests a bullish move.

ATR Ray Stop
A complementary tool designed to work with Jace's Chaos Theory Indicator for precise stop loss placement.
Input your identified zone edge level from the chaos theory analysis, and this indicator automatically calculates ATR-based stop loss levels above or below your level.
Customize the ATR multiplier, direction, and visual appearance to match your risk management strategy. Perfect for setting dynamic stops that account for market volatility while respecting key support and resistance zones.
Jace's Chaos Theory Indicator
