SMA 12+48The indicator checks the price entry into the 0.618-0.786 zone to the Fibonacci lines and gives a buy signal at the exit
Indicators and strategies

SMA 12+48The indicator checks the price entry into the 0.618-0.786 zone to the Fibonacci lines and gives a buy signal at the exit

ZKThe indicator checks the price entry into the 0.618-0.786 zone to the Fibonacci lines and gives a buy signal at the exit


Volume Based Analysis V 1.00
Volume Based Analysis V1.00 – Multi-Scenario Buyer/Seller Power & Volume Pressure Indicator
Description:
1. Overview
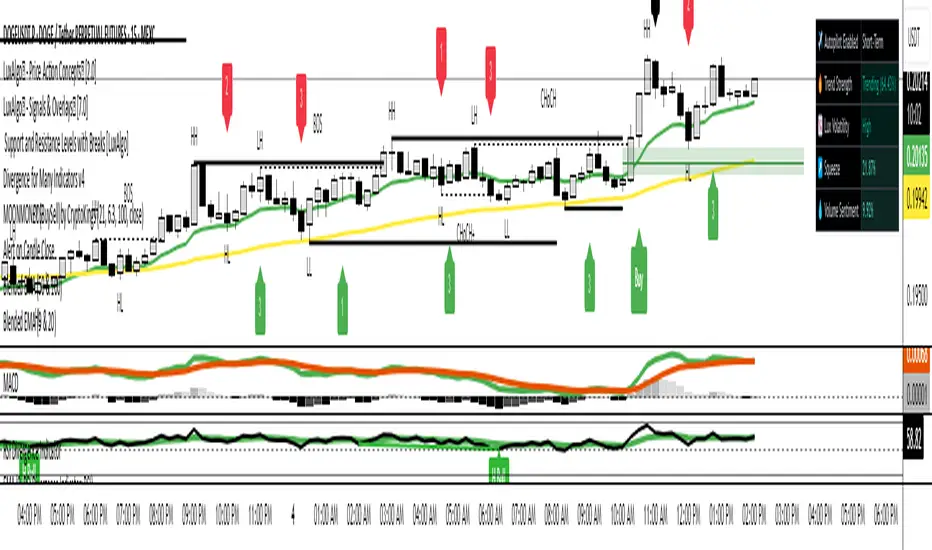
The Volume Based Analysis V1.00 indicator is a comprehensive tool for analyzing market dynamics using Buyer Power, Seller Power, and Volume Pressure scenarios. It detects 12 configurable scenarios combining volume-based calculations with price action to highlight potential bullish or bearish conditions.
When used in conjunction with other technical tools such as Ichimoku, Bollinger Bands, and trendline analysis, traders can gain a deeper and more reliable understanding of the market context surrounding each signal.
2. Key Features
12 Configurable Scenarios covering Buyer/Seller Power convergence, divergence, and dominance
Advanced Volume Pressure Analysis detecting when both buy/sell volumes exceed averages
Global Lookback System ensuring consistency across all calculations
Dominance Peak Module for identifying strongest buyer/seller dominance at structural pivots
Real-time Signal Statistics Table showing bullish/bearish counts and volume metrics
Fully customizable inputs (SMA lengths, multipliers, timeframes)
Visual chart markers (S01 to S12) for clear on-chart identification
3. Usage Guide
Enable/Disable Scenarios: Choose which signals to display based on your trading strategy
Fine-tune Parameters: Adjust SMA lengths, multipliers, and lookback periods to fit your market and timeframe
Timeframe Control: Use custom lower timeframes for refined up/down volume calculations
Combine with Other Indicators:
Ichimoku: Confirm volume-based bullish signals with cloud breakouts or trend confirmation
Bollinger Bands: Validate divergence/convergence signals with overbought/oversold zones
Trendlines: Spot high-probability signals at breakout or retest points
Signal Tables & Peaks: Read buy/sell volume dominance at a glance, and activate the Dominance Peak Module to highlight key turning points.
4. Example Scenarios & Suggested Images
Image #1 – S01 Bullish Convergence Above Zero
S01 activated, Buyer Power > 0, both buyer power slope & price slope positive, above-average buy volume. Show S01 ↑ marker below bar.
Image #2 – Combined with Ichimoku
Display a bullish scenario where price breaks above Ichimoku cloud while S01 or S09 bullish signal is active. Highlight both the volume-based marker and Ichimoku cloud breakout.
Image #3 – Combined with Bollinger Bands & Trendlines
Show a bearish S10 signal at the upper Bollinger Band near a descending trendline resistance. Highlight the confluence of the volume pressure signal with the band touch and trendline rejection.
Image #4 – Dominance Peak Module
Pivot low with green ▲ Bull Peak and pivot high with red ▼ Bear Peak, showing strong dominance counts.
Image #5 – Statistics Table in Action
Bottom-left table showing buy/sell volume, averages, and bullish/bearish counts during an active market phase.
5. Feedback & Collaboration
Your feedback and suggestions are welcome — they help improve and refine this system. If you discover interesting use cases or have ideas for new features, please share them in the script’s comments section on TradingView.
6. Disclaimer
This script is for educational purposes only. It is not financial advice. Past performance does not guarantee future results. Always do your own analysis before making trading decisions.
Tip: Use this tool alongside trend confirmation indicators for the most robust signal interpretation.

Blended EMA (50 & 100)Plots EMA 50, EMA 100, and a blended EMA (average of the two)
Option to hide/show the original EMAs
Clean and lightweight — great for trend filtering on 1hr/4hr

Blended EMA (9 & 20)Shows EMA 9, EMA 20, and their blended average
Toggle to hide/show the original EMAs
Clean, easy to read — ideal for entry setups on lower timeframes
Market Extension Quantifier SniperIt's a combination of ATR, Moving Average, Bollinger Bands and RSI. And the idea is to find a very extended move which creates a probability that the market is due to a reversion.

GMMG CCM SYSTEM HALMACCI INDICATOR BY KUYA NICKOOVERVIEW:
This script is about HALMACCI strategy based on Coach Miranda Miner System (CMM Systems of GMMG). It's an indicator to help traders decide when to enter and exit. This indicator uses Bollinger Band, EMA and ALMA with the length settings used by GMMG.
USAGE:
Apply the indicator to any chart. Best use in lower timeframes (Ex: 5m and 1m). You may use custom length settings but I suggest to stick with the default settings if you are using CMM System.
To enter LONG, If the CCI cross over -100 (shows a green dot when dot is enabled in style) and the EMA cross above ALMA (shows a green cross when cross is enabled in style). You may enter long. Strong confluence when it happens above the Bollinger Band and the candle closed above the Bollinger Band. You may exit when the CCI cross under -100 or immediate resistance.
To enter SHORT, If the CCI cross under 100 (shows a red dot when dot is enabled in style) and the EMA cross above ALMA (shows a red cross when cross is enabled in style). You may enter short. Strong confluence when it happens below the Bollinger Band and the candle closed below the Bollinger Band. You may exit when the CCI cross over 100 or immediate support.
Use may use alerts to catch breakout events so you would not need to monitor the chart continuously

15 Minute BangerThis strategy is for open market. 1:1 RR. It is based on market biased and will follow the trend of the market.
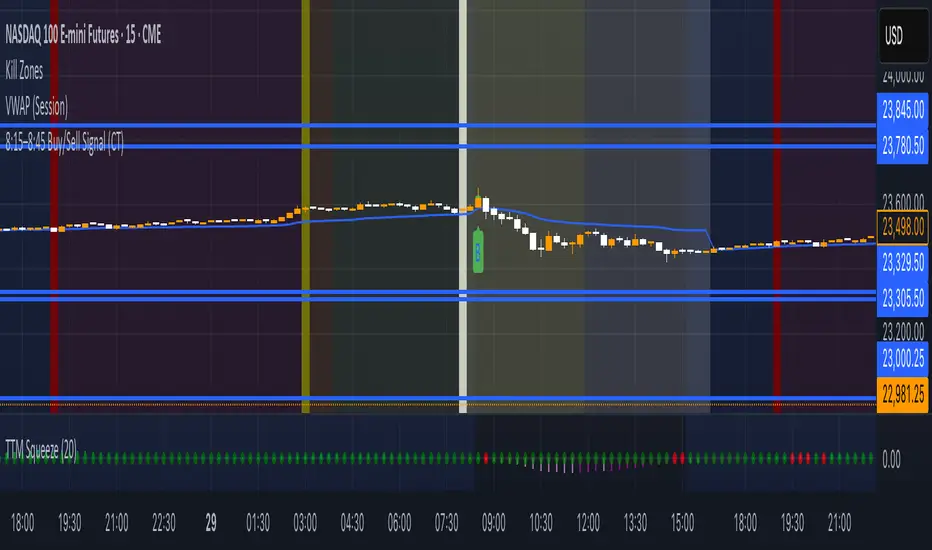
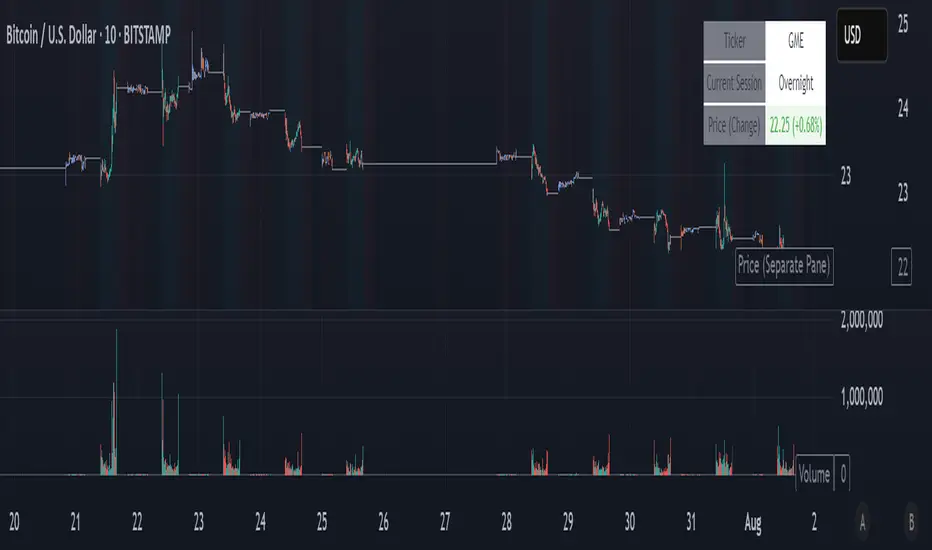
NightWatch 24/5 [theUltimator5]NightWatch 24/5 is a comprehensive indicator designed to seamlessly display both regular and overnight trading (BOATS exchange) into a single chart. Current TV limitations don't allow both overnight trading and regular exchanges to appear on the same chart due to timeframe visibility settings. We can either select between RTH (Regular Trading Hours) or ETH (Extended Trading Hours). There is no option to show 24 hour charts when looking at a stock. This indicator attempts to solve this issue.
Please read the entire description thoroughly because this indicator takes a little bit of setup to work properly!
---IMPORTANT-- -
This indicator MUST be used over a liquid cryptocurrency chart, like Bitcoin. It requires access to something that trades 24/7 and has volume data for all periods. Bitcoin on Coinbase is the best option. Please select Bitcoin as your main ticker before adding this indicator to the chart.
-------------------
This indicator combines the price of both the regular trading hours and the overnight trading to create a single price line and volume candles. You can select view settings to either overlay the price on the chart, or have it below the chart. Volume can be toggled on or off as well.
Default settings:
Ticker = GME
Overlay Candles on Main Chart = true
Display Data = Both Price and Volume
Show Status Table = true
Here is an explanation for each of these settings:
Ticker - Type in the ticker you want to track overnight and intraday data for
Overlay Candles on Main chart - This will push the price candles onto the main chart area instead of below it. Volume candles will remain in their own separate pane below. This is useful if you want to track both price and volume without adding the indicator twice.
Display Data - This determines what data to show. Volume, price, or both volume and price.
Show Status Table - This toggles on or off the table that shows the ticker name, current session, and the price (change) of the ticker since the most recent daily close.
If you overlay the price onto the chart, the price of the stock you are looking at will likely be a VERY different price than the crypto it is overlaying against. There are a couple workarounds. You can either zoom into the chart around the price of the stock you are looking at (time consuming), or you can go into your object tree and drag the indicator up into the main chart area. This will overlay the price onto the crypto while maintaining it's own unique y-axis.
After you move the indicator up, you can add the indicator back a second time, then change the settings to only show the volume candles. You can then toggle off the table on one of the two so you don't see duplicate tables. This is the setting I am showing in my chart above. The indicator is added twice with the price being pulled up into the same window as Bitcoin, then a second instance below showing just volume.
--LIMITATIONS--
Since the indicator requires the use of a 24 hour market ticker like Bitcoin, it DOES NOT display extended hours data. The price and volume data STOPS at 16:00 EST then resumes back up at 20:00 EST when BOATS opens. At 04:00, the price and volume then stops until 09:30, when the regular trading hours begin. This causes a flat line in the price during those periods. Unfortunately, there is no current workaround to this issue.
If Bitcoin becomes illiquid (or whatever crypto you choose), it will only populate data for the ticker you want if there is data available for that crypto at the same time period. A gap in Bitcoin volume will show a gap in trade activity for your ticker.
Smoothed RoC Z-Score IndicatorThis indicator calculates the rate of change (RoC) of price over a user-defined lookback period, then applies a double exponential smoothing (DEMA) and standardizes the result using a Z-Score. The output quantifies how extreme recent price momentum is compared to historical norms.
Key Features:
🔄 RoC Calculation: Measures momentum over the past n bars.
🧮 Z-Score Normalization: Detects statistical extremes and anomalies.
📉 Threshold Signals: Visual markers appear when Z-Score crosses user-defined upper or lower thresholds.
🎨 Elegant Visuals: Uses a clean purple/teal theme for enhanced clarity and style.
🔔 Alerts Included: Get notified when thresholds are crossed.
Use Cases:
Identify potential trend reversals or momentum spikes.
Spot overbought/oversold zones with greater sensitivity than traditional oscillators.
Combine with other indicators or strategies for confirmation.
Customizable Inputs:
RoC Lookback: Controls the momentum period.
Smooth Length: Applies double EMA smoothing.
Z-Score Length: Sets the statistical baseline.
Long/Short Thresholds: Define entry/exit sensitivity.

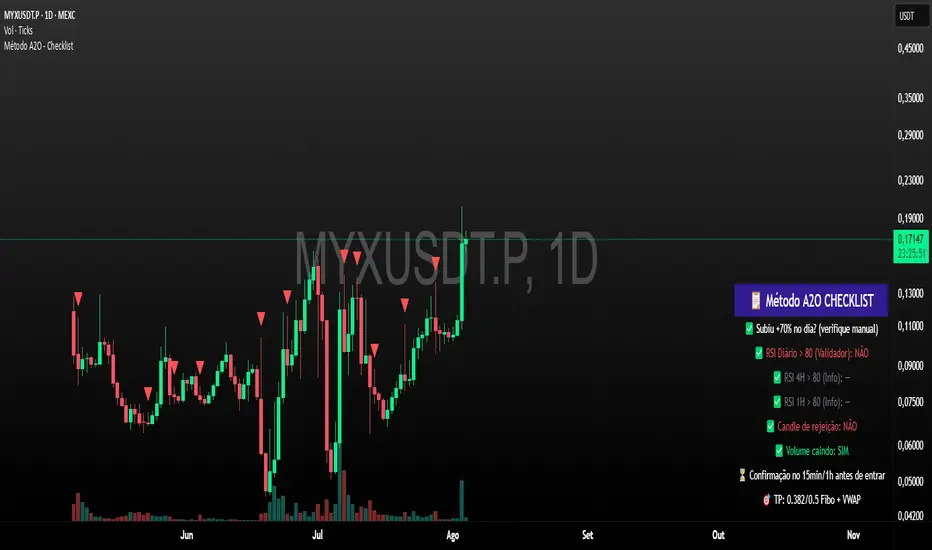
Método A2O - ChecklistAuxiliary tool for the A2O Method (SHORTSEASON). It should not be used in isolation, but rather as a complement.
Ferramenta auxiliar para o Método A2O (SHORTSEASON). Não deve ser utilizada de forma isolada, e sim complementar.
Benford's Law Actual [Tagstrading]Benford’s Law Chart — First Digit Analysis of Percentage Price Drops
This script visualizes the distribution of the leading digit in the percentage change of price drops, and compares it to the theoretical distribution expected by Benford’s Law.
It helps traders, analysts, and quants to detect anomalies, unnatural behavior, or price manipulation in any asset or timeframe.
How to Use
Add to any chart or symbol (stocks, crypto, FX, etc.) and select the timeframe you wish to analyze.
Set the “Number of Bars to Analyze” input (default: 500) to control the length of the historical window.
The chart will display, for the latest window:
A blue line: the actual leading-digit distribution for percentage price changes between bars.
A red line: the expected distribution per Benford’s Law.
Labels below and above: digit markers and the expected (theoretical) percentages.
Summary panel on the right: frequency counts and actual vs. theoretical % for each digit.
Interpretation:
If your actual (blue) curve or digit counts are significantly different from the red Benford’s Law curve, it could indicate unnatural price action, fraud, bot activity, or structural anomalies.
Why is this useful for TradingView?
Financial forensics: Benford’s Law is a classic tool for detecting data manipulation and fraud in accounting. On charts, it can reveal if price movements are statistically “natural.”
Transparency and confidence: Helps communities audit markets, brokers, or exchanges for irregularities.
Adaptable: Works on any market, any timeframe.
What makes this script unique?
Focuses on % price changes, not raw prices.
This provides a fair comparison across assets, symbols, and timeframes.
Measures only the direction and magnitude of drops/rises — more suitable for detecting manipulation in active markets.
Clear and customizable visualization:
The Benford line, actual data, and summary are all visible and readable in one glance.
Optimized for speed and clarity (runs efficiently on all major charts).
How is it different from stg44’s Benford’s Law script?
This script analyzes the leading digit of percentage price changes (i.e., how much the price drops or rises in %),
while the original by stg44 analyzes the leading digit of price itself.
Results are less sensitive to price scale and more comparable across volatile and non-volatile assets.
The summary panel clearly shows ( ) for actual and for Benford theoretical values.
Full code is commented and open for the community.
Credits and Inspiration
This script was inspired by “Benford’s Law” by stg44:
Thanks to the TradingView community for sharing powerful visual ideas.
—
By tags trading

SwingSignal RSI Overlay AdvancedSwingSignal RSI Overlay Advanced
By BFAS
This advanced indicator leverages the Relative Strength Index (RSI) to pinpoint critical market reversal points by highlighting key swing levels with intuitive visual markers.
Key Features:
Detects overbought and oversold levels with customizable RSI period and threshold settings.
Visually marks swing points:
Red star (HH) for Higher Highs.
Yellow star (LH) for Lower Highs.
Blue star (HL) for Higher Lows.
Green star (LL) for Lower Lows.
Connects swings with lines, aiding in the analysis of market structure.
Optimized for use on the main chart (overlay), tracking candles in real time.
This indicator provides robust visual support for traders aiming to identify price patterns related to RSI momentum, facilitating entry and exit decisions based on clear swing signals.

Blue Ocean BOATS 24/5 US Market DataThis script utilizes Blue Ocean's ATS (Alternative Trading System) and U.S. exchange market data to create a continuous candlestick chart. The continuous data has the option to be used as an indicator or strategy source.
Requirements
The main chart symbol (which can be unrelated to the user-input Ticker Symbol) needs to be a 24/7 chart. An example symbol is CRYPTO:BTCUSD. CME_MINI:ES1! and FX:SPX500 work too, but are not truly 24/5 and will miss ~4 hours of the total trading week from the extended U.S. session.
The main chart's timeframe needs to be intraday. Because the script's output is currently inconsistent on daily or higher timeframes, it will disable itself.
The Ticker Symbol chosen should be a ticker that is traded on U.S. exchanges. This will provide both U.S. extended session data and a BOATS equivalent.
Usage & configuration
This script visualizes the 24-hour Monday-Friday chart of a U.S. exchange ticker. Going a step further, it can be used to compare the performance indices or cryptocurrencies to stock constituents of indices, cryptocurrency treasury stocks or holding ETFs.
The script's output, candlesticks, can be overlaid on the main chart or used as is. A "Price Source" plot is used for indicators or strategies.
Ticker Symbol: The U.S. ticker you'd like to view extended session and Blue Ocean ATS session data for.
Price Source: Price source that can be used for indicators or strategies.
Highlight Sessions: Highlight the different trading sessions.
Last Price Line: Show a horizontal line at the last traded price.
Ticker Symbol Check: Plots a label that will display only if the selected Ticker Symbol is not detected as a U.S. exchange traded ticker.
Earnings Label: Creates a label at the time of past earnings of the chosen Ticker Symbol. The time that the earnings are plotted is approximate. Because of this, the label is meant as an explanation for price action.
What this script does and how it works
It creates OHLC candlesticks by merging Blue Ocean's ATS market data and U.S. exchange data. From the OHLC data of both, a single output can be used for indicators or strategies.
References and further information
www.tradingview.com
The Blue Ocean ATS allows trading from 20:00 to 4:00 Eastern Time, Sunday through Thursday. This critical timeframe bridges the eight-hour overnight gap when major U.S. exchanges are closed.
blueocean-tech.io
Blue Ocean ATS, LLC is a US broker dealer which operates the alternative trading system BOATS. Our trading platform offers electronic access, price discovery, compliant regulatory reporting requirements, and standard clearing and settlement processes.
www.nyse.com
Hours mentioned are in Eastern Time.
Overnight trading remains far less active than extended hours trading. The hour with the highest overnight volume is 9:00PM, which averages 2.94 million shares per day and coincides with several Asian market opens. This volume is a fraction of the last hour of extended hours trading, which averages 43.22 million shares. The first hour of pre-core reported volume averages 113.30 million shares per day.
Overnight executions, in addition to the peak in the 9:00PM hour, also exhibits a smaller peak at 3:00AM, of 2.35 million shares. This coincides with several Asian bourses’ end of their regular trading day.
Example of using the script in the main chart window and the difference in how RSI may be calculated.
Note: ATS is not the name of the 20:00 to 4:00 ET session itself, and the term refers to a broader definition of trading systems that include dark pools, which can be different.
24/5 Monday-Friday really means NY time Sunday night to Friday afternoon.

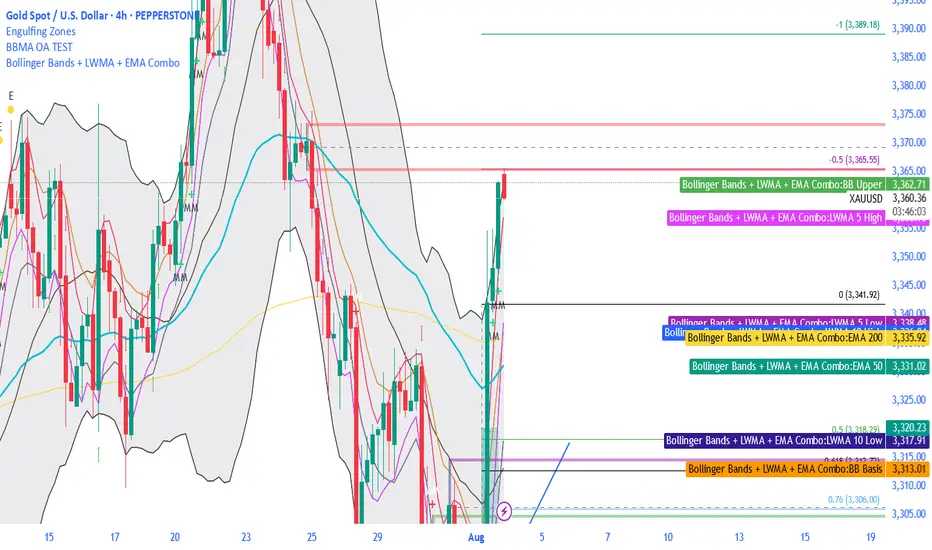
Bollinger Bands + LWMA + EMA ComboThe BBMA strategy from Omaly Ally, this contains all the MA 5/ 10 high and MA 5/ 10 low, it also has EMA 50, 100 and 200
NAS100 and gold Smart Scalping Strategy PRO [Enhanced v2]It works on both Gold, Platinum and USTEC100. Profit factor between 6-9. Great Profit making with risk management

BTC 5M Scalper: 3EMA Reversal v1.6 Lite by AIOBest Timeframe: 5 minutes!!
Optimal Asset: BTC/USDT (Bitcoin)
Stop Placement: Below the signal candle's low (for long) / Above the signal candle's high (for short)
Risk/Reward: Minimum 1:2 ratio recommended
Description:
This 3EMA Reversal strategy identifies trend continuation signals using:
Fast EMA (20) and Slow EMA (50) crossover
Volume confirmation (above 20-period average)
Engulfing candle pattern
Built-in stop loss and take profit levels
Usage Instructions:
Apply to BTC/USDT 5-minute chart
Enter long when green triangle appears (stop below signal candle)
Enter short when red triangle appears (stop above signal candle)
TP levels are automatically calculated based on your RR setting
Pro Tip: Combine with 1-hour trend analysis for better results. The strategy works best in trending markets with above-average volume.

Helper Lib by tristanlee85Library "helpers"
This library offers various functions and types based on the algorithmic
concepts as authored by ICT.
kv(key, value)
Returns a string of the key/value set, suitable for debug logging
Parameters:
key (string)
value (string)
Returns: A string formatted as "{key}: {value}"
kv(key, value)
Parameters:
key (string)
value (int)
kv(key, value)
Parameters:
key (string)
value (float)
kv(key, value)
Parameters:
key (string)
value (bool)
method enable(this, enable)
Enable/Disable debug logging
Namespace types: Debugger
Parameters:
this (Debugger)
enable (bool) : Set to `true` by default.
method group(this, label)
Creates a group label for nested debug() invocations
Namespace types: Debugger
Parameters:
this (Debugger)
label (string)
method groupEnd(this, label)
Ends the specified debug group
Namespace types: Debugger
Parameters:
this (Debugger)
label (string)
method log(this, s, arg1, arg2, arg3, arg4, arg5)
Logs the param values if debug mode is enabled
Namespace types: Debugger
Parameters:
this (Debugger)
s (string) : Title of the log message
arg1 (string)
arg2 (string)
arg3 (string)
arg4 (string)
arg5 (string)
method logIf(this, expr, s, arg1, arg2, arg3, arg4, arg5)
Same behavior as debug() except will only log if the passed expression is true
Namespace types: Debugger
Parameters:
this (Debugger)
expr (bool) : Boolean expression to determine if debug logs should be logged
s (string) : Title of the log message
arg1 (string)
arg2 (string)
arg3 (string)
arg4 (string)
arg5 (string)
style_getLineStyleFromType(opt)
Returns the corresponding line style constant for the given LineStyleType
Parameters:
opt (series LineStyleType) : The selected line style type
Returns: The Pine Script line style constant
style_getTextSizeFromType(opt)
Returns the corresponding text size constant for the given TextSizeType
Parameters:
opt (series TextSizeType) : The selected text size type
Returns: The Pine Script text size constant
style_getTextHAlignFromType(t)
Returns the corresponding horizontal text align constant for the given HAlignType
Parameters:
t (series HAlignType) : The selected text align type
Returns: The Pine Script text align constant
style_getTextVAlignFromType(t)
Returns the corresponding vertical text align constant for the given VAlignType
Parameters:
t (series VAlignType) : The selected text align type
Returns: The Pine Script text align constant
format_sentimentType(sentiment, pd)
Used to produce a string with the sentiment and PD array type (e.g., "+FVG")
Parameters:
sentiment (series SentimentType) : The sentiment value (e.g., SentimentType.BULLISH)
pd (series PDArrayType) : The price data array (e.g., PDArrayType.FVG)
Returns: A formatted string with the sentiment and PD array (e.g., "+FVG")
format_timeToString(timestamp)
Formats a UNIX timestamp into a date and time string based on predefined formats
Parameters:
timestamp (int) : The UNIX timestamp to format
Returns: A formatted string as "MM-dd (E) - HH:mm"
method init(this)
Initializes the session and validates the configuration. This MUST be called immediately after creating a new instance.
Namespace types: Session
Parameters:
this (Session) : The Session object reference
Returns: The Session object (chainable) or throws a runtime error if invalid
method isActive(this, _time)
Determines if the session is active based on the current bar time
Namespace types: Session
Parameters:
this (Session) : The Session object reference
_time (int)
Returns: `true` if the session is currently active; `false` otherwise
method draw(this)
Draws the line and optional label
Namespace types: LineLabel
Parameters:
this (LineLabel) : The LineLabel object reference
Returns: The LineLabel object (chainable)
method extend(this, x)
Extends the line and label right to the specified bar index
Namespace types: LineLabel
Parameters:
this (LineLabel) : The LineLabel object reference
x (int) : The bar index to extend to
Returns: The LineLabel object (chainable)
method destroy(this)
Removes the line and label from the chart
Namespace types: LineLabel
Parameters:
this (LineLabel) : The LineLabel object reference
isFVG(includeVI, barIdx)
Checks if the previous bars form a Fair Value Gap (FVG)
Parameters:
includeVI (bool) : If true, includes Volume Imbalance in the FVG calculation
barIdx (int) : The index of the bar to check from (default is 0 for the current bar)
Returns: A Gap object if a FVG is detected; otherwise, `na`
isVolumeImbalance(barIdx)
Checks if the previous bars form a Volume Imbalance (VI)
Parameters:
barIdx (int) : The index of the bar to check from (default is 0 for the current bar)
Returns: A Gap object if a VI is detected; otherwise, `na`
isLiquidityVoid(barIdx)
Checks if the previous bars form a Liquidity Void (LV)
Parameters:
barIdx (int) : The index of the bar to check from (default is 0 for the current bar)
Returns: A Gap object if an LV is detected; otherwise, `na`
isSwingPoint(barIdx)
Checks if the previous bars form a swing point
Parameters:
barIdx (int) : The index of the bar to check from (default is 0 for the current bar)
Returns: A SwingPoint object if a swing point is detected; otherwise, `na`
Debugger
A debug logging utility with group support
Fields:
enabled (series bool)
_debugGroupStack (array)
Session
Defines a trading session with a name and time range. When creating a new instance of this type, you MUST call init() immediately.
Fields:
name (series string) : A display-friendly name (e.g., "NY AM")
session (series string) : A string defining the session time range (e.g., "1300-1400")
enabled (series bool) : Optional flag for custom logic; defaults to false
start (series int) : UNIX time representing the session start (set via isActive())
end (series int) : UNIX time representing the session end (set via isActive())
_t (series int)
_start_HH (series float)
_start_mm (series float)
_end_HH (series float)
_end_mm (series float)
Gap
Represents a price inefficiency (gap) with details on sentiment and price levels
Fields:
type (series SentimentType) : The sentiment of the gap (e.g., SentimentType.BULLISH)
name (series string) : A display-friendly name (e.g., "+FVG")
startTime (series int) : UNIX time value for the gap's start
endTime (series int) : UNIX time value for the gap's end
startIndex (series int) : Bar index where the gap starts
endIndex (series int) : Bar index where the gap ends
gapLow (series float) : The lowest price level of the gap
gapHigh (series float) : The highest price level of the gap
ce (series float) : The consequent encroachment level of the gap
SwingPoint
Represents a swing point with details on type and price level
Fields:
type (series SwingPointType) : The type of swing point (e.g., SwingPointType.HIGH)
time (series int) : UNIX time value for the swing point
barIdx (series int) : Bar index where the swing point occurs
price (series float) : The price level of the swing point which is either the high or low of the middle bar
LineLabel
Combines a line and box type to produce a line with a label that is properly aligned
Fields:
x (series int) : The X-axis starting point as a bar index
y (series float) : The Y-axis starting point as the price level
color (series color) : Both the line and text color
width (series int) : Thickness of the line
label (series string) : Text to display
showLabel (series bool) : Boolean to conditionally show/hide the label (default is false)
lineStyle (series LineStyleType) : The style of the line
textSize (series TextSizeType)
_b (series box)
_l (series line)

Two assets correlation trackerHi, I made this simple script to see how two correlated assets are actually performing short-term. The idea comes from correlation between BTC and ETH that that usually stands 0.9 (Pearson's correlation). However Pearson's correlation doesn't indicate the relative price difference and cannot be used trading correlation when used alone.
My approach is simple - we can select the date/time from which we will start tracking the price change, and instead of tracking the price, we track 100 USD worth of BTC and ETH and how this investment perform. This gives us the price difference relative to a point in the near future, I would suggest using latest trend shift, for example.
On example of how this can be used: If we see that BTC is falling slower than ETH since trend shift, we can long BTC and short ETH in equal parts and expect to gain from the difference while hedging potential loss.

RSI Custom ADX VWAP Swing Signals Anmol Singh point.Anmol Singh
This indicator combines RSI, a custom ADX, VWAP, and Swing High/Low Break signals to identify potential buy and sell opportunities. It provides visual signals and alerts, helping traders spot trends and reversals more effectively on NASDAQ 1-minute charts.

TOMOs EMA (9, 20, 200) & VWAPThis indicator includes the 9, 20, 200 EMAs and VWAP all in one chart. best to be used on 1m, 5m, 1D timelines.
