3 EMA trong 1 NTT CAPITALThe 3 EMA in 1 NTT CAPITAL indicator provides an overview of the market trend with three EMAs of different periods, helping to identify entry and exit points more accurately, thus supporting traders in making quick and effective decisions.
Indicators and strategies

safa bot alertGood trading for everying and stuff that very gfood and stuff please let me puibisjertpa 9uihthsi fuckitgn code

CQ_[TACHIMETER]The Tachimeter Indicator: A Fun Financial Gauge
Visualizing Market Momentum in Real Time
Introduction
The Tachimeter is a playful and innovative indicator designed for those who enjoy observing the financial markets with a touch of excitement. Much like the tachometer in a car measures engine revolutions per minute, the Tachimeter measures the "revolutions" of money in the market — showing just how fast funds are moving in or out, every twenty seconds.
What Does the Tachimeter Show?
At its core, the Tachimeter displays how much money (in U.S. dollars) is shifting direction — either up or down — from the current price within a 20-second window. The indicator operates on a scale that starts at $0 (no significant movement) and extends to $1200, representing the maximum flow observed in each 20-second period.
• Scale: $0 to $1200 every 20 seconds
• Direction: Indicates if money is moving upwards (buying) or downwards (selling)
• Purpose: For entertainment and observation, not for actual trading decisions
Visual Design and Interpretation
The Tachimeter features a gauge reminiscent of a car’s tachometer. The gauge moves to show the current intensity of money flowing into or out of the market right now, providing an immediate sense of how "fast" buyers or sellers are acting.
• Gauge Indicator: The amount of squares shows the speed of ongoing transactions, just like a rev counter in a vehicle.
• Color-Coded Title: The title of the indicator switches colors based on the market’s relationship to the daily opening price:
• Red: When the current price is lower than the daily opening price, indicating downward momentum.
• Green: When the current price is higher than the daily opening price, signaling buying momentum.
How to Use the Tachimeter
This indicator is intended purely for fun — it gives you a rapid, visual sense of market activity, letting you "feel" the excitement of fluctuating prices. If you enjoy watching the markets move, the Tachimeter adds a dynamic, visceral element to your experience.
• Watch the needle twitch higher as heavy buying or selling takes place.
• Notice title color changes as the market sentiment shifts from bullish (green) to bearish (red), or vice versa.
• Use it as a conversation starter or to enhance your enjoyment of fast-paced trading sessions.
Final Thoughts
Like your car’s tachometer helps you sense when to shift gears, the Tachimeter lets you sense when the market is "revving up." It’s not a tool for serious decision-making, but it transforms raw financial data into an engaging, interactive visual — perfect for those who appreciate both finance and a bit of fun.
Enjoy watching the market’s RPMs!

Asian & London Session High/LowMarks out asian session high and low, aswell as london session high and low, this makes it easier for you to have crucial key levels on your chart at all times

TOT Strategy, The ORB Titan (Configurable)This is a strategy script adapted from Deniscr 's indicator script found here:
All feedback welcome!

EZThis script is designed to provide a clear, visual confirmation of trend direction, momentum shifts, and institutional bias by combining multiple EMA layers and smoothed Heiken Ashi waves.
Features:
• EMA Trend Band (8, 13, 21 EMA): Highlights short-term trend strength and clean stacking conditions.
• 35 EMA Momentum Line: Captures medium-term momentum shifts for better trade entries.
• 200 SMA Institutional Bias Line: Filters trades aligned with higher timeframe bias.
• Triple-Smoothed Heiken Ashi Waves: Changes background & candle colors to reflect momentum waves, filtering out noise and false signals.
• Liquidity Sweep Zones & Inverse FVGs (Optional): Helps identify smart money footprints and potential reversal zones.
Use Case:
• Best suited for trend-following traders, scalpers, and swing traders who rely on multi-timeframe confluence.
• Works effectively on Forex, Futures, Indices, and Crypto charts.
• Designed to filter out fakeouts and highlight high-probability trade zones.
Disclaimer:
This script is for educational purposes only. It does not guarantee profits and should be used in combination with proper risk management and trading experience.

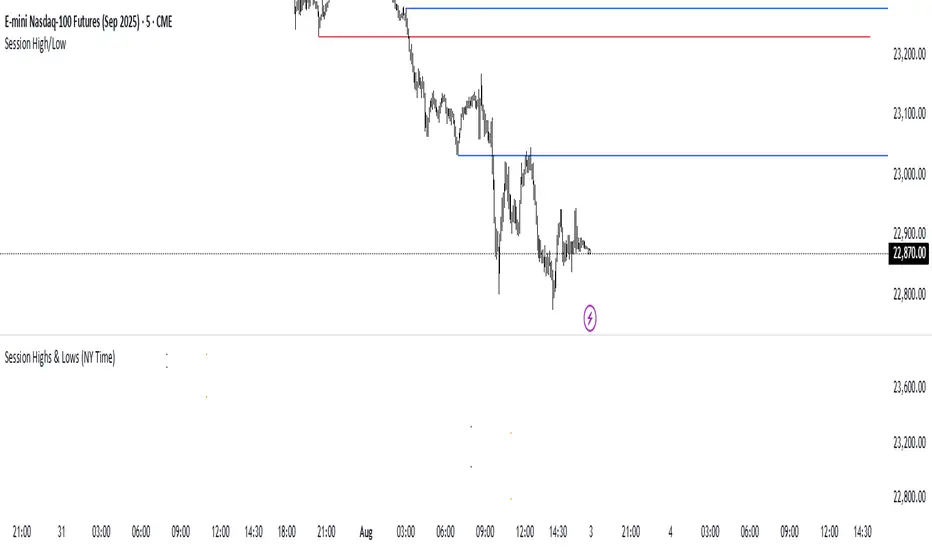
Session Highs & Lows (NY Time)Marks out Asian session high and low, and London session high and low, this makes it easier for you to easily marks out important highs and lows on the chart when trading.
AymaN Entry Signal – With HTF + Pin Bar + Multi TP + BE + V1Ayman Entry Signal – Indicator Description
Overview
Ayman Entry Signal – With HTF + Pin Bar + Multi TP + BE + Stats Panel (V1)
This is a professional-grade Pine Script indicator designed for scalping and intraday trading, with full trade management, multi-confirmation logic, and advanced visualization. The tool is ideal for traders focused on XAUUSD (Gold), Forex, and other volatile instruments who seek both precision entries and structured exits with dynamic risk control.
Main Features
Advanced Entry Logic:
- EMA fast/slow crossovers (configurable)
- Optional conditions: Break of Structure (BoS), Order Block (OB), Fair Value Gap (FVG), Liquidity sweeps, Pin Bars
- HTF confirmation using EMA or BoS
- Real-time entry condition display
Trade Management:
- Dynamic calculation of Entry, SL (with ATR buffer), TP1, TP2
- Supports Partial Close and Break Even logic after TP1
- Visual PnL label (dynamic and color-coded)
Statistics Panel:
- Shows total trades, win/loss/breakeven count, cumulative PnL
- Filter by custom date or session
- Fully customizable panel appearance
Trade Visualization:
- Trade box includes all trade levels (Entry, SL, TP1, TP2)
- Visual display of trade conditions and PnL result
- Option to keep previous trades on chart
Alert System:
- Alerts for Buy and Sell entries
- Compatible with webhook automation systems like MT5/MT4
Customization & Inputs
- Capital & risk per trade
- Value per pip/point
- SL buffer (ATR-based)
- Manual EMA override
- Enable/disable: EMA, BoS, OB, FVG, Liquidity, Pin Bars
- HTF: timeframe + confirmation logic
- Trade box/labels visibility
- Full color customization
- PnL label position: top, center, or bottom
Recommended Use
- Ideal for Gold scalping (XAUUSD), also effective for Forex
- Best on 1m–15m charts; use HTF confirmation from 15m–4H
- Pairs well with semi-automated systems using alerts and webhooks
Disclaimer
Note: This is a non-executing indicator. It does not place trades but provides visual and statistical guidance for professional manual or semi-automated trading.

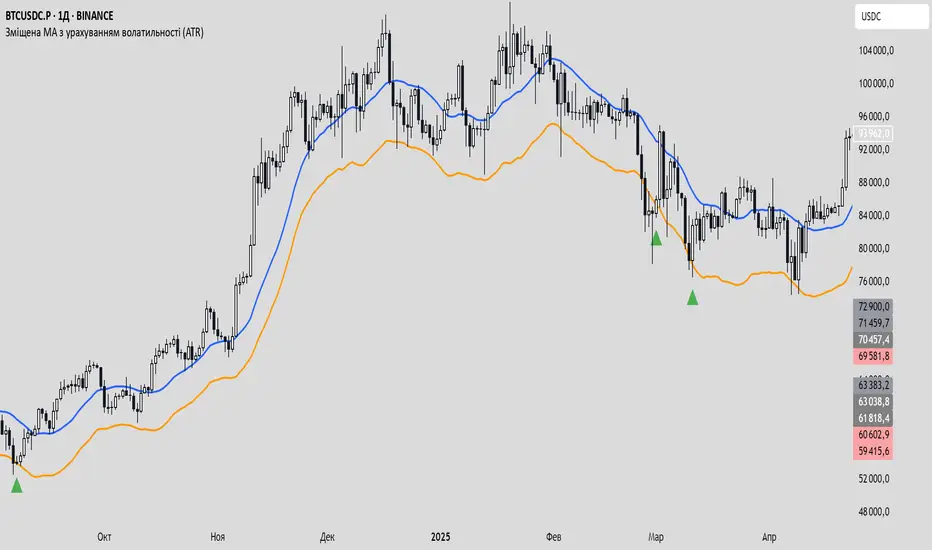
Зміщена MA з урахуванням волатильності (ATR)This is an experimental script designed to mark potential entry points for spot or long futures trades.
It uses a moving average (SMA or EMA) that is dynamically shifted downward based on current ATR (volatility). When the price crosses above this adjusted MA, a potential long entry signal is generated.
A stoploss line is plotted below the adjusted MA — offset
Zero Lag Moving AverageThis indicator is a trend detection tool that highlights significant momentum shifts with reduced lag. It uses two smoothed moving averages—fast and medium ZLEMAs—optionally enhanced with a Kalman filter to reduce noise. The indicator defines a bullish trend when the price is above both ZLEMAs, and bearish when it is below both. Rather than signaling every crossover, it focuses on trend changes, triggering buy or sell signals only when the trend flips (e.g., from bearish to bullish) and confirms those shifts with two filters: rising volume (above the 20-bar average) and a strong trend based on the ADX indicator. Visual features include optional candle coloring to reflect trend direction and signal markers (triangles) plotted only during a user-defined trading session. This setup helps traders act only on confirmed, high-quality momentum shifts, reducing false positives in low-volume or ranging markets.

EMA Cross Approach ScreenerWorks best on D/4H. Signals when the price of a stock is below the 200ema and the 9 and 20 are sloping up approaching the 200 while being 5% or less than from the 200. Helps the trader find a good buying point while keeping risk minimum.

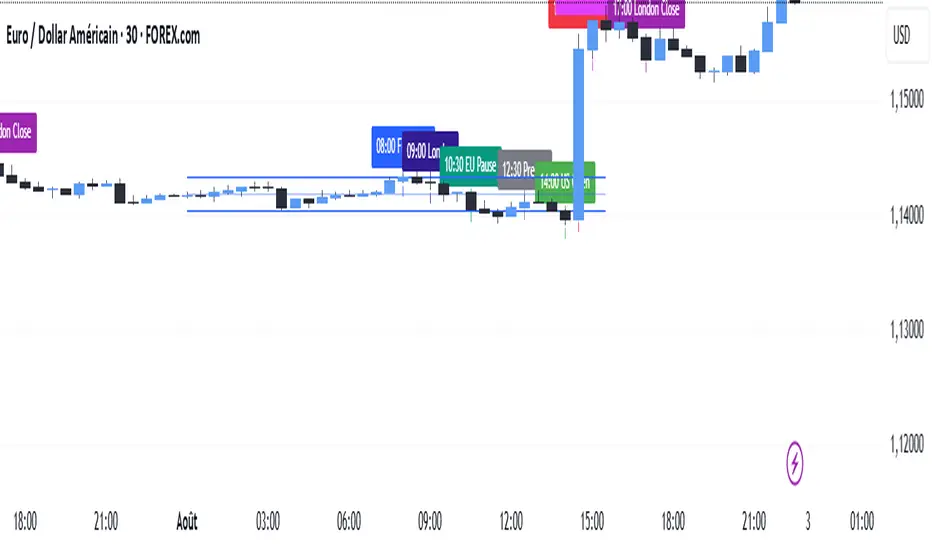
SMC TimingThis indicator (“SMC Timing”) visually marks the exact moments when the market typically experiences large liquidity injections—moments that often trigger strong directional moves. By plotting dashed vertical lines and labels at key session boundaries and news events (Frankfurt open, London open, EU mid-session pause, Pre-US, US open, 14:30 U.S. news releases, 15:00 breakout window, and the London close), it draws your attention to the times when stop-runs and institutional orders tend to pile into the market.
Traders can use these timing zones to:
Anticipate liquidity sweeps where smart-money often liquidates weak positions or hunts stops.
Plan higher-probability entries just before or directly after these injections, reducing slippage and improving execution.
Improve win-rate consistency by aligning your trades with the natural ebb and flow of institutional flow rather than fading it.
With customizable session toggles, a “today-only” filter, and a small vertical offset to keep markers clear of price bars, this tool seamlessly integrates into any chart. Positioning yourself around these highlighted times helps you capture the bulk of intraday moves and avoids getting caught in low-liquidity chop.
BERLIN-MAX 1V.5BERLIN-MAX 1V.5 is a comprehensive trading indicator designed for TradingView that combines multiple advanced strategies and tools. It integrates EMA crossover signals, UT Bot logic with ATR-based trailing stops, customizable stop-loss and target multipliers per timeframe, Hull Moving Averages with color-coded trends, linear regression channels for support and resistance, and a multi-timeframe RSI and volume signal table. This script aims to provide clear entry and exit signals for scalping and swing trading, enhancing decision-making across different market conditions.

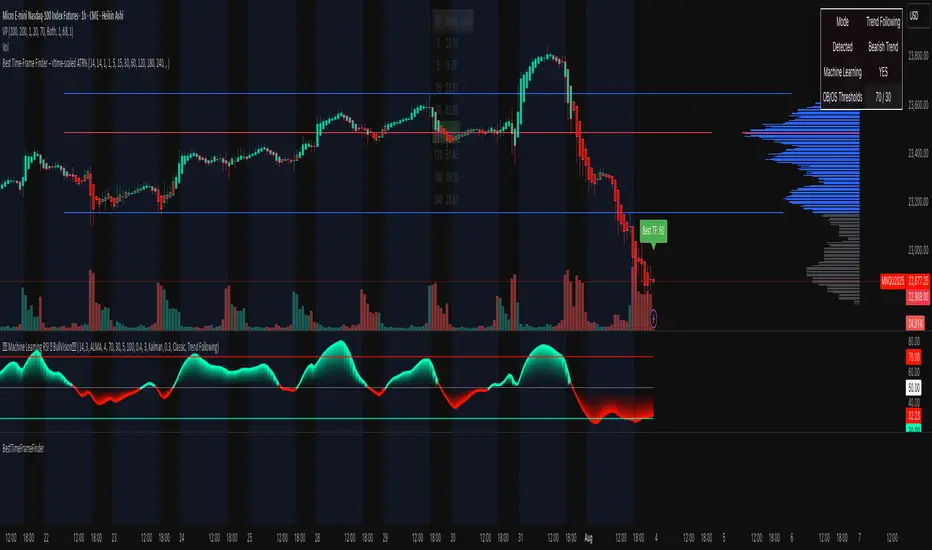
BestTimeFrameFinderLibrary "BestTimeFrameFinder"
adx(len)
Parameters:
len (simple int)
atrPercent(len)
Parameters:
len (simple int)
scaleFromTf(tf, atrWeight)
Parameters:
tf (string)
atrWeight (simple float)
scoreLocal(adxLen, atrLen, scale)
Parameters:
adxLen (simple int)
atrLen (simple int)
scale (simple float)
maxInArray(arr)
Parameters:
arr (array)
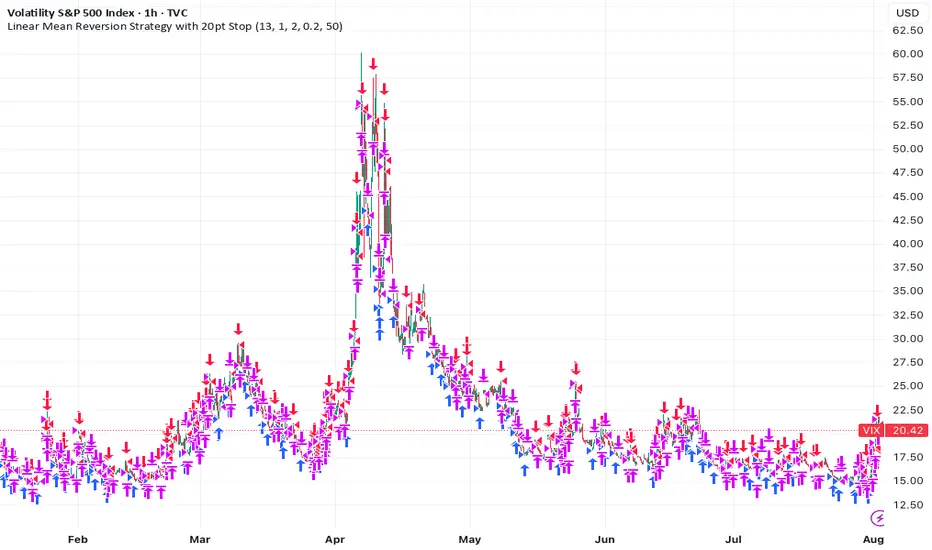
Linear Mean Reversion Strategy📘 Strategy Introduction: Linear Mean Reversion with Fixed Stop
This strategy implements a simple yet powerful mean reversion model that assumes price tends to oscillate around a dynamic average over time. It identifies statistically significant deviations from the moving average using a z-score, and enters trades expecting a return to the mean.
🧠 Core Logic:
A z-score is calculated by comparing the current price to its moving average, normalized by standard deviation, over a user-defined half-life window.
Trades are entered when the z-score crosses a threshold (e.g., ±1), signaling overbought or oversold conditions.
The strategy exits positions either when price reverts back near the mean (z-score close to 0), or if a fixed stop loss of 100 points is hit, whichever comes first.
⚙️ Key Features:
Dynamic mean and volatility estimation using moving average and standard deviation
Configurable z-score thresholds for entry and exit
Position size scaling based on z-score magnitude
Fixed stop loss to control risk and avoid prolonged drawdowns
🧪 Use Case:
Ideal for range-bound markets or assets that exhibit stationary behavior around a mean, this strategy is especially useful on assets with mean-reverting characteristics like currency pairs, ETFs, or large-cap stocks. It is best suited for traders looking for short-term reversions rather than long-term trends.
Entry HelperEntry Helper is a precision tool designed to enhance clarity and support decision-making in fast-paced trading environments.
It adapts intelligently to different timeframes, offering visual guidance based on your chosen context — without the need to manually adjust settings.
Specially optimized for scalping assets like XAUUSD, NASDAQ, and SP500, it delivers exactly what you need, when you need it.
⚡ Just switch the chart… and it adjusts itself.
Developed by WAKEUP | Maggifx

Central Pivot Range DWMCentral pivot range with camarilla cpr along with previous day high low
you can use the indicator for daily weekly monthly and future ranges
change the setting to get your desire ranges

Buy Sell Sniper Entry Background (based on EP Script by RedK)
Is this one of the most precise Buy Sell Indicators?
Only you can tell!
Based on the EP script by RedK EVEREX this indicator will color your background directly in your chart. Clean, easy, simple.
I did not alter any of their logic, nothing.
Looking for an even more precise entry option?
How about combining it with my first Background Indicator based on Williams Alligator.
The Candle coloring is based on this TUE ADX script
Happy Sniper Trading!

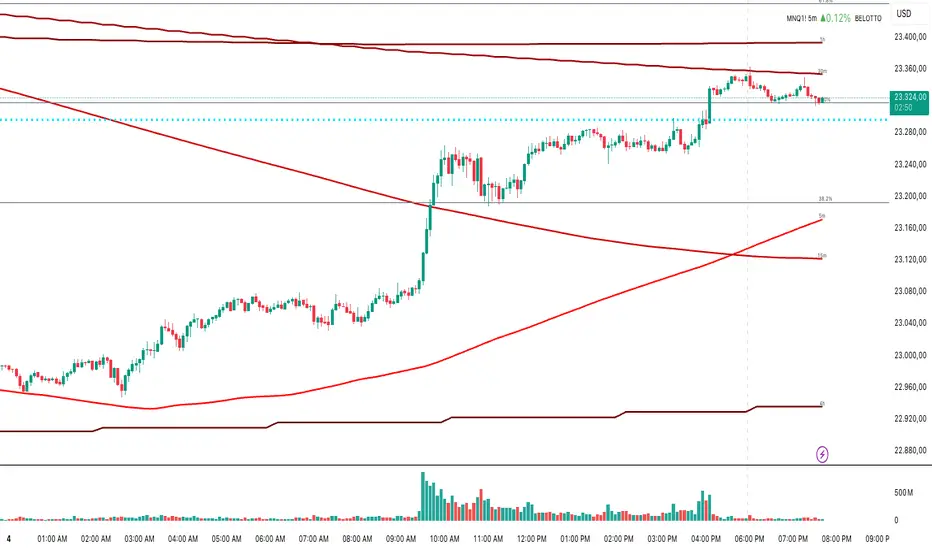
Multi-Timeframe MA 200Multi-Timeframe MA 200
This powerful tool plots the 200-period Moving Average across multiple timeframes (5m, 15m, 30m, 1h, 4h, Daily) directly on your active chart. You can switch between SMA (Simple Moving Average) and EMA (Exponential Moving Average) for all timeframes at once.
Key features:
✅ 100% accurate calculation using the original timeframe
✅ Option to choose SMA or EMA
✅ Visual smoothing for cleaner display
✅ Floating labels showing the origin timeframe
✅ Clean interface – no clutter or legends
✅ Ideal for scalping, intraday, and swing traders
Developed by BELOTTO TRADER, founder of the CLUBE DO GAIN – one of the most engaged trading communities in the Portuguese-speaking world.
Time-Price Velocity [QuantAlgo]🟢 Overview
The Time-Price Velocity indicator uses advanced velocity-based analysis to measure the rate of price change normalized against typical market movement, creating a dynamic momentum oscillator that identifies market acceleration patterns and momentum shifts. Unlike traditional momentum indicators that focus solely on price change magnitude, this indicator incorporates time-weighted displacement calculations and ATR normalization to create a sophisticated velocity measurement system that adapts to varying market volatility conditions.
This indicator displays a velocity signal line that oscillates around zero, with positive values indicating upward price velocity and negative values indicating downward price velocity. The signal incorporates acceleration background columns and statistical normalization to help traders identify momentum shifts and potential reversal or continuation opportunities across different timeframes and asset classes.
🟢 How It Works
The indicator's key insight lies in its time-price velocity calculation system, where velocity is measured using the fundamental physics formula:
velocity = priceChange / timeWeight
The system normalizes this raw velocity against typical price movement using Average True Range (ATR) to create market-adjusted readings:
normalizedVelocity = typicalMove > 0 ? velocity / typicalMove : 0
where "typicalMove = ta.atr(lookback)" provides the baseline for normal price movement over the specified lookback period.
The Time-Price Velocity indicator calculation combines multiple sophisticated components. First, it calculates acceleration as the change in velocity over time:
acceleration = normalizedVelocity - normalizedVelocity
Then, the signal generation applies EMA smoothing to reduce noise while preserving responsiveness:
signal = ta.ema(normalizedVelocity, smooth)
This creates a velocity-based momentum indicator that combines price displacement analysis with statistical normalization, providing traders with both directional signals and acceleration insights for enhanced market timing.
🟢 How to Use
1. Signal Interpretation and Threshold Zones
Positive Values (Above Zero): Time-price velocity indicating bullish momentum with upward price displacement relative to normalized baseline
Negative Values (Below Zero): Time-price velocity indicating bearish momentum with downward price displacement relative to normalized baseline
Zero Line Crosses: Velocity transitions between bullish and bearish regimes, indicating potential trend changes or momentum shifts
Upper Threshold Zone: Area above positive threshold (default 1.0) indicating strong bullish velocity and potential reversal point
Lower Threshold Zone: Area below negative threshold (default -1.0) indicating strong bearish velocity and potential reversal point
2. Acceleration Analysis and Visual Features
Acceleration Columns: Background histogram showing velocity acceleration (the rate of change of velocity), with green columns indicating accelerating velocity and red columns indicating decelerating velocity. The interpretation depends on trend context: red columns in downtrends indicate strengthening bearish momentum, while red columns in uptrends indicate weakening bullish momentum
Acceleration Column Height: The height of each column represents the magnitude of acceleration, with taller columns indicating stronger acceleration or deceleration forces
Bar Coloring: Optional price bar coloring matches velocity direction for immediate visual trend confirmation
Info Table: Real-time display of current velocity and acceleration values with trend arrows and change indicators
3. Additional Features:
Confirmed vs Live Data: Toggle between confirmed (closed) bar analysis for stable signals or current bar inclusion for real-time updates
Multi-timeframe Adaptability: Velocity normalization ensures consistent readings across different chart timeframes and asset volatilities
Alert System: Built-in alerts for threshold crossovers and direction changes
🟢 Examples with Preconfigured Settings
Default : Balanced configuration suitable for most timeframes and general trading applications, providing optimal balance between sensitivity and noise filtering for medium-term analysis.
Scalping : High sensitivity setup with shorter lookback period and reduced smoothing for ultra-short-term trades on 1-15 minute charts, optimized for capturing rapid momentum shifts and frequent trading opportunities.
Swing Trading : Extended lookback period with enhanced smoothing and higher threshold for multi-day positions, designed to filter market noise while capturing significant momentum moves on 1-4 hour and daily timeframes.

Power candle_v3.......Power candle_v3................Power candle_v3................Power candle_v3................Power candle_v3................Power candle_v3................Power candle_v3................Power candle_v3................Power candle_v3................Power candle_v3................Power candle_v3................Power candle_v3................Power candle_v3................Power candle_v3................Power candle_v3................Power candle_v3.........

トレンドフォローBUY&SELL ver1.1Indicator Description
This indicator displays three moving averages (MAs) and generates buy and sell signals based on their crossovers. It’s designed to help traders easily follow the trend and avoid counter-trend trades.
1. Three Moving Averages
MA1 (Default: 7) – Short-term trend (Yellow)
MA2 (Default: 50) – Medium-term trend (Blue)
MA3 (Default: 200) – Long-term trend (Red), also used as a filter
2. Signal Types
(A) MA1 and MA3 Crossovers (Yellow Signals)
Golden Cross (BUY): MA1 crosses above MA3
Dead Cross (SELL): MA1 crosses below MA3
→ Helps identify shifts between short-term and long-term trends.
(B) MA1 and MA2 Crossovers (Green & Red Signals)
BUY (Green): MA1 and MA2 cross, and both are above MA3
SELL (Red): MA1 and MA2 cross, and both are below MA3
→ Only trend-aligned signals are shown (buy only above MA3, sell only below MA3).
(C) Gray Signals (Filtered-Out Signals)
If MA1 and MA2 cross but don’t meet the MA3 condition, a gray signal is displayed.
Example: “BUY” below MA3 or “SELL” above MA3 appears as gray.
→ This feature is ON by default but can be turned OFF in the settings.
3. Alerts
Alerts can be triggered for:
MA1 × MA3 Golden Cross / Dead Cross
MA1 × MA2 BUY / SELL (with MA3 filter)
This allows you to receive notifications when valid trade setups occur.
4. Key Benefits
Visualize short-, medium-, and long-term trends at the same time
Trade only in the direction of the 200MA trend using the built-in filter
Optionally view filtered-out (gray) signals for extra context
Set alerts to avoid missing trading opportunities
With this indicator, you can focus on trading with the trend—buying above the 200MA and selling below it—while staying informed of all crossover events.
このインジケーターは 3本の移動平均線(MA) と、
それらのクロスに基づいた 売買シグナル を表示するツールです。
1. 3本の移動平均線
MA1(デフォルト7):短期のトレンドを把握するための線(黄色)
MA2(デフォルト50):中期のトレンドを把握するための線(青)
MA3(デフォルト200):長期のトレンド(赤)。フィルターとしても使用
2. シグナルの種類
(A) MA1とMA3のクロス(黄色シグナル)
ゴールデンクロス(BUY):MA1がMA3を上抜け
デッドクロス(SELL):MA1がMA3を下抜け
→ 長期トレンドと短期の変化を確認するための参考シグナル
(B) MA1とMA2のクロス(緑・赤シグナル)
BUY(緑):MA1とMA2がクロスし、両方がMA3より上にある
SELL(赤):MA1とMA2がクロスし、両方がMA3より下にある
→ 200MAを基準に「上なら買い、下なら売り」のトレンド方向に沿ったシグナルだけを表示
(C) グレーシグナル(フィルター除外)
MA1とMA2がクロスしたが、MA3の条件を満たさなかった場合にグレー表示
例えば「MA3より下でBUY」「MA3より上でSELL」はグレー
→ 初期設定ではONになっていますが、オフにすることも可能
逆張りの指標や、トレンド転換のサインにもなる
3. アラート機能
MA1×MA3のゴールデンクロス/デッドクロス
MA1×MA2のBUY/SELL(MAフィルターあり)
→ これらが発生したタイミングでTradingViewのアラートを出せる
4. 使い方のポイント
短期・中期・長期のトレンドを同時に把握できる
200MAを基準にフィルターすることで「逆張りシグナル」を排除
フィルターで外れたシグナルもグレーで確認できる(任意)
アラートを設定すれば、チャンスを逃さずにエントリー可能
このインジケーターを使うことで、「200MAの上では買いのみ」「下では売りのみ」というシンプルでトレンドに沿ったトレードができるようになります。
