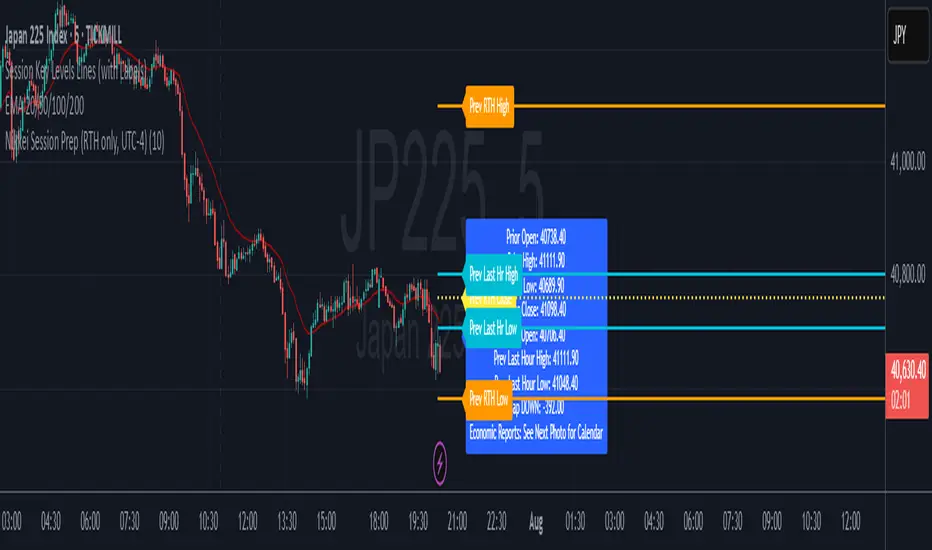
Nikkei Session Key Levels Lines (with Labels) - Nikkei CFDThis is Nikkei Session Key Levels Lines (with Labels) - Nikkei CFD. shows you all the key level lines that you need to be aware. hope it helps :)
Indicators and strategies

Nikkei Premarket High/Low LabelThis is Nikkei Premarket High/Low Label. shows you the premarket high and low. hope it helps :)
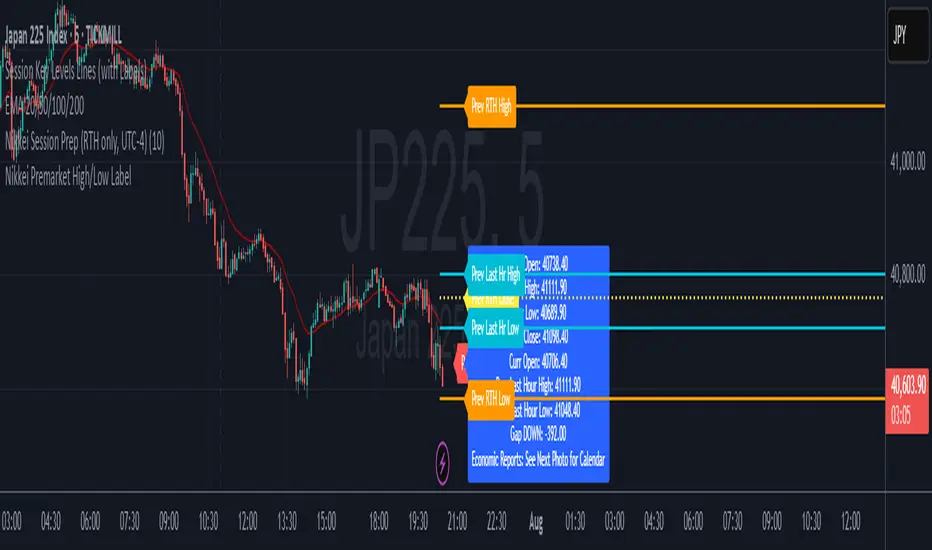
Nikkei Session Prep (RTH only, UTC-4)This is Nikkei Session Prep (RTH only, UTC-4). hope it helps :)
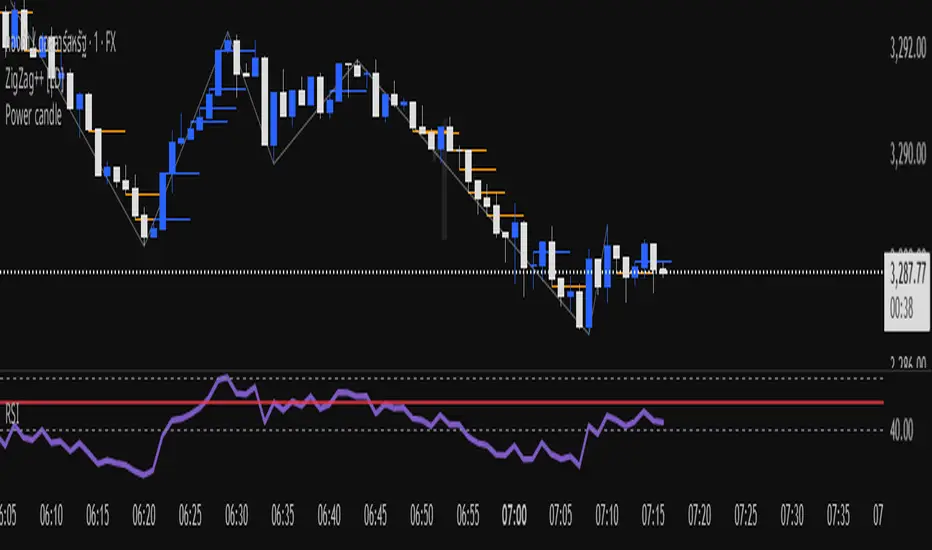
Power candlePower candle --------------------------Power candle --------------------------Power candle --------------------------Power candle --------------------------Power candle --------------------------Power candle --------------------------Power candle --------------------------Power candle --------------------------Power candle --------------------------Power candle --------------------------Power candle --------------------------Power candle --------------------------Power candle --------------------------Power candle --------------------------Power candle --------------------------
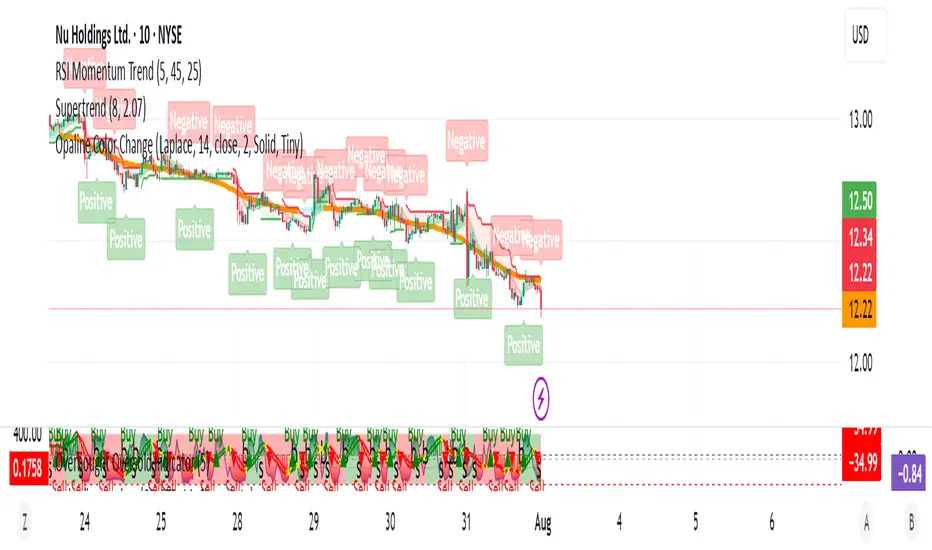
Opaline Color ChangeONLY USE for serious full time trading strategy, or running away from Military/City.
Multi Kernel Regression with Alert.

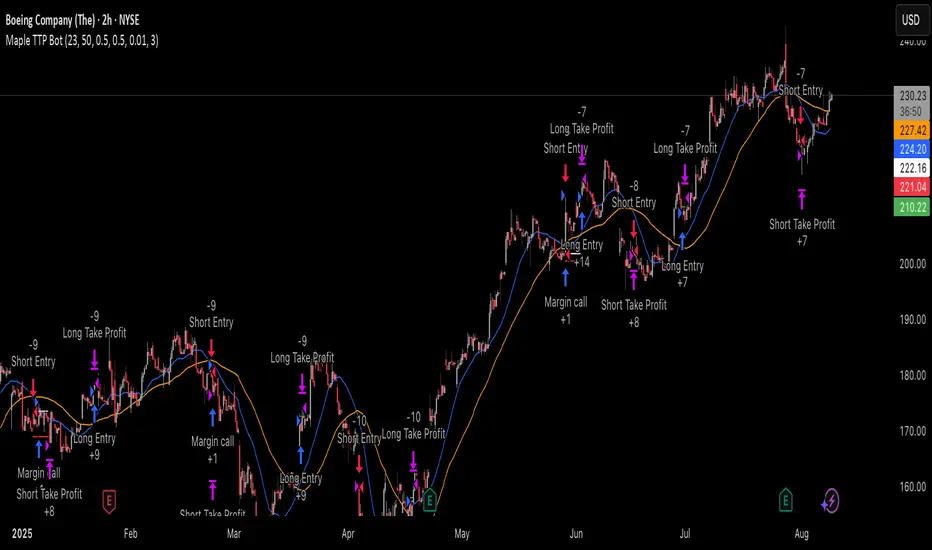
Trailing TP Bot • Crossover-based Trend Strategy using two simple moving averages (SMAs)
• Includes Take Profit and optional Trailing Take Profit
• Trades both long and short
• No pyramiding, i.e., one position at a time
X1 newbie code trying to create
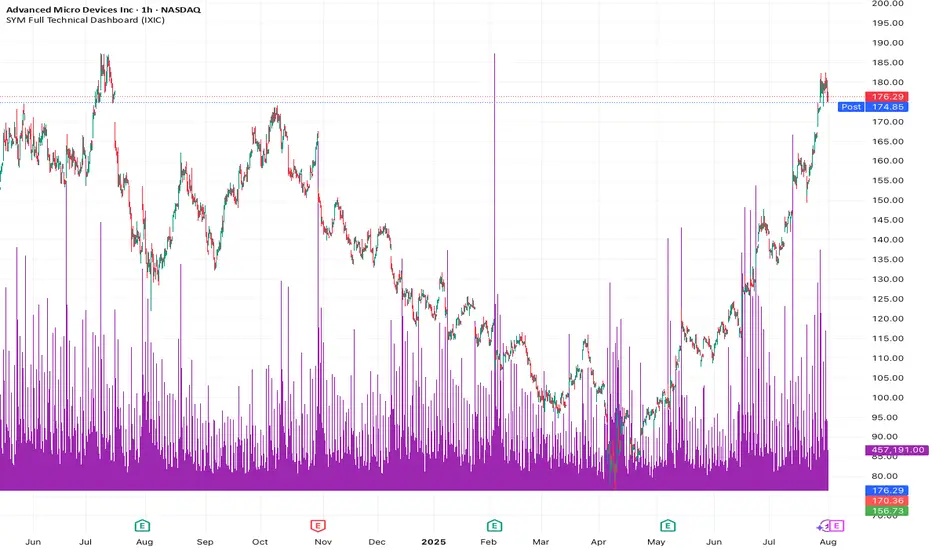
✅ Script Behavior on Other Stocks
• If you’re on a chart for SYM, it calculates indicators using SYM’s data.
• If you switch to NVDA, AVGO, CRDO, etc., it will automatically update to reflect that ticker’s:
• Price
• 50-day moving average
• Volume
• MACD
• RSI
• Index comparison
with 1. 📊 Volume shows in its own pane
2. ✅ MACD and RSI are included in separate panes (as promised)
3. 🎯 Script works cleanly with any ticker
Price Widget on ScreenSimple yet useful script, to see the PRICE/CHANGE of the chart you are on. I use it in my 6/8 charts screen, so you can see the graph and the price.

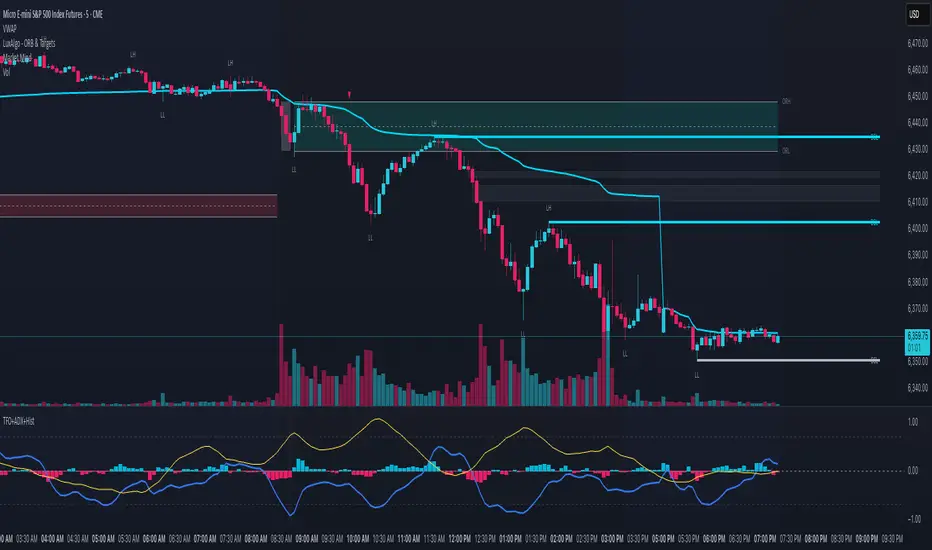
TFO + ADX with Histogram & SignalTrend Flow Oscillator (TFO + ADX) – Histogram + Signal
This version of the original TFO+ADX introduces a MACD-style histogram and signal line overlay for clearer momentum and trend visualization.
The Trend Flow Oscillator (TFO+ADX) blends two powerful volume-based tools — the Money Flow Index (MFI) and Chaikin Money Flow (CMF) — along with a normalized Average Directional Index (ADX). The result is a comprehensive momentum and trend strength tool that offers a more precise read on when markets are gaining or losing conviction.
⸻
How It Works
1.Money Flow Index (MFI)
• Measures volume-weighted buying/selling pressure using price and volume.
• Scaled between –1 and +1 for visual clarity.
2.Chaikin Money Flow (CMF)
• Evaluates volume distribution over time — institutional buying (accumulation) or selling (distribution).
• Also scaled between –1 and +1.
3.TFO Composite Line
• Combines MFI and CMF into a single flow reading.
• A signal line (EMA) tracks the trend of this flow.
• A histogram plots the difference between the TFO and its signal, giving clear signals on shifts in momentum.
4.Normalized ADX Overlay
• Shows trend strength on the same scale (–1 to +1).
• ADX > 0 indicates strong trending conditions.
• ADX < 0 signals weak or consolidating conditions.
⸻
Visual Interpretation
1. Histogram Bars
• Green: TFO is above the signal line → bullish momentum accelerating
• Red: TFO is below the signal line → bearish momentum building
• Bar height represents the strength of the momentum shift
2. Signal Line
• Tracks the smoothed trend of the TFO composite
• Histogram crossing above or below zero reflects momentum crossover and can act as entry or exit signals
3. TFO Raw Line (Optional)
• Still available for reference alongside the histogram
• Shows the unsmoothed blended money flow direction (MFI + CMF)
4. Extreme Zones
• Background shading appears when TFO exceeds ±1.0
• Helps highlight areas of stretched or unsustainable momentum, useful for spotting potential reversals or exhaustion
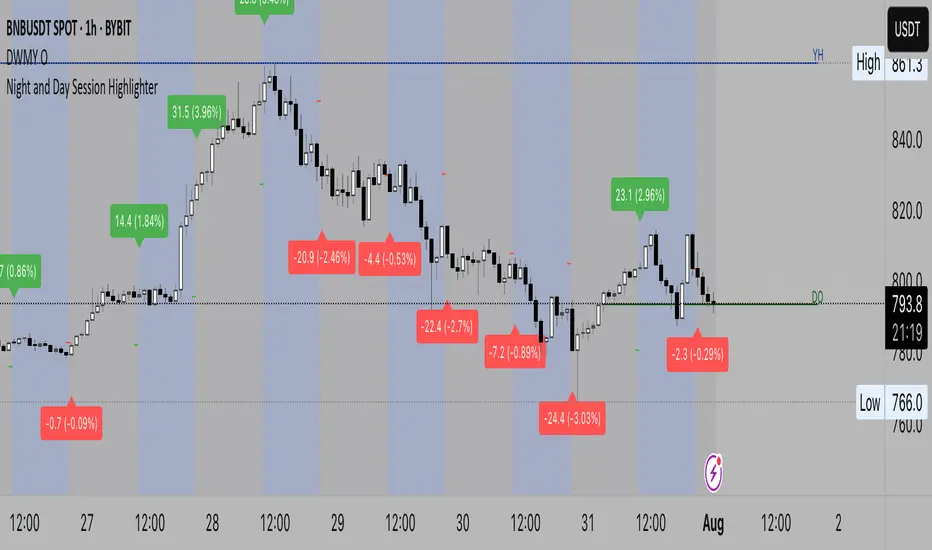
Night and Day Session Highlighter % (Valehson)- This script splits the day into night and day sessions and displays the price change in percentage.
- Этот скрипт разделяет день на вечерние и дневные сессии и показывает изменение цены в процентах.
ENTRY CONFIRMATION V2An indicator from candle man. Helps determine whether supply and demand zone are truly supply or demand.


6E update Session Key Levels Lines (6E CME Day Session)6E update Session Key Levels Lines (6E CME Day Session) hope it helps :)
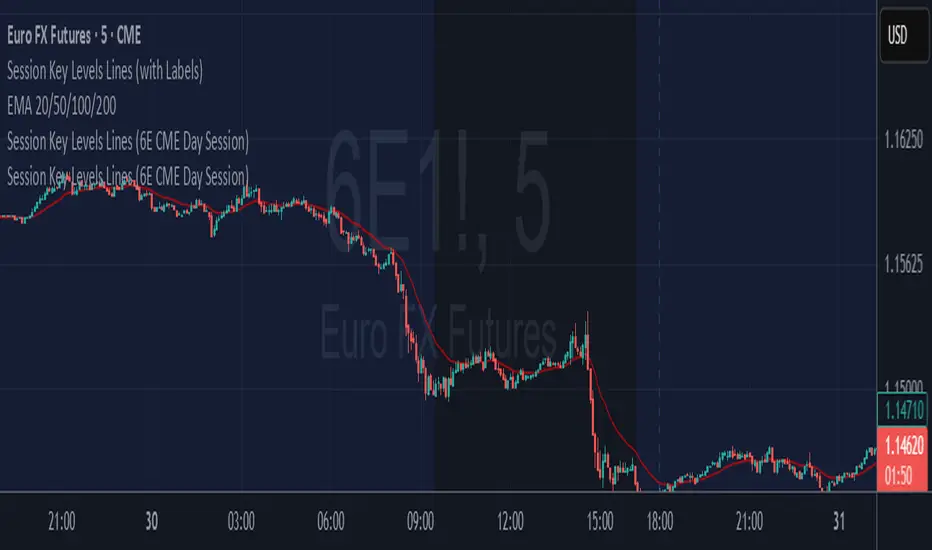
6E update Premarket High/Low Label (CME 6E style)6E update Premarket High/Low Label (CME 6E style). hope it helps :)
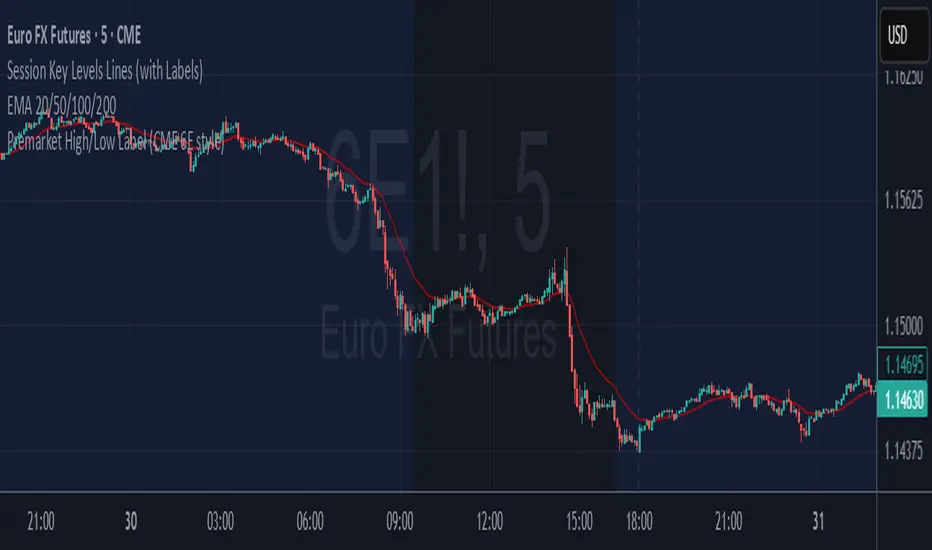
6E update Session Prep (CME Day Session 6E, UTC-4)6E update Session Prep (CME Day Session 6E, UTC-4) updated. hope it helps :)


Donchian + Keltner Channel Strategy with Stops & Alerts BY GOUNIThis script combines Donchian Channels and Keltner Channels to identify potential buy and sell opportunities on the chart. It provides clear visual cues and includes volume labels and dynamic stop loss levels for better trading insights.

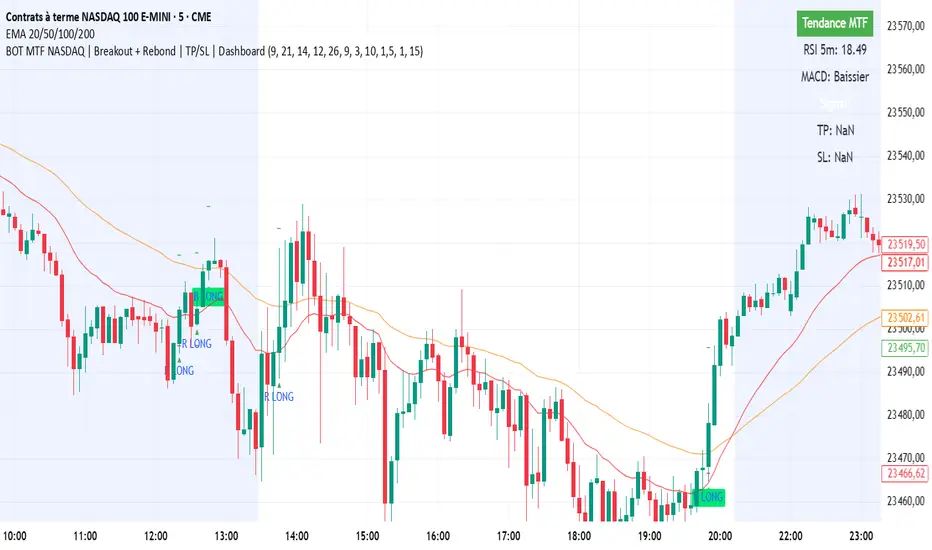
BOT MTF NASDAQ | Breakout + Rebond | TP/SL | DashboardBOT MTF NASDAQ | Breakout + Rebond | TP/SL | Dashboard
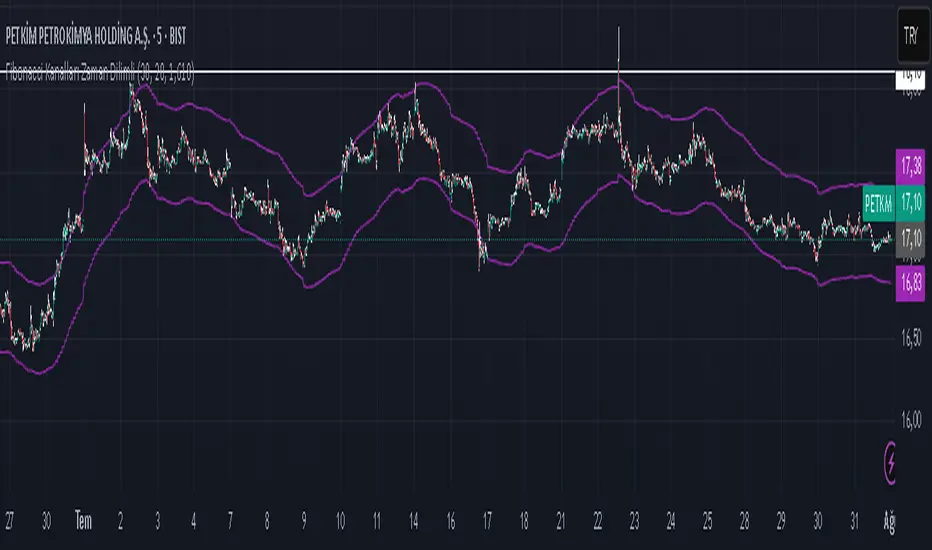
Fibonacci Kanalları Zaman DilimliI understand that you want to fetch moving Fibonacci levels from a different timeframe (fibTimeframe) in Pine Script and plot them on the chart.
Here is a simple example code that:
Takes the timeframe input from settings (fibTimeframe),
Uses request.security() to get data from the selected timeframe,
Calculates Fibonacci levels,
Uses plot() to display the levels on the chart.