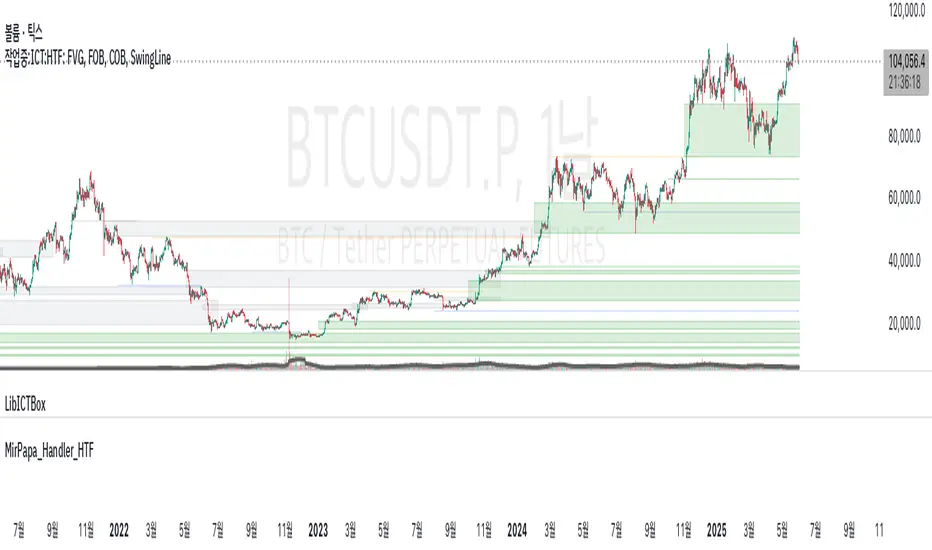
MirPapa_Handler_HTFLibrary "MirPapa_Handler_HTF"
High Time Frame Handler Library:
Provides utilities for working with High Time Frame (HTF) and chart (LTF) conversions and data retrieval.
IsChartTFcomparisonHTF(_chartTf, _htfTf)
IsChartTFcomparisonHTF
@description
Determine whether the given High Time Frame (HTF) is greater than or equal to the current chart timeframe.
Parameters:
_chartTf (string) : The current chart’s timeframe string (examples: "5", "15", "1D").
_htfTf (string) : The High Time Frame string to compare (examples: "60", "1D").
@return
Returns true if HTF minutes ≥ chart minutes, false otherwise or na if conversion fails.
GetHTFrevised(_tf, _case)
GetHTFrevised
@description
Retrieve a specific bar value from a Higher Time Frame (HTF) series.
Supports current and historical OHLC values, based on a case identifier.
Parameters:
_tf (string) : The target HTF string (examples: "60", "1D").
_case (string) : A case string determining which OHLC value and bar offset to request:
"b" → HTF bar_index
"o" → HTF open
"h" → HTF high
"l" → HTF low
"c" → HTF close
"o1" → HTF open one bar ago
"h1" → HTF high one bar ago
"l1" → HTF low one bar ago
"c1" → HTF close one bar ago
… up to "o5", "h5", "l5", "c5" for five bars ago.
@return
Returns the requested HTF value or na if _case does not match any condition.
GetHTFfromLabel(_label)
GetHTFfromLabel
@description
Convert a Korean HTF label into a Pine Script-recognizable timeframe string.
Examples:
"5분" → "5"
"1시간" → "60"
"일봉" → "1D"
"주봉" → "1W"
"월봉" → "1M"
"연봉" → "12M"
Parameters:
_label (string) : The Korean HTF label string (examples: "5분", "1시간", "일봉").
@return
Returns the Pine Script timeframe string corresponding to the label, or "1W" if no match is found.
GetHTFoffsetToLTFoffset(_offset, _chartTf, _htfTf)
GetHTFoffsetToLTFoffset
@description
Adjust an HTF bar index and offset so that it aligns with the current chart’s bar index.
Useful for retrieving historical HTF data on an LTF chart.
Parameters:
_offset (int) : The HTF bar offset (0 means current HTF bar, 1 means one bar ago, etc.).
_chartTf (string) : The current chart’s timeframe string (examples: "5", "15", "1D").
_htfTf (string) : The High Time Frame string to align (examples: "60", "1D").
@return
Returns the corresponding LTF bar index after applying HTF offset. If result is negative, returns 0.
Indicators and strategies
OA - Sigma BandsDescription:
The OA - Sigma Bands indicator is a fully adaptive, volatility-sensitive dynamic band system designed to detect price expansion and potential breakouts. Unlike traditional fixed-width Bollinger Bands, OA - Sigma Bands adjust their boundaries based on a combination of standard deviation (σ) and Average Daily Range (ADR), making them more responsive to real market behavior and shifts in volatility.
Key Concepts & Logic
This tool constructs three distinct band regions:
Sigma Bands (±σ):
Calculated using the standard deviation of the closing price over a user-defined lookback period. This acts as the core volatility filter to identify statistically significant price deviations.
ADR Zones (±ADR):
These zones provide an additional layer based on the percentage average of daily price ranges over the last 20 bars. They help visualize intraday or short-term expected volatility.
Dynamic Adjustment Logic:
When price breaks outside the upper/lower sigma or ADR boundaries for a defined number of bars (user input), the system recalibrates. This ensures that the bands evolve with volatility and don’t remain outdated in trending markets.
Inputs & Customization
Sigma Multiplier: Set how wide the sigma bands should be (default: 1.5).
Lookback Period: Controls how many bars are used to calculate the standard deviation (default: 200).
Break Confirmation Bars: Determines how many candles must close beyond a boundary to trigger band recalibration.
ADR Period: Internally fixed at 20 bars for stable short-term volatility measurement.
Full Color Customization: Customize the band colors and fill transparency to suit your chart style.
Benefits & Use Cases
Breakout Trading: Detect when price exits statistically significant ranges, confirming trend expansion.
Mean Reversion: Use the outer bands as potential reversion zones in sideways or low-volatility markets.
Volatility Awareness: Visually identify when price is compressed or expanding.
Dynamic Structure: The auto-updating nature makes it more reliable than static historical zones.
Overlay-Ready: Designed to sit directly on price charts with minimal clutter.
Disclaimer
This script is intended for educational and informational purposes only. It does not constitute investment advice, financial guidance, or a recommendation to buy or sell any security. Always perform your own research and apply proper risk management before making trading decisions.
If you enjoy this script or find it useful, feel free to give it or leave a comment!

Liquidity Sweep Candlestick Pattern with MA Filter📌 Liquidity Sweep Candlestick Pattern with MA Filter
This custom indicator detects liquidity sweep candlestick patterns—price action events where the market briefly breaks a previous candle’s high or low to trap traders—paired with optional filters such as moving averages, color change candles, and strictness rules for better signal accuracy.
🔍 What is a Liquidity Sweep?
A liquidity sweep occurs when the price briefly breaks the high or low of a previous candle and then reverses direction. These events often occur around key support/resistance zones and are used by institutional traders to trap retail positions before moving the price in the intended direction.
🟢 Bullish Liquidity Sweep Criteria
The current candle is bullish (closes above its open).
The low of the current candle breaks the low of the previous candle.
The candle closes above the previous candle’s open.
Optionally, in Strict mode, it must also close above the previous candle’s high.
Optionally, it can be filtered to only show if the candle changed color from the previous one (e.g., red to green).
Can be filtered to only show when the price is above or below a moving average (if MA filter is enabled).
🔴 Bearish Liquidity Sweep Criteria
The current candle is bearish (closes below its open).
The high of the current candle breaks the high of the previous candle.
The candle closes below the previous candle’s open.
Optionally, in Strict mode, it must also close below the previous candle’s low.
Optionally, it can be filtered to only show if the candle changed color from the previous one (e.g., green to red).
Can be filtered to only show when the price is above or below a moving average (if MA filter is enabled).
⚙️ Features & Customization
✅ Signal Strictness
Choose between:
Less Strict (default): Basic wick break and close conditions.
Strict: Must close beyond the wick of the previous candle.
✅ Color Change Candles Only
Enable this to only show patterns when the candle color changes (e.g., from red to green or green to red). Helps filter fake-outs.
✅ Moving Average Filter (optional)
Supports several types of MAs: SMA, EMA, WMA, VWMA, RMA, HMA
Choose whether signals should only appear above or below the selected moving average.
✅ Custom Visuals
Show short (BS) or full (Bull Sweep / Bear Sweep) labels
Plot triangles or arrows to represent bullish and bearish sweeps
Customize label and shape colors
Optionally show/hide the moving average line
✅ Alerts
Includes alert options for:
Bullish sweep
Bearish sweep
Any sweep
📈 How to Use
Add the indicator to your chart.
Configure the strictness, color change, or MA filters based on your strategy.
Observe signals where price is likely to reverse after taking out liquidity.
Use with key support/resistance levels, order blocks, or volume zones for confluence.
⚠️ Note
This tool is for educational and strategy-building purposes. Always confirm signals with other indicators, context, and sound risk management.

RSI Multi-TF TabRSI Multi-Timeframe Table 📊
A tool for multi-timeframe RSI analysis with visual overbought/oversold level highlighting.
Description
This indicator calculates the Relative Strength Index (RSI) for the current chart and displays RSI values across five additional timeframes (15m, 1h, 4h, 1d, 1w) in a dynamic table. The color-coded system simplifies identifying overbought (>70), oversold (<30), and neutral zones. Visual signals on the chart enhance analysis for the current timeframe.
Key Features
✅ Multi-Timeframe Analysis :
Track RSI across 15m, 1h, 4h, 1d, and 1w in a compact table.
Color-coded alerts:
🔴 Red — Overbought (potential pullback),
🔵 Blue — Oversold (potential rebound),
🟡 Yellow — Neutral zone.
✅ Visual Signals :
Background shading for oversold/overbought zones on the main chart.
Horizontal lines at 30 and 70 levels for reference.
✅ Customizable Settings :
Adjust RSI length (default: 14), source (close, open, high, etc.), and threshold levels.
How to Use
Table Analysis :
Compare RSI values across timeframes to spot divergences (e.g., overbought on 15m vs. oversold on D).
Use colors for quick decisions.
Chart Signals :
Blue background suggests bullish potential (oversold), red hints at bearish pressure (overbought).
Always confirm with other tools (volume, trends, or candlestick patterns).
Examples :
RSI(1h) > 70 while RSI(4h) < 30 → Possible reversal upward.
Sustained RSI(1d) above 50 may indicate a bullish trend.
Settings
RSI Length : Period for RSI calculation (default: 14).
RSI Source : Data source (close, open, high, low, hl2, hlc3, ohlc4).
Overbought/Oversold Levels : Thresholds for alerts (default: 70/30).
Important Notes
No direct trading signals : Use this as an analytical tool, not a standalone strategy.
Test strategies historically and consider market context before trading.

Swing High Low Detector by RV5📄 Description
The Swing High Low Detector is a visual indicator that automatically detects and displays swing highs and swing lows on the chart. Swings are determined based on configurable strength parameters (number of bars before and after a high/low), allowing users to fine-tune the sensitivity of the swing points.
🔹 Current swing levels are shown as solid (or user-defined) lines that dynamically extend until broken.
🔹 Past swing levels are preserved as dashed/dotted lines once broken, allowing traders to see previous support/resistance zones.
🔹 Customizable line colors, styles, and thickness for both current and past levels.
This indicator is useful for:
Identifying key market structure turning points
Building breakout strategies
Spotting trend reversals and swing zones
⚙️ How to Use
1. Add the indicator to any chart on any timeframe.
2. Adjust the Swing Strength inputs to change how sensitive the detector is:
A higher value will filter out smaller moves.
A lower value will capture more frequent swing points.
3. Customize the line styles for visual preference.
Choose different colors, line styles (solid/dashed/dotted), and thickness for:
Current Swing Highs (SH)
Past Swing Highs
Current Swing Lows (SL)
Past Swing Lows
4. Observe:
As new swing highs/lows are detected, the indicator draws a new current level.
Once price breaks that level, the line is archived as a past level and a new current swing is drawn.
✅ Features
Fully customizable styling for all lines
Real-time updates and automatic level tracking
Supports all chart types and instruments
👨💻 Credits
Script logic and implementation by RV5. This script was developed as a tool to improve price action visualization and trading structure clarity. Not affiliated with any financial institution. Use responsibly.

Pin Bar Reversal StrategyStrategy: Pin Bar Reversal with Trend Filter
One effective high-probability setup is a Pin Bar reversal in the direction of the larger trend. A pin bar is a candlestick with a tiny body and a long wick, signaling a sharp rejection of price
By itself, a pin bar often marks a potential reversal, but not all pin bars lead to profitable moves. To boost reliability, this strategy trades pin bars only when they align with the prevailing trend – for example, taking a bullish pin bar while the market is in an uptrend, or a bearish pin bar in a downtrend. The trend bias can be determined by a long-term moving average or higher timeframe analysis.
Why it works: In an uptrend, a bullish pin bar after a pullback often indicates that sellers tried to push price down but failed, and buyers are resuming control. Filtering for pin bars near key support or moving averages further improves odds of success. This aligns the entry with both a strong price pattern and the dominant market direction, yielding a higher win rate. The pin bar’s own structure provides natural levels for stop and target placement, keeping risk management straightforward.
Example Setup:
USDCHF - 4 Hour Chart
Trend SMA 12
Max Body - 34
Min Wick - 66
ATR -15
ATR Stop Loss Multiplier - 2.3
ATR Take Profit Multiplier - 2.9
Minimum ATR to Enter - 0.0025

[Top] Simple Position + SL CalculatorThis indicator is a user-friendly tool designed to help traders easily calculate optimal position sizing, determine suitable stop-loss levels, and quantify maximum potential losses in dollar terms based on their personalized trading parameters.
Key Features:
Position Size Calculation: Automatically computes the number of shares to purchase based on the trader’s total account size and specified percentage of the account allocated per trade.
Stop-Loss Level: Suggests an appropriate stop-loss price point calculated based on the trader’s defined risk percentage per trade.
Max Loss Visualization: Clearly displays the maximum potential loss (in dollars) should the stop-loss be triggered.
Customizable Interface: Provides the flexibility to place the calculation table in different chart positions (Top Left, Top Right, Bottom Left, Bottom Right) according to user preference.
How to Use:
Enter your total Account Size.
Set the desired Position Size as a percentage of your account. (Typically, 1%–5% per trade is recommended for cash accounts.)
Define the Risk per Trade percentage (commonly between 0.05%–0.5%).
Choose your preferred Table Position to comfortably integrate with your trading chart.
Note:
If you identify a technical support level below the suggested stop-loss point, consider reducing your position size to manage the increased risk effectively.
Keep in mind that the calculations provided by this indicator are based solely on standard industry best practices and the specific inputs entered by you. They do not account for market volatility, news events, or any other factors outside the provided parameters. Always complement this indicator with sound technical and fundamental analysis.

Canuck Trading Projection IndicatorCanuck Trading Projection Indicator
Overview
The Canuck Trading Projection Indicator is a powerful PineScript v6 tool designed for TradingView to project potential bullish and bearish price trajectories based on historical price and volume movements. It provides traders with actionable insights by estimating future price targets and assigning confidence levels to each outlook, helping to identify probable market directions across any timeframe. Ideal for both short-term and long-term traders, this indicator combines momentum analysis, RSI filtering, support/resistance detection, and time-weighted trend analysis to deliver robust projections.
Features
Bullish and Bearish Projections: Forecasts price targets for upward (bullish) and downward (bearish) movements over a user-defined projection period (default 20 bars).
Confidence Levels: Assigns percentage confidence scores to each outlook, reflecting the likelihood of the projected price based on historical trends, volatility, and volume.
RSI Filter: Incorporates a 14-period Relative Strength Index (RSI) to validate trends, requiring RSI > 50 for bullish and RSI < 50 for bearish signals.
Support/Resistance Detection: Adjusts confidence levels when projections are near key swing highs/lows (within 2% of average price), boosting confidence by 5% for alignments.
Time-Based Weighting: Prioritizes recent price movements in trend analysis, giving more weight to newer bars for improved relevance.
Customizable Inputs: Allows users to tailor lookback period, projection bars, RSI period, confidence threshold, colors, and label positioning.
Forced Label Spacing: Prevents overlap of bullish and bearish text labels, even for tight projections, using fixed vertical slots when price differences are small (<2% of average price).
Timeframe Flexibility: Works seamlessly across all TradingView timeframes (e.g., 30-minute, hourly, daily, weekly, monthly), adapting projections to the chart’s resolution.
Clean Visualization: Displays projections as green (bullish) and red (bearish) dashed lines, with non-overlapping text labels at the projection endpoints showing price targets and confidence levels.
How It Works
The indicator analyzes historical price and volume data over a user-defined lookback period (default 50 bars) to calculate:
Momentum: Combines price changes and volume to assess trend strength, using a weighted moving average (WMA) for directional bias.
Trend Analysis: Counts bullish (price up, volume above average, RSI > 50) and bearish (price down, volume above average, RSI < 50) trends, weighting recent bars more heavily.
Projections:
Bullish Slope: Positive or flat when momentum is upward, scaled by price change and momentum intensity.
Bearish Slope: Negative or flat when momentum is downward, amplified by bearish confidence for stronger projections.
Projects prices forward by 20 bars (default) using current close plus slope times projection bars.
Confidence Levels:
Base confidence derived from the proportion of bullish/bearish trends, with a 5% minimum to avoid zero confidence.
Adjusted by volatility (lower volatility increases confidence), volume trends, and proximity to support/resistance levels.
Visualization:
Draws projection lines from the current close to the 20-bar future target.
Places text labels at line endpoints, showing price targets and confidence percentages, with forced spacing for readability.
Input Parameters
Lookback Period (default: 50): Number of bars for historical analysis (minimum 10).
Projection Bars (default: 20): Number of bars to project forward (minimum 5).
Confidence Threshold (default: 0.6): Minimum confidence for strong trend indication (0.1 to 1.0).
Bullish Projection Line Color (default: Green): Color for bullish projection line and label.
Bearish Projection Line Color (default: Red): Color for bearish projection line and label.
RSI Period (default: 14): Period for RSI momentum filter (minimum 5).
Label Vertical Offset (%) (default: 1.0): Base offset for labels as a percentage of price range (0.1% to 5.0%).
Minimum Label Spacing (%) (default: 2.0): Minimum vertical spacing between labels for tight projections (0.5% to 10.0%).
Usage Instructions
Add to Chart: Copy the script into TradingView’s Pine Editor, save, and add the indicator to your chart.
Select Timeframe: Apply to any timeframe (e.g., 30-minute, hourly, daily, weekly, monthly) to match your trading strategy.
Interpret Outputs:
Green Line/Label: Bullish price target and confidence (e.g., "Bullish: 414.37, Confidence: 35%").
Red Line/Label: Bearish price target and confidence (e.g., "Bearish: 279.08, Confidence: 41.3%").
Higher confidence indicates a stronger likelihood of the projected outcome.
Adjust Inputs:
Modify Lookback Period to focus on shorter/longer historical trends (e.g., 20 for short-term, 100 for long-term).
Change Projection Bars to adjust forecast horizon (e.g., 10 for shorter, 50 for longer).
Tweak RSI Period or Confidence Threshold for sensitivity to momentum or trend strength.
Customize Colors for visual preference.
Increase Minimum Label Spacing if labels overlap in volatile markets.
Combine with Analysis: Use alongside other indicators (e.g., moving averages, Bollinger Bands) or fundamental analysis to confirm signals, as projections are probabilistic.
Example: TSLA Across Timeframes
Using live TSLA data (close ~346.46 USD, May 31, 2025), the indicator produces:
30-Minute: Bullish 341.93 (13.3%), Bearish 327.96 (86.7%) – Strong bearish sentiment due to intraday volatility.
1-Hour: Bullish 342.00 (33.9%), Bearish 327.50 (62.3%) – Bearish but less intense, reflecting hourly swings.
4-Hour: Bullish 345.52 (73.4%), Bearish 344.44 (19.0%) – Flat outlook, indicating consolidation.
Daily: Bullish 391.26 (68.8%), Bearish 302.22 (31.2%) – Bullish bias from recent uptrend, bearish tempered by longer lookback.
Weekly: Bullish 414.37 (35.0%), Bearish 279.08 (41.3%) – Wide range, reflecting annual volatility.
Monthly: Bullish 396.70 (54.9%), Bearish 296.93 (10.2%) – Long-term bullish optimism.
These results align with market dynamics: short-term intervals capture volatility, while longer intervals smooth trends, providing balanced outlooks.
Notes
Accuracy: Projections are estimates based on historical data and should be used with other analysis tools. Confidence levels indicate likelihood, not certainty.
Timeframe Sensitivity: Short-term intervals (e.g., 30-minute) show larger price swings and higher confidence due to volatility, while longer intervals (e.g., monthly) are more stable.
Customization: Adjust inputs to match your trading style (e.g., shorter lookback for day trading, longer for swing trading).
Performance: Tested on volatile stocks like TSLA, NVIDIA, and others, ensuring robust performance across markets.
Limitations: May produce conservative bearish projections in strong uptrends due to momentum weighting. Adjust lookback or projection_bars for sensitivity.
Feedback
If you encounter issues (e.g., label overlap, projection mismatches), please share your timeframe, settings, or a screenshot. Suggestions for enhancements (e.g., additional filters, visual tweaks) are welcome!
Disclaimer
The Canuck Trading Projection Indicator is provided for educational and informational purposes only. It is not financial advice. Trading involves significant risks, and past performance is not indicative of future results. Always perform your own due diligence and consult a qualified financial advisor before making trading decisions.

Trend Scanner ProTrend Scanner Pro, Robust Trend Direction and Strength Estimator
Trend Scanner Pro is designed to evaluate the current market trend with maximum robustness, providing both direction and strength based on statistically reliable data.
This indicator builds upon the core logic of a previous script I developed, called Best SMA Finder. While the original script focused on identifying the most profitable SMA length based on backtested trade performance, Trend Scanner Pro takes that foundation further to serve a different purpose: analyzing and quantifying the actual trend state in real time.
It begins by testing hundreds of SMA lengths, from 10 to 1000 periods. Each one is scored using a custom robustness formula that combines profit factor, number of trades, and win rate. Only SMAs with a sufficient number of trades are retained, ensuring statistical validity and avoiding curve fitting.
The SMA with the highest robustness score is selected as the dynamic reference point. The script then calculates how far the price deviates from it using rolling standard deviation, assigning a trend strength score from -5 (strong bearish) to +5 (strong bullish), with 0 as neutral.
Two detection modes are available:
Slope mode, based on SMA slope reversals
Bias mode, based on directional shifts relative to deviation zones
Optional features:
Deviation bands for visual structure
Candle coloring to reflect trend strength
Compact table showing real-time trend status
This tool is intended for traders who want an adaptive, objective, and statistically grounded assessment of market trend conditions.

Day Separator with Day LabelsAdjustable day separator that paints vertical lines through the start of day. Default set to GMT however totally customisable.
Has the day of week ladled also which is also optional in position.
there is a check box for a light chart background chart but default is dark background.
Vertical lines are customisable regarding thickness and colour.
Pretty new to it all so welcome feedback and amendment ideas.

Advanced Moving Average ChannelAdvanced Moving Average Channel (MAC) is a comprehensive technical analysis tool that combines multiple moving average types with volume analysis to provide a complete market perspective.
Key Features:
1. Dynamic Channel Formation
- Configurable moving average types (SMA, EMA, WMA, VWMA, HMA, TEMA)
- Separate upper and lower band calculations
- Customizable band offsets for precise channel adjustment
2. Volume Analysis Integration
- Multi-timeframe volume analysis (1H, 24H, 7D)
- Relative volume comparison against historical averages
- Volume trend detection with visual indicators
- Price-level volume distribution profile
3. Market Context Indicators
- RSI integration for overbought/oversold conditions
- Channel position percentage
- Volume-weighted price levels
- Breakout detection with visual signals
Usage Guidelines:
1. Channel Interpretation
- Price within channel: Normal market conditions
- Price above upper band: Potential overbought condition
- Price below lower band: Potential oversold condition
- Channel width: Indicates market volatility
2. Volume Analysis
- High relative volume (>150%): Strong market interest
- Low relative volume (<50%): Weak market interest
- Volume trend arrows: Indicate increasing/decreasing market participation
- Volume profile: Shows price levels with highest trading activity
3. Trading Signals
- Breakout arrows: Potential trend continuation
- RSI extremes: Confirmation of overbought/oversold conditions
- Volume confirmation: Validates price movements
Customization:
- Adjust MA length for different market conditions
- Modify band offsets for tighter/looser channels
- Fine-tune volume analysis parameters
- Customize visual appearance
This indicator is designed for traders who want to combine price action, volume analysis, and market structure in a single, comprehensive tool.

5EMA_BB_ScalpingWhat?
In this forum we have earlier published a public scanner called 5EMA BollingerBand Nifty Stock Scanner , which is getting appreciated by the community. That works on top-40 stocks of NSE as a scanner.
Whereas this time, we have come up with the similar concept as a stand-alone indicator which can be applied for any chart, for any timeframe to reap the benifit of reversal trading.
How it works?
This is essentially a reversal/divergence trading strategy, based on a widely used strategy of Power-of-Stocks 5EMA.
To know the divergence from 5-EMA we just check if the high of the candle (on closing) is below the 5-EMA. Then we check if the closing is inside the Bollinger Band (BB). That's a Buy signal. SL: low of the candle, T: middle and higher BB.
Just opposite for selling. 5-EMA low should be above 5-EMA and closing should be inside BB (lesser than BB higher level). That's a Sell signal. SL: high of the candle, T: middle and lower BB.
Along with we compare the current bar's volume with the last-20 bar VWMA (volume weighted moving average) to determine if the volume is high or low.
Present bar's volume is compared with the previous bar's volume to know if it's rising or falling.
VWAP is also determined using `ta.vwap` built-in support of TradingView.
The Bolling Band width is also notified, along with whether it is rising or falling (comparing with previous candle).
What's special?
We love this reversal trading, as it offers many benifits over trend following strategies:
Risk to Reward (RR) is superior.
It _Does Hit_ stop losses, but the stop losses are tiny.
Means, althrough the Profit Factor looks Nahh , however due to superior RR, end of day it ended up in green.
When the day is sideways, it's difficult to trade in trending strategies. This sort of volatility, reversal strategies works better.
It's always tempting to go agaist the wind. Whole world is in Put/PE and you went opposite and enter a Call/CE. And turns out profitable! That's an amazing feeling, as a trader :)
How to trade using this?
* Put any chart
* Apply this screener from Indicators (shortcut to launch indicators is just type / in your keyboard).
* It will show you the Green up arrow when buy alert comes or red down arrow when sell comes. * Also on the top right it will show the latest signal with entry, SL and target.
Disclaimer
* This piece of software does not come up with any warrantee or any rights of not changing it over the future course of time.
* We are not responsible for any trading/investment decision you are taking out of the outcome of this indicator.

BAFD (Price Action For D.....s)🧠 Overview
This indicator combines multiple Moving Averages (MA) with visual price action elements such as Fair Value Gaps (FVGs) and Swing Points. It provides traders with real-time insight into trend direction, structural breaks, and potential entry zones based on institutional price behavior.
⚙️ Features
1. Multi MA Visualization (SMA & EMA)
- Plots short-, mid-, and long-term moving averages
- Fully customizable: MA type (SMA/EMA) and length per MA
- Dynamic color coding: green for bullish, red for bearish (based on close >/< MA)
2. Fair Value Gaps (FVG) Detection
Detects bullish and bearish imbalances using multiple logic types:
- Same Type: Last 3 candles move in the same direction
- Twin Close: Last 2 candles close in the same direction
- All: Shows all valid FVGs regardless of pattern
Gaps are marked with semi-transparent yellow boxes
Useful for identifying potential liquidity voids and retest zones
3. Swing Highs and Lows
- Automatically identifies major swing points
- Customizable sensitivity (strength setting)
Marked with subtle colored dots for structure identification or support/resistance mapping
📈 Use Cases
- Trend Identification: Visualize momentum on multiple timeframes
- Liquidity Mapping: Spot potential retracement zones using FVGs
- Confluence Building: Combine MA slope, FVG zones, and swing points for refined setups
🛠️ Customizable Settings
- Moving average type and length for each MA
- FVG logic selection and color
- Swing point strength
🔔 Note
This script does not generate buy/sell signals or alerts. It is designed as a visual decision-support tool for discretionary traders who rely on market structure, trend, and price action.

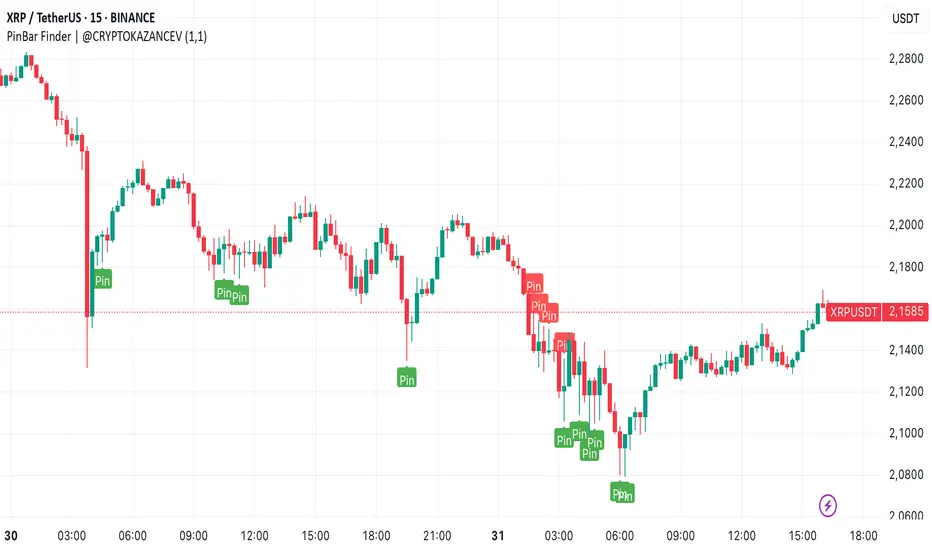
PinBar Finder | @CRYPTOKAZANCEVPinBar Finder | @CRYPTOKAZANCEV
This script helps traders identify high-probability reversal points based on price action, specifically Pin Bars — a well-known candlestick pattern used in technical analysis.
What does the indicator do?
It detects bullish and bearish Pin Bars using a custom method for wick-to-body ratio and filters based on historical volatility (pseudo-ATR). A label appears on the chart with detailed info on wick and body size when a valid signal is found.
How does it work?
- The indicator calculates a pseudo-ATR based on the percentage range of the last 1000 candles.
- It then multiplies this value by a user-defined factor (default: 1.1) to set a dynamic threshold for wick size.
- Bullish Pin Bars are detected when the lower wick is at least 1.1 times the body and greater than the dynamic ATR.
- Bearish Pin Bars are detected when the upper wick meets similar conditions.
- Signals are shown using chart labels with exact wick/body percentages.
- Alerts are included for automation or integration with trading bots.
How to use it?
- Add the indicator to any timeframe and asset.
- Use the alerts to notify you when a Pin Bar appears.
- Ideal for traders who use candlestick reversal strategies or combine price action with other confluence tools.
- You can adjust the wick length multiplier to fit the volatility of the instrument.
What makes it original?
Unlike many public scripts that use fixed ratios, this script adapts wick length detection based on recent volatility (pseudo-ATR logic). This makes it more dynamic and suitable for different markets and timeframes.
Developed by: @ZeeZeeMon
Original author name on chart: @CRYPTOKAZANCEV
This script is open-source and educational. Use at your own discretion.
PinBar Finder | @CRYPTOKAZANCEV
Этот скрипт помогает трейдерам находить точки потенциального разворота на основе прайс-экшена, а именно — свечного паттерна «Пин-бар». Индикатор автоматически определяет бычьи и медвежьи пин-бары с учетом адаптивных параметров волатильности.
Что делает индикатор?
Скрипт ищет свечи, у которых тень в несколько раз превышает тело (пин-бары), и отображает на графике точную информацию о длине тела и тени. Это полезно для трейдеров, использующих свечные сигналы на разворот.
Как работает?
- Рассчитывается псевдо-ATR по 1000 последним свечам на основе процентного диапазона high-low.
- Этот ATR умножается на заданный множитель (по умолчанию: 1.1), чтобы динамически задать минимальную длину тени.
- Бычий пин-бар определяется, когда нижняя тень больше тела в 1.1 раза и превышает ATR.
- Медвежий пин-бар — аналогично, но для верхней тени.
- Индикатор отображает лейблы с точными значениями тела и тени.
- Реализованы условия для оповещений (alerts).
Как использовать?
- Добавьте индикатор на нужный график и таймфрейм.
- Настройте alerts, чтобы не пропустить сигналы.
- Особенно полезен для трейдеров, работающих со свечным анализом, стратегиями разворота, а также в сочетании с другими индикаторами.
В чем оригинальность?
В отличие от многих скриптов, использующих фиксированные параметры, здесь используется динамический расчет длины тени на основе волатильности. Это делает скрипт адаптивным к рынку и таймфрейму.
Разработчик: @ZeeZeeMon
Оригинальное имя автора на графике: @CRYPTOKAZANCEV
Скрипт является открытым и предназначен для образовательных целей. Используйте на своё усмотрение.
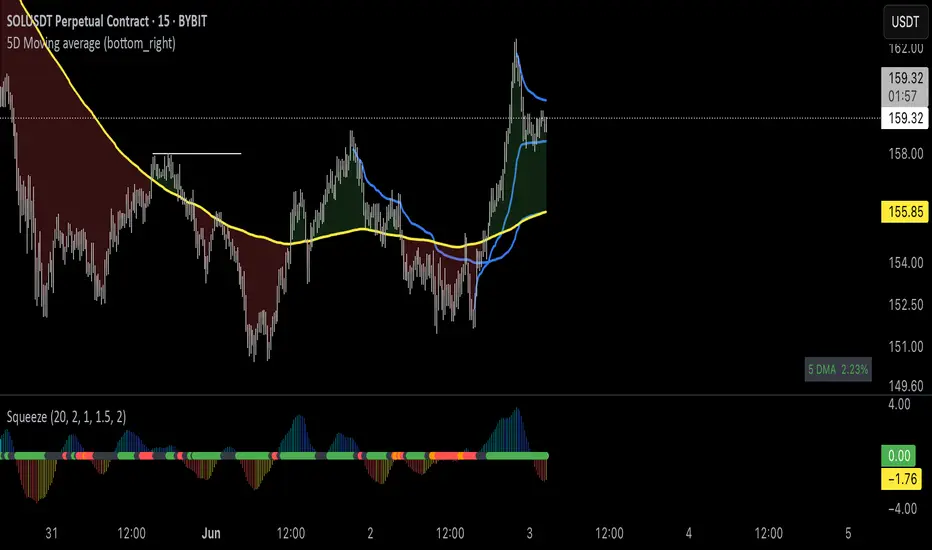
Brian Shannon 5-Day MA BackgroundBrian Shannon 5-Day Moving Average with Dynamic Background Fill
OVERVIEW
This indicator implements Brian Shannon's renowned 5-Day Moving Average methodology from his acclaimed work "Technical Analysis Using Multiple Timeframes." The indicator provides instant visual clarity on short-term trend direction and momentum, making it an essential tool for swing traders and active investors.
KEY FEATURES
• True 5-Day Moving Average: Dynamically calculates the correct period across all timeframes (1min, 5min, 15min, 1H, etc.)
• Visual Price-to-MA Relationship: Color-coded fill between price and the moving average
- Green Fill: Price is above the 5-day MA (bullish short-term momentum)
- Red Fill: Price is below the 5-day MA (bearish short-term momentum)
• Multi-Timeframe Compatible: Works seamlessly on any chart timeframe while maintaining the true 5-day calculation
BRIAN SHANNON'S STRATEGIC APPLICATION
Primary Uses:
1. Trend Identification: Quickly identify short-term momentum shifts
2. Dynamic Support/Resistance: The 5-day MA acts as a moving support level in uptrends and resistance in downtrends
3. Entry Signal Confirmation: Look for pullbacks to the 5-day MA as potential entry points in trending stocks
4. Multi-Timeframe Analysis: Essential component of Shannon's multiple timeframe approach
Perfect Combination with:
• AVWAP (Anchored Volume Weighted Average Price): Use together to identify high-probability setups where price is above both the 5-day MA and AVWAP
• Longer-term Moving Averages: Combine with 20-day and 50-day MAs for complete trend analysis
• Volume Analysis: Confirm 5-day MA signals with volume patterns
TRADING APPLICATIONS
For Swing Traders:
• Bullish Setup: Price above 5-day MA + above AVWAP + above longer-term MAs = Strong uptrend
• Bearish Setup: Price below 5-day MA + below AVWAP + below longer-term MAs = Strong downtrend
• Entry Timing: Use pullbacks to the 5-day MA as entry opportunities in the direction of the primary trend
For Day Traders:
• Quick visual confirmation of intraday momentum
• Dynamic support/resistance levels for scalping opportunities
• Clear trend bias for directional trades
WHY THIS INDICATOR WORKS
Brian Shannon's approach emphasizes that the 5-day moving average represents the short-term sentiment of market participants. When price is consistently above this level, it indicates buyers are in control of short-term price action. Conversely, when price falls below, it suggests selling pressure is dominating.
The visual fill makes it immediately obvious:
• How far price is from the 5-day MA
• The strength of the current short-term trend
• Potential areas where price might find support or resistance
BEST PRACTICES
1. Never use in isolation - Always combine with longer timeframe analysis
2. Volume confirmation - Look for volume expansion on moves away from the 5-day MA
3. Multiple timeframe approach - Check higher timeframes for overall trend direction
4. Combine with AVWAP - Most powerful when both indicators align
INSTALLATION NOTES
This indicator automatically adjusts for any timeframe, ensuring you always get a true 5-trading-day moving average regardless of whether you're viewing 1-minute or hourly charts.
Based on the technical analysis methodology of Brian Shannon, author of "Technical Analysis Using Multiple Timeframes"
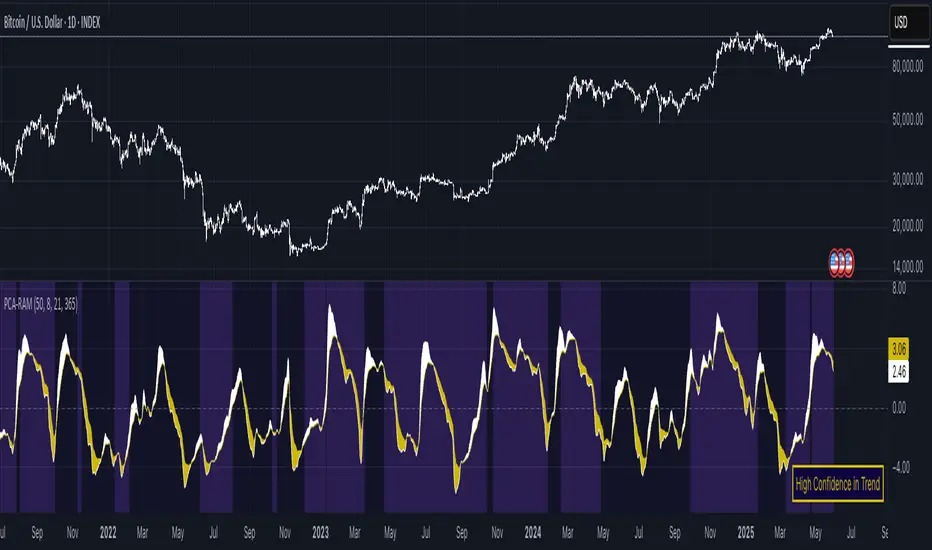
PCA Regime-Adjusted MomentumSummary
The PCA Regime-Adjusted Momentum (PCA-RAM) is an advanced market analysis tool designed to provide nuanced insights into market momentum and structural stability. It moves beyond traditional indicators by using Principal Component Analysis (PCA) to deconstruct market data into its most essential patterns.
The indicator provides two key pieces of information:
A smoothed momentum signal based on the market's dominant underlying trend.
A dynamic regime filter that gauges the stability and clarity of the market's structure, advising you when to trust or fade the momentum signals.
This allows traders to not only identify potential shifts in momentum but also to understand the context and confidence behind those signals.
Core Concepts & Methodology
The strength of this indicator lies in its sound, data-driven methodology.
1. Principal Component Analysis (PCA)
At its core, the indicator analyzes a rolling window (default 50 periods) of standardized market data (Open, High, Low, Close, and Volume). PCA is a powerful statistical technique that distills this complex, 5-dimensional data into its fundamental, uncorrelated components of variance. We focus on the First Principal Component (PC1), which represents the single most dominant pattern or "theme" driving the market's behavior in the lookback window.
2. The Momentum Signal
Instead of just looking at price, we project the current market data onto this dominant underlying pattern (PC1). This gives us a raw "projection score" that measures how strongly the current bar aligns with the historically dominant market structure. This raw score is then smoothed using two an exponential moving averages (a fast and a slow line) to create a clear, actionable momentum signal, similar in concept to a MACD.
3. The Dynamic Regime Filter
This is arguably the indicator's most powerful feature. It answers the question: "How clear is the current market picture?"
It calculates the Market Concentration Ratio, which is the percentage of total market variance explained by PC1 alone.
A high ratio indicates that the market is moving in a simple, one-dimensional way (e.g., a clear, strong trend).
A low ratio indicates the market is complex, multi-dimensional, and choppy, with no single dominant theme.
Crucially, this filter is dynamic. It compares the current concentration ratio to its own recent average, allowing it to adapt to any asset or timeframe. It automatically learns what "normal" and "choppy" look like for the specific chart you are viewing.
How to Interpret the Indicator
The indicator is displayed in a separate pane with two key visual elements:
The Momentum Lines (White & Gold)
White Line: The "Fast Line," representing the current momentum.
Gold Line: The "Slow Line," acting as the trend confirmation.
Bullish Signal: A crossover of the White Line above the Gold Line suggests a shift to positive momentum.
Bearish Signal: A crossover of the White Line below the Gold Line suggests a shift to negative momentum.
The Regime Filter (Purple & Dark Red Background)
This is your confidence gauge.
Navy Blue Background (High Concentration): The market structure is stable, simple, and trending. Momentum signals are more reliable and should be given higher priority.
Dark Red Background (Low Concentration): The market structure is complex, choppy, or directionless. Momentum signals are unreliable and prone to failure or "whipsaws." This is a signal to be cautious, tighten stops, or potentially stay out of the market.
Potential Trading Strategies
This tool is versatile and can be used in several ways:
1. Primary Signal Strategy
Condition: Wait for the background to turn Purple, confirming a stable, high-confidence regime.
Entry: Take the next crossover signal from the momentum lines (White over Gold for long, White under Gold for short).
Exit/Filter: Consider exiting positions or ignoring new signals when the background turns Navy.
2. As a Confirmation or Filter for Your Existing Strategy
Do you have a trend-following system? Only enable its long and short signals when the PCA-RAM background is Purple.
Do you have a range-trading or mean-reversion system? It might be most effective when the PCA-RAM background is Navy, indicating a lack of a clear trend.
3. Advanced Divergence Analysis
Look for classic divergences between price and the momentum lines. For example, if the price is making a new high, but the Gold Line is making a lower high, it may indicate underlying weakness in the trend, even on a Purple background. This divergence signal is more powerful because it shows that the new price high is not being confirmed by the market's dominant underlying pattern.
Correlation MA – 15 Assets + Average (Optional)This indicator calculates the moving average of the correlation coefficient between your charted asset and up to 15 user-selected symbols. It helps identify uncorrelated or inversely correlated assets for diversification, pair trading, or hedging.
Features:
✅ Compare your current chart against up to 15 assets
✅ Toggle assets on/off individually
✅ Custom correlation and MA lengths
✅ Real-time average correlation line across enabled assets
✅ Horizontal lines at +1, 0, and -1 for easy visual reference
Ideal for:
Portfolio diversification analysis
Finding low-correlation stocks
Mean-reversion & pair trading setups
Crypto, equities, ETFs
To use: set the benchmark chart (e.g. TSLA), choose up to 15 assets, and adjust settings as needed. Look for assets with correlation near 0 or negative values for uncorrelated performance.

AutoFib Breakout Strategy for Uptrend AssetsThis trading strategy is designed to help you catch powerful upward moves on assets that are in a long-term uptrend, such as Gold (XAUUSD). It uses a popular technical tool called the Fibonacci Extension, combined with a trend filter and a risk-managed exit system.
✅ When to Use This Strategy
• Works best on higher timeframes: Daily (1D), 3-Day (3D), or Weekly (W).
• Best used on uptrending assets like Gold.
• Designed for swing trading – holding trades from a few days to weeks.
📊 How It Works
1. Find the Trend
We only want to trade in the direction of the trend.
• The strategy uses the 200-period EMA (Exponential Moving Average) to identify if the market is in an uptrend.
• If the price is above the 200 EMA, we consider it an uptrend and allow long trades.
2. Identify Breakout Levels
• The strategy detects recent high and low pivot points to draw Fibonacci extension levels.
• It focuses on the 1.618 Fibonacci level, which is often a target in strong trends.
• When the price breaks above this level in an uptrend, it signals a potential momentum breakout – a good time to buy.
3. Enter a Trade
• The strategy enters a long (buy) position when the price closes above the 1.618 Fibonacci level and the market is in an uptrend (above the 200 EMA).
4. Manage Risk Automatically
• The trade includes a stop-loss set to 1x the ATR (Average True Range) below the entry price – this protects against sudden drops.
• It sets a take-profit at 3x the ATR above the entry – aiming for higher rewards than risks.
⚠️ Important Notes
• 📈 Higher Timeframes Preferred: This strategy works best on Daily (D), 3-Day (3D), and Weekly (W) charts, especially on Gold (XAUUSD).
• 🧪 Not for Deep Backtesting: Due to the nature of how pivot points and Fib levels are calculated, this strategy may not perform well in backtesting simulations (because the historical calculations can shift). It is better used for live analysis and forward testing.

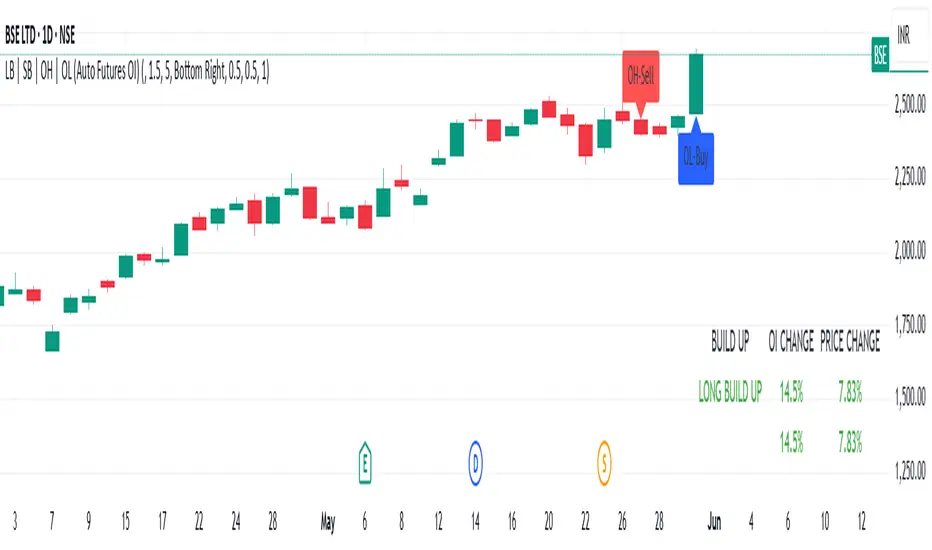
LB | SB | OH | OL (Auto Futures OI)This indicator is for trading purposes, particularly in futures markets given the inclusion of open interest (OI) data.
Indicator Name and Overlay: The indicator is named "LB | SB | OH | OL" and is set to overlay on the price chart (overlay=true).
Override Symbol Input: Users can input a symbol to override the default symbol for analysis.
Open Interest Data Retrieval: It retrieves open interest data for the specified symbol and time frame. If no data is found, it generates a runtime error.
Dashboard Configuration: Users can choose to display a dashboard either at the top right, bottom right, or bottom left of the chart.
Calculations:
It calculates the percentage change in open interest (oi_change).
It calculates the percentage change in price compared to the previous day's close (price_change).
Build Up Conditions:
Long Build Up: When there's a significant increase in open interest (OIChange threshold) and price rises (PriceChange threshold).
Short Build Up: When there's a significant increase in open interest (OIChange threshold) and price falls (PriceChange threshold).
Display Table:
It creates a table on the chart showing the build-up conditions, open interest change percentage, and price change percentage.
Labeling:
It allows for the labeling of buy and sell conditions based on price movements.
Overall, this indicator provides a visual representation of open interest and price movements, helping traders identify potential trading opportunities based on build-up conditions and price behavior.
The "LB | SB | OH | OL" indicator is a tool designed to assist traders in analyzing price movements and open interest (OI) changes in FNO markets. This indicator combines various elements to provide insights into long build-up (LB), short build-up (SB), open-high (OH), and open-low (OL) scenarios.
Key features of the indicator include:
Override Symbol Input: Traders can override the default symbol and input their preferred symbol for analysis.
Open Interest Data: The indicator retrieves open interest data for the selected symbol and time frame, facilitating analysis based on changes in open interest.
Dashboard: The indicator features a customizable dashboard that displays key information such as build-up conditions, OI change, and price change.
Build-Up Conditions: The indicator identifies long build-up and short build-up scenarios based on user-defined thresholds for OI change and price change percentages.
Customization Options: Traders have the flexibility to customize various aspects of the indicator, including colors for long build-up, short build-up, positive OI change, negative OI change, positive price change, and negative price change.
Label Plots: Buy and sell labels are plotted on the chart to highlight potential trading opportunities. Traders can customize the colors and text colors of these labels based on their preferences.
Overall, the "LB | SB | OH | OL" indicator offers traders a comprehensive tool for analyzing price movements and open interest changes, helping them make informed trading decisions in the FNO markets.
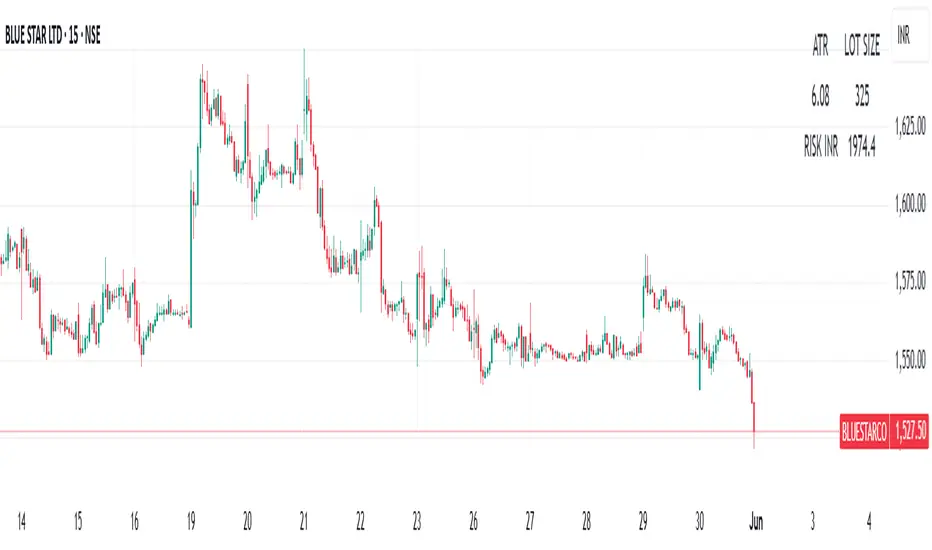
ATR | LOTSIZE | Risk (Futures)This Pine Script is a futures-specific trading utility designed to help F\&O (Futures and Options) traders quickly assess the volatility and position sizing for any selected stock on the chart — even if it's not a futures chart.
What the Script Does:
* Automatically detects the futures symbol for the underlying equity using a dynamic mapping system.
* Calculates the ATR (Average True Range) of the futures contract using either SMA or EMA.
* Fetches the Lot Size (Point Value) of the futures instrument.
* Computes risk per lot by multiplying ATR with lot size (Risk = ATR × Lot Size).
* Displays all 3 values — ATR, Lot Size, and Risk in INR — in a compact table on the chart.
Why This Is Useful for F\&O Traders:
* ✅ Quick Risk Assessment: Helps traders understand how much is at risk per lot without switching to the actual futures chart.
* ✅ Position Sizing: Provides data to calculate how many lots to trade based on a defined risk per trade.
* ✅ Volatility Awareness:ATR gives insights into how much the stock typically moves, guiding stop-loss and target placements.
* ✅ Efficient Workflow:No need to load separate futures charts or lookup lot sizes manually — saves time and reduces error.
This tool is ideal for discretionary and systematic traders who want risk and volatility context for every trade, especially in the NSE Futures & Options segment.
McGinley Dynamic debugged🔍 McGinley Dynamic Debugged (Adaptive Moving Average)
This indicator plots the McGinley Dynamic, a mathematically adaptive moving average designed to reduce lag and better track price action during both trends and consolidations.
✅ Key Features:
Adaptive smoothing: The McGinley Dynamic adjusts itself based on the speed of price changes.
Lag reduction: Compared to traditional moving averages like EMA or SMA, McGinley provides smoother yet responsive tracking.
Stability fix: This version includes a robust fix for rare recursive calculation issues, particularly on low-priced historical assets (e.g., Wipro pre-2000).
⚙️ What’s Different in This Debugged Version?
Implements manual clamping on the source / previous value ratio to prevent mathematical spikes that could cause flattening or distortion in the plotted line.
Ensures more stable behavior across all instruments and timeframes, especially those with historically low price points or volatile early data.
💡 Use Case:
Ideal for:
Trend confirmation
Entry filtering
Adaptive support/resistance visualization
Improving signal precision in low-volatility or high-noise environments
⚠️ Notes:
Works best when combined with volume filters or other trend indicators for validation.
This version is optimized for visual use—for signal generation, consider pairing it with additional logic or thresholds.

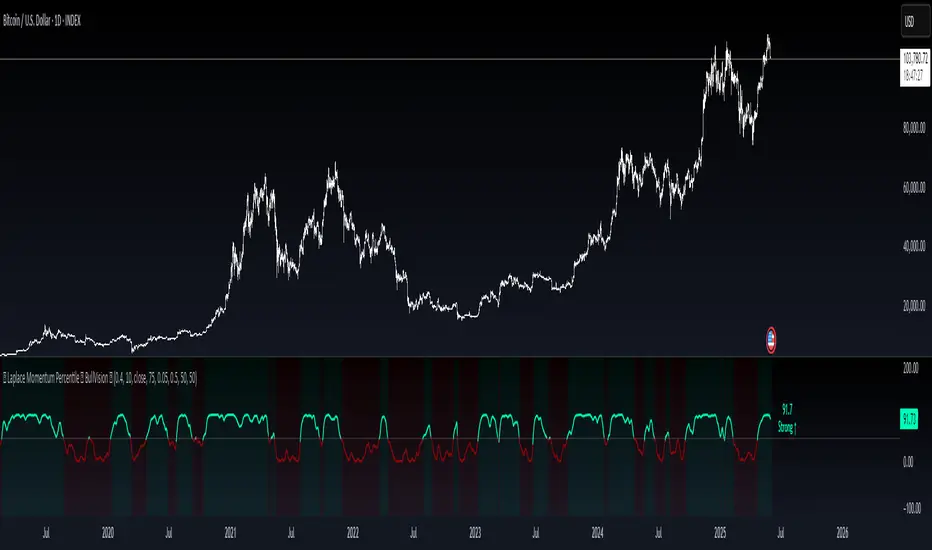
Laplace Momentum Percentile ║ BullVision 🔬 Overview
Laplace Momentum Percentile ║ BullVision is a custom-built trend analysis tool that applies Laplace-inspired smoothing to price action and maps the result to a historical percentile scale. This provides a contextual view of trend intensity, with optional signal refinement using a Kalman filter.
This indicator is designed for traders and analysts seeking a normalized, scale-independent perspective on market behavior. It does not attempt to predict price but instead helps interpret the relative strength or weakness of recent movements.
⚙️ Key Concepts
📉 Laplace-Based Smoothing
The core signal is built using a Laplace-style weighted average, applying an exponential decay to price values over a specified length. This emphasizes recent movements while still accounting for historical context.
🎯 Percentile Mapping
Rather than displaying the raw output, the filtered signal is converted into a percentile rank based on its position within a historical lookback window. This helps normalize interpretation across different assets and timeframes.
🧠 Optional Kalman Filter
For users seeking additional smoothing, a Kalman filter is included. This statistical method updates signal estimates dynamically, helping reduce short-term fluctuations without introducing significant lag.
🔧 User Settings
🔁 Transform Parameters
Transform Parameter (s): Controls the decay rate for Laplace weighting.
Calculation Length: Sets how many candles are used for smoothing.
📊 Percentile Settings
Lookback Period: Defines how far back to calculate the historical percentile ranking.
🧠 Kalman Filter Controls
Enable Kalman Filter: Optional toggle.
Process Noise / Measurement Noise: Adjust the filter’s responsiveness and tolerance to volatility.
🎨 Visual Settings
Show Raw Signal: Optionally display the pre-smoothed percentile value.
Thresholds: Customize upper and lower trend zone boundaries.
📈 Visual Output
Main Line: Smoothed percentile rank, color-coded based on strength.
Raw Line (Optional): The unsmoothed percentile value for comparison.
Trend Zones: Background shading highlights strong upward or downward regimes.
Live Label: Displays current percentile value and trend classification.
🧩 Trend Classification Logic
The indicator segments percentile values into five zones:
Above 80: Strong upward trend
50–80: Mild upward trend
20–50: Neutral zone
0–20: Mild downward trend
Below 0: Strong downward trend
🔍 Use Cases
This tool is intended as a visual and contextual aid for identifying trend regimes, assessing historical momentum strength, or supporting broader confluence-based analysis. It can be used in combination with other tools or frameworks at the discretion of the trader.
⚠️ Important Notes
This script does not provide buy or sell signals.
It is intended for educational and analytical purposes only.
It should be used as part of a broader decision-making process.
Past signal behavior should not be interpreted as indicative of future results.
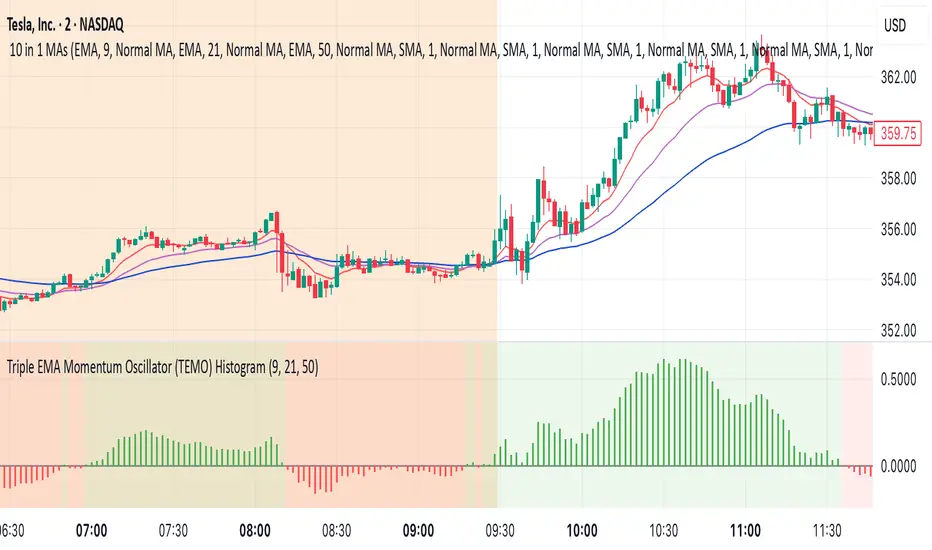
Triple EMA Momentum Oscillator (TEMO) HistogramThis Pine Script code replicates the Python indicator you provided, calculating the Triple EMA Momentum Oscillator (TEMO) and generating signals based on its value and momentum.
Explanation of the Code:
User Inputs:
Allows you to adjust the periods for the short, mid, and long EMAs.
Calculate EMAs:
Computes the Exponential Moving Averages for the specified periods.
Calculate EMA Spreads (Distances):
Finds the differences between the EMAs to understand the spread between them.
Calculate Spread Velocities:
Determines the change in spreads from the previous period, indicating momentum.
Composite Strength Score:
Weighted calculation of the spreads normalized by the EMA values.
Velocity Accelerator:
Weighted calculation of the velocities normalized by the EMA values.
Final TEMO Oscillator:
Combines the spread strength and velocity accelerator to create the TEMO.
Generate Signals:
Signals are generated when TEMO is positive and increasing (buy), or negative and decreasing (sell).
Plotting:
Zero Line: Helps visualize when TEMO crosses from positive to negative.
TEMO Oscillator: Plotted with green for positive values and red for negative values.
Signals: Displayed as a histogram to indicate buy (1) and sell (-1) signals.
Usage:
Buy Signal: When TEMO is above zero and increasing.
Sell Signal: When TEMO is below zero and decreasing.
Note: This oscillator helps identify momentum changes based on EMAs of different periods. It's useful for detecting trends and potential reversal points in the market.